PyramidFx
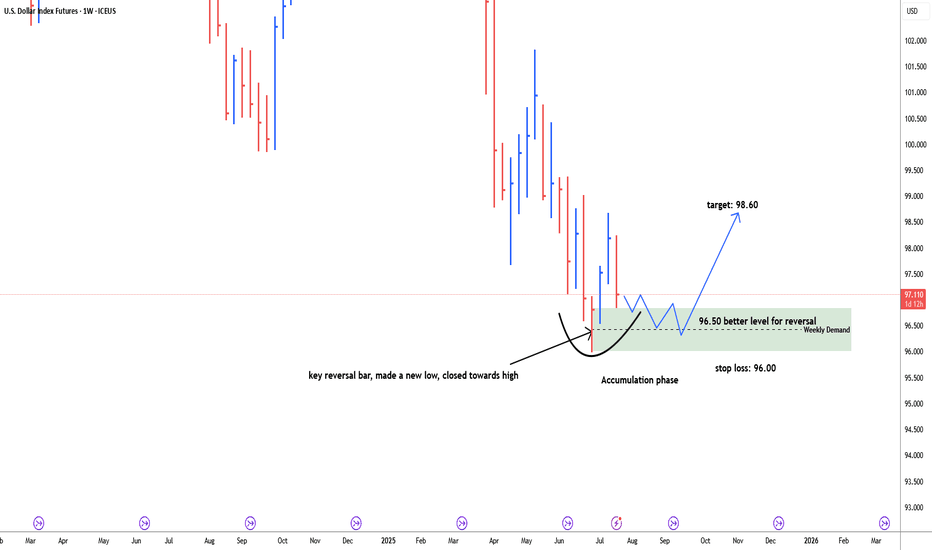
Essential#usddollarindex, last weekly bar of the month of June is key reversal bar, made a new low and closed towards high. price retracing back down to test weekly demand zone. discount zone of demand is 96.50. possible bullish reversal target: 98.60. Stop loss below 96.00. price need time to build energy for bullish momentum. 96.50-96.00 is more secure level for long.
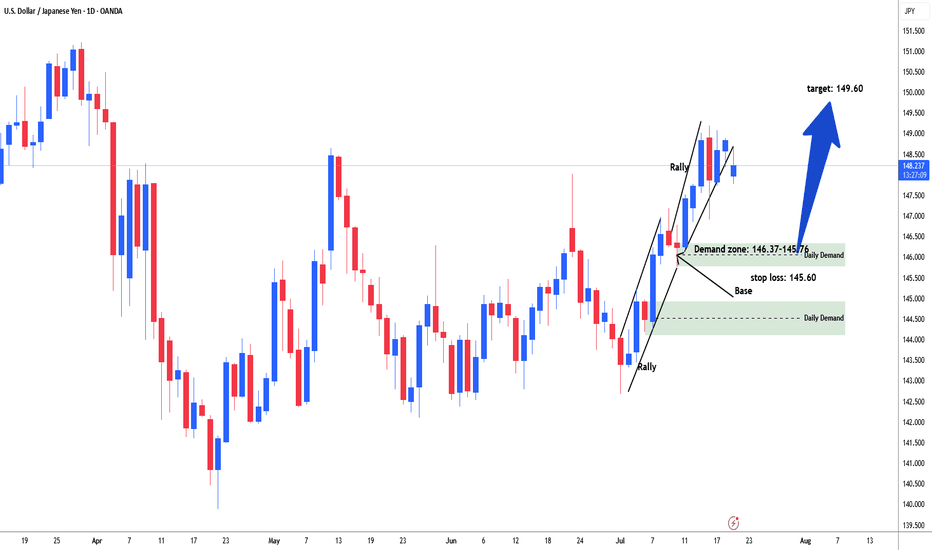
#usdjpy started rally from the start of the month of July. Price consolidate in range between 142.85-10. Then started rally. price again consolidate in range between 147.15-145.76 area. Market build energy and institutional add further longs and broke above the daily resistance line 148.60. Need to sell off / retracement to test demand zone range 146.37-145.78...
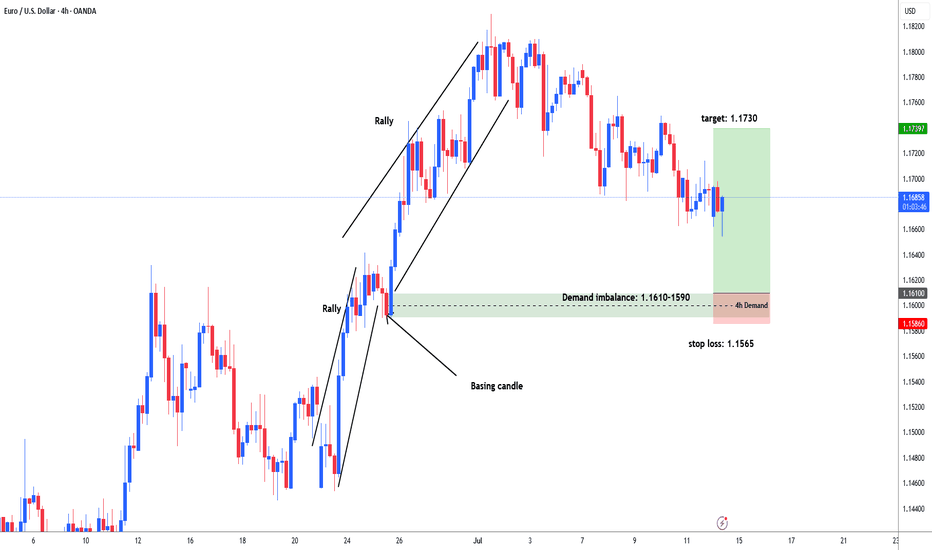
#eurusd market rallied 1.1450 - 1.1640. then consolidation between 1.1580-1640 area. Institutions put more buy orders and price rallied again after bases out and reached upto 1.1830 area. Now market sell off / retracement to test demand area to fill the remaining unfilled order for another leg higher. Demand zone: 1.1610-1.1590. stop loss: 1.1565, target: 1.1730....
#usdchf 21st weekly bar is a key reversal bar, made a new low closed towards high. 16th June weekly inside bar range confined within the range of the previous previous bar i.e. did not make high or low by the previous bar. need a lot of patience for good profit in usdchf long position reason trend is quite bearish. market takes time to neutralize the trend and to...
#usdcad weekly key reversal bar, made a new low, closed off the high, early indication for reversal. It's better to wait for correction 61.8 fib level, 79.0 fib level and 79.0 fib level to reduce/secure drawdwon i.e. 1.3622-1.3585 is the area of interest for long trade. stop loss below key reversal bar i.e. 1.3520. target level: 1.3960
eurgbp weekly chart formed double bottom. eurgbp retraced back to 0.8356 and hold the previous HL (higher low)0.8317, weekly key reversal bar formed , made a new low closed on the high. indication for long for coming days and weeks. stop loss below 0.8317, target 0.8675.
gbpchf in daily timeframe chart forming higher high and higher low. in the bottm made adam bottom, demand zone levels for long are as 1.0990, 1.0960. stop loss: 1.0908. initial target: 1.1130. long term target 1.1350.
#nzdusd distribution phase. 22nd april daily key reversal formed, early and advance indication for reversal. price started distribution. on 7th May also again formed daily key reversal bar. double confirmation for short in coming days. initial target is 0.5800 which may suspect support level and then correction before going down for another let. two possible...
#GBPAUD made a new high, then moved in a range 2.0685-2.1010 for a whole month. now support level 2.0685 broken. better to wait for correction/pullback to test the imbalance area between buyers and sellers. ideal level for short is 2.0960-65. stop loss: 2.1050, target: 2.0450 & 2.0360.
euraud forming lower low and lower high on daily time frame, indication for downtrend. in daily time frame supply zone is quite larger, 1.5760-1.7885. ideal level for short is 1.7820 & 1.7885, stop loss 1.7910. initial target 1.7400, longer term down target is 1.7150.
#cadjpy forming tripple bottom in 4h time frame, large speculators covering huge short positions. 62k shorts position in cad has been reduce which giving impact on cad strength. demand zone for long is 101.60, Sl 101.10, target 103.30 & 103.90.
#eurusd weekly key reversal bar, made a new high closed towards the low which is early indication for bearish reversal. better to wait for 61.8, 70.0 and 79.0 fib level for correction to short to manage drawdown. stop loss above key reversal bar high. initial target might be 1.1100 and next one 1.1000 if breaks below the 1.1100. use low risk in reversal trade.
#usdchf weekly bar is a key reversal bar, made a new low, closed towards high. market liquidity sweep below the previous double bottom. weekly key reversal bar is an early indication for bullish reversal. trend is quite bearish. better to wait for correction i.e. 61.8fib level, 70.0fib level and 79.0fib level as well. stop loss below the key reversal bar. Initial...
usdcad stopped making further lower low in daily time frame. 23rd April daily candle made a higher low, indication for strength for coming days. demand zone for long is 1.3840-3800, stop loss: 1.3780, target: 1.4050-50. even weekly trend is down. reversal/counter trend trade. use lower risk please.
gbpusd tested strong resistance level and high of the year 2024 which is 1.2423. her is weekly supply zone. price may start distribution for big sell. 1.3370-1.3430 weekly supply zone, stop loss place above weekly resistance i.e. 1.3475, target: 1.3030.
daily demand zone range 1.8215-1.8160. sl below the demand zone i.e. 1.8140, target: 1.8395. trend is bullish but price is too expensive for buying so use low risk in trading. last weekly candle is bullish i.e. closing is above the previous week low.
usdjpy broker 156.75 which is high/resistance level for November 2024, price broke below 153.20 resistance level. suspect further down move to test daily demand zone at 150.15, stop loss bit wider 149.15, target: 155.10
#xauusd, on 30th October price test 2790 which is the highest price level in 2024. daily supply zone is bit wider i.e. 2773-2790 that is extreme supply zone before price dropped. trend is still bullish. 2778 is better level for short. stop loss above 2790. initial target 2718. need to break below 2718 for trend reversal confirmation.


