2025 Ends With a Breakout?Year Ends With a Breakout, yes!🚀📈
Bitcoin just delivered what the market was waiting for — a clean breakout back into the channel 🎯
This is how we close the year… with intent.
Key Technicals:
• Major support holding at 88,273 – 88,535
• ATA 200 support confirmed
• Price reclaimed the channel

The best trades require research, then commitment.
Get started for free$0 forever, no credit card needed

Scott "Kidd" PoteetThe unlikely astronaut

Where the world does markets
Join 100 million traders and investors taking the future into their own hands.

Gold Costs 175 Hours Of Work To BuyI like to price everything I buy in hours of work.
That’s the only price that actually matters.
Money can be replaced. Time can’t. When I look at a purchase in terms of how much of my life it costs, it becomes instantly clear whether it’s worth it.
My kids hate me for it because their view is that

JPM — Bullish Channel at Decision PointTechnical Overview
• Price is moving inside a well-defined ascending channel
• Currently testing the upper channel resistance
• Trend remains bullish as long as price holds above the channel midline & SMA
Bullish Scenario
• Confirmation: Strong daily close above the channel top (~330)
• Tar

Silver Price Surpasses $80 for the First Time.Silver Price Surpasses $80 for the First Time. Why Could This Be a Bearish Sign?
As the XAG/USD chart shows, earlier this morning the price of one ounce of silver reached above $83 for the first time. However, this move was followed by an abnormally sharp reversal to the downside.
Why Did the S

Silver’s 2025 Explosion — How High Can It Go?In 2025, Silver ( OANDA:XAGUSD ) has experienced a remarkable surge, making it one of the most notable assets of the year. As we approach the end of 2025, I’ve decided to analyze silver to see how far its bullish trend might continue. So, stay with me as we delve into the reasons behind silver’s ri

Bitcoin vs Gold: The Big Monthly Retest- Price is now back inside a huge support area that has mattered since 2021.
- In the past, this zone often marked bottoms where Bitcoin stopped losing vs gold and sometimes started a new run up.
- Recent move down = gold stronger than BTC lately.
- The idea on the chart:
- Some sideways

Bitcoin ascending channel and Cups -Next cycle Cup entered ? YES
Bitcoin ascending channel and Cups -Next cycle Cup entered
PA entered channel in march 2017 and has never left, other than to go to ATH.
Bitcoin has spent more time in and above this channel than out of it.
Since entering channel, PA has always bounced off the lower line of channel
For the sake

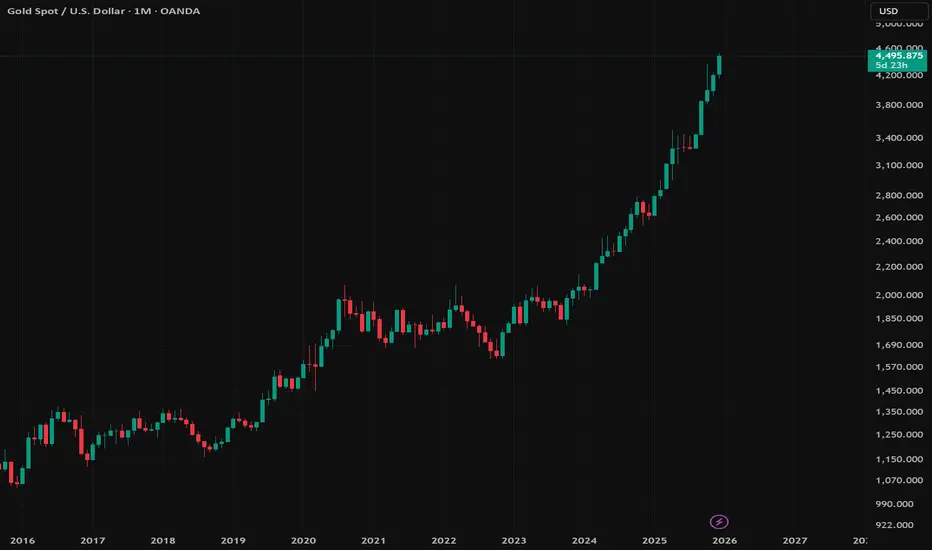
Gold – Potential 2025 Annual High Zone (Ongoing Price Discovery)Gold – Potential 2025 Annual High Zone
Date: December 26, 2025
Current Spot Price: 4489
Context:
Gold remains in an active price discovery phase, and the 2025 annual high has not yet been fully established. Recent upside expansion confirms that the market is still searching for its final year-end e
SPY – Dec 26 Trading Outlook | Trend Support vs Gamma Ceilingit’s now pressing into a zone where trend structure and GEX start to conflict. Tomorrow is about whether this pullback is a pause for continuation or the start of a deeper mean reversion.
Price action / structure (15m)
SPY remains in an intraday uptrend, respecting the rising trendline from the rec

Silver - This metal is blowing up now!💣Silver ( OANDA:XAGUSD ) is rallying even higher:
🔎Analysis summary:
Just a couple of months ago, we witnessed another bullish break and retest on Silver. It was quite obvious that Silver will rally accordingly and just recently, we experienced another +150% rally. However, looking at the hig

See all editors' picks ideas
Arbitrage Detector [LuxAlgo]The Arbitrage Detector unveils hidden spreads in the crypto and forex markets. It compares the same asset on the main crypto exchanges and forex brokers and displays both prices and volumes on a dashboard, as well as the maximum spread detected on a histogram divided by four user-selected percenti

Multi-Distribution Volume Profile (Zeiierman)█ Overview
Multi-Distribution Volume Profile (Zeiierman) is a flexible, structure-first volume profile tool that lets you reshape how volume is distributed across price, from classic uniform profiles to advanced statistical curves like Gaussian, Lognormal, Student-t, and more.
Instead of forcin

Multi-Ticker Anchored CandlesMulti-Ticker Anchored Candles (MTAC) is a simple tool for overlaying up to 3 tickers onto the same chart. This is achieved by interpreting each symbol's OHLC data as percentages, then plotting their candle points relative to the main chart's open. This allows for a simple comparison of tickers to tr

Vdubus Divergence Wave Pattern Generator V1The Vdubus Divergence Wave Theory
10 years in the making & now finally thanks to AI I have attempted to put my Trading strategy & logic into a visual representation of how I analyse and project market using Core price action & MacD. Enjoy :)
A Proprietary Structural & Momentum Confluence System

Per Bak Self-Organized CriticalityTL;DR: This indicator measures market fragility. It measures the system's vulnerability to cascade failures and phase transitions. I've added four independent stress vectors: tail risk, volatility regime, credit stress, and positioning extremes. This allows us to quantify how susceptible markets are

Volatility Risk PremiumTHE INSURANCE PREMIUM OF THE STOCK MARKET
Every day, millions of investors face a fundamental question that has puzzled economists for decades: how much should protection against market crashes cost? The answer lies in a phenomenon called the Volatility Risk Premium, and understanding it may fundam

Volume Gaps & Imbalances (Zeiierman)█ Overview
Volume Gaps & Imbalances (Zeiierman) is an advanced market-structure and order-flow visualizer that maps where the market traded, where it did not, and how buyer-vs-seller pressure accumulated across the entire price range.
The core of the indicator is a price-by-price volume prof

Match Finder [theUltimator5]Match Finder is the dating app of indicators. It takes your current ticker and finds the most compatible match over a recent time period. The match may not be Mr. right, but it is Mr. right now. It doesn't forecast future connection, but it tells you current compatibility for today.
Jokes aside,

Trend Line Methods (TLM)Trend Line Methods (TLM)
Overview
Trend Line Methods (TLM) is a visual study designed to help traders explore trend structure using two complementary, auto-drawn trend channels. The script focuses on how price interacts with rising or falling boundaries over time. It does not generate trade sign

Breakouts & Pullbacks [Trendoscope®]🎲 Breakouts & Pullbacks - All-Time High Breakout Analyzer
Probability-Based Post-Breakout Behavior Statistics | Real-Time Pullback & Runup Tracker
A professional-grade Pine Script v6 indicator designed specifically for analyzing the historical and real-time behavior of price after strong All-Ti

See all indicators and strategies
Community trends
Tesla - The next bullrun is coming!🚗Tesla ( NASDAQ:TSLA ) is clearly breaking out:
🔎Analysis summary:
In mid 2025, Tesla perfectly retested a major confluence of support. After Tesla then created bullish confirmation, the recent strong rally was totally expected. And with the current triangle breakout, Tesla is just starting i

STRATEGY Is this a 2000 Dotcom crash all over?Strategy (MSTR) has been on a strong sell-off since its November 2024 All Time High (ATH). A little more than 1 year of downtrend is classified as a Bear Cycle and it may be no coincidence that this ATH was priced marginally above Strategy's previous ATH of March 2000.
That was at the peak of the i

FJET - Gaps, Demand & the Next Decision Point!📊Markets don’t move randomly... they react to unfinished business.
📈After the explosive post-listing move , Starfighters Space AMEX:FJET left a clear price gap above ($23 - $24 area), followed by a controlled pullback into a well-defined demand zone around the $8 – $9 area.
Since then, price

TSLA: Updated- Wave 4 Deepening – Targets 435-450 or Lower?Summary:
Wave 3 truncated at ATH 498.83. Wave 4 complicated ABC correction underway, with A-wave low ~444 and weak B-wave rebound. C-wave likely deeper amid negative delivery data and sentiment.
Primary Count (60%):
Wave 4 ABC in progress.
B-wave target: 470-480 (weak rebound).
C-wave target: 4

#TMO Good follow up rally going on in #TMO .
I am expecting further upmove ..
Do share your views in comment.

NVDA at a Decision Point – Jan 2 Trading Map & Why GEX Matters.NVDA already showed its hand late in the session. The push higher failed, structure flipped, and price never reclaimed the breakdown area. What stood out wasn’t the move itself — it was how price behaved afterward. Instead of bouncing back aggressively, NVDA accepted below prior structure and went q

“Last key support around 152. If the ascending channel breaks..“Last key support around 152. If the ascending channel breaks, this is the level where a potential re-accumulation could take place.”

Short GOOGBing is the next big thing, I can feel it, 2026, no one's gonna use Google anymore.
Target those 2 levels below.

Datavault AI Inc. (DVLT) Spike 26% Extending Gains to 14% Today Shares of Datavault AI Inc. (NASDAQ; NASDAQ:DVLT ) saw it's price surge over 26% in Wednesdays trading session and while Thursday was a break in the stock market, the stock extended the gains to Friday's premarket session surging 14%.
The stock is eyeing the 61.8% Fib level. A breakout above this

MSTR thoughtsMSTR seems to be in a similar setup to the 2021 sell-off. A lot of potential chop and further lows if we see this follow suit.
Buyers are going to look to step in here, but it may just be a short-term bounce, with very small returns. Mostly chop for the next few months, followed by some lower pric

See all stocks ideas
Jan 5
PKEPark Aerospace Corp.
Actual
—
Estimate
—
Jan 5
LFCRLifecore Biomedical, Inc.
Actual
—
Estimate
−0.14
USD
Jan 6
ANGOAngioDynamics, Inc.
Actual
—
Estimate
−0.10
USD
Jan 6
PENGPenguin Solutions, Inc.
Actual
—
Estimate
0.44
USD
Jan 6
AIRAAR Corp.
Actual
—
Estimate
1.04
USD
Jan 7
CALMCal-Maine Foods, Inc.
Actual
—
Estimate
1.95
USD
Jan 7
MSMMSC Industrial Direct Company, Inc.
Actual
—
Estimate
0.95
USD
Jan 7
ANIXAnixa Biosciences, Inc.
Actual
—
Estimate
−0.09
USD
See more events
Community trends
Bitcoin will die! Silver pumped +200% - GOLD (2026 prediction)Bitcoin will die in 2026, and a lot of traders will get liquidated! Silver pumped by 200% this year, gold by 75%, and the US stock index Nasdaq by 61%, while Bitcoin dropped from 126k to 80k in 2025. I will tell you exactly why in this analysis!
First, let's take a look at Bitcoin and the main reas

BTCUSDT Long: Demand Support Intact, Next Test at $89,000Hello traders! Here’s a clear technical breakdown of BTCUSDT (4H) based on the current chart structure. After a strong bearish impulse, Bitcoin was trading inside a well-defined descending channel, reflecting sustained seller control. This bearish phase ended with a clear breakdown and a sharp react

BITCOIN - Flat holding back the market. Focus on 90K...BINANCE:BTCUSDT.P is forming a local uptrend, based on cascading support generated by the market during low (holiday) liquidity.
Fundamental support for Bitcoin and the cryptocurrency market is still absent, or not felt. Accordingly, it's too early to talk about a bullish reversal, rally, or p

BTCUSDT Pullback to Buyer Zone $87,900 Before Next ExpansionHello traders! Here’s my technical outlook on BTCUSDT (3H) based on the current chart structure. Bitcoin is trading within a broader consolidation phase following a strong bearish impulse earlier in the chart. After the sell-off, price found a clear pivot low, from which buyers stepped in and initia

BTC: Bullish January Setup Inside Bear Flag 🔎 Big picture
- BTC is trading inside a downward bear flag channel, but price is holding the lower support line.
- On the daily, candles have formed an small bull flag, showing tight consolidation after a push up.
📍 Trade idea (short‑term long)
- bullish for the next 2–4 weeks, while the low

BTCUSDT: Range Compression Signals Potential Break Above $90,100Hello everyone, here is my breakdown of the current BTCUSDT setup.
Market Analysis
BTCUSDT is trading within a broader consolidation after a strong bearish impulse earlier in the chart. Following the sell-off, price found a key support base around the 87,300 Support Zone, from which buyers steppe

BTC Approaches Expansion: $72K vs $109KBitcoin remains in a declining phase within a broadening wedge, while current price action is compressing into a clear pennant structure, signaling that a high-volatility expansion is approaching. This is a reaction-based setup, not a prediction.
The plan is straightforward:
• Trade the pennant b

DOGE Bullish Structure in Play (4H)Market makers have aggressively dumped and pumped the price in sharp moves. They don’t want you to easily ride profitable waves; instead, they aim to stop you out or lure you into entering at a point where, after getting in, you’ll feel psychological pressure. The goal is to make you uncomfortable s

Bitcoin (BTC): 2026 Will Be Year Of Bear MarketSo 2026 is here which means a fresh year of opportunities
That being said, I thought to make a very simple TA here of what 2026 might be giving us and what we are expecting to happen as well.
Basically, as price is hovering near the local neckline area just as last time when we were on the edge o

ETH/USD swing trade idea Ethereum's latest major update is the Fusaka Upgrade, activated on December 3, 2025, focusing on scalability and efficiency by introducing features like PeerDAS and Verkle Trees to significantly cut Layer-2 transaction costs, improve data handling, and reduce node load, with major impacts expected f

See all crypto ideas
XAUUSD: Rejection at 4,350 Resistance Signals Further DownsideHello everyone, here is my breakdown of the current XAUUSD setup.
Market Analysis
XAUUSD previously traded within a well-defined upward channel, confirming a strong bullish structure during that phase. Price then broke down from the channel, signaling a loss of bullish momentum and a shift in mar

#XAUUSD(GOLD): First Chart Analysis Of 2026! Good Luck EveryoneGold Trading Setup🏆
🔺Gold has reached an astonishing high of $4550 and many believe it will continue its ascent towards $5000. However, this significant surge wasn’t primarily driven by substantial trading activity; rather, it was largely due to a lack of market movement during the final ten days o

Xauusd short Silver is currently facing a strong resistance, am expecting sell off to $60 per ounce of silver after the break and retest of a major trend line.

XAUUSD 30M – Support Hold & Trendline Break SetupPrice is reacting from a strong support zone around 4,300–4,320 after forming a descending trendline, suggesting a potential short-term reversal.
A break above trendline and resistance at 4,345–4,360 may confirm bullish momentum toward first TP at 4,390–4,400.
Further continuation above 4,405 opens

Silver — Strong Bull Trend, but Is the Correction Really Over?After the explosive rally to a new all-time high near the 84 zone, OANDA:XAGUSD experienced a sharp correction, dropping nearly 15,000 pips — a natural reaction after such an extended move.
Buyers eventually regained control just above the 70 zone, where the market established a solid floor.
Ho

XAUUSD (H1) – Early 2026 OutlookShort-term recovery inside a larger bullish cycle 💛
Quick market recap
2025 performance: Gold surged ~64%, the strongest annual gain since 1979
Recent move: Sharp year-end correction driven by profit-taking and margin adjustments, not trend reversal
Big picture: The multi-year bull market in pre

XAUUSD (H2) – Liam Plan (Jan 02) Price is compressing in a structure, wait for the trendline break to choose direction 🎯
Quick summary
After the strong bearish BOS, gold is rebounding and compressing inside a diagonal structure (triangle/flag-like). Today the clean approach is confirmation trading:
SELL only after a confirmed br

Is the Gold Price Drop a Good Opportunity for Retail Investors?Gold's consolidation presents a good opportunity for retail investors to position themselves.
Yesterday, after a rebound from oversold levels, gold experienced a sharp drop of nearly $100, breaking through the $4300 mark, before a violent rebound. Currently, it's in a consolidation phase, holding a

NQ Range (12-29-25)NAZ is inside the Churn Zone and has been since 10/20/25. White arrow is Long range and Yellow is Short. Watch the divergence developing from the price lift and volume decrease, setting up an Air Pocket drop test.

XAUUSD Fake Breakout at 4,520 - Price Tests Buyer Zone at 4,260Hello traders! Here’s my technical outlook on XAUUSD (4H) based on the current chart structure. Gold is trading within a broader ascending channel, confirming a dominant bullish structure despite the recent sharp pullback. After a strong impulsive rally, price respected the channel support and conti

See all futures ideas
EURUSD Holding Buyer Zone - Rebound Toward 1.1780 in FocusHello traders! Here’s my technical outlook on EURUSD (2H) based on the current chart structure. EURUSD is trading within a broader bullish structure after a strong upside move from the lower levels. Earlier, price advanced inside an ascending channel, confirming sustained buyer control and a sequenc

EURUSD Hello Traders! 👋
What are your thoughts on EURUSD?
EURUSD reacted strongly after reaching a major resistance zone and has now entered a corrective phase.
The price has broken its short-term ascending trendline, which signals a potential shift in market structure and weakening bullish momentum.
We

EURUSD is Nearing an Important Support!Hey Traders, in tomorrow's trading session we are monitoring EURUSD for a buying opportunity around 1.17000 zone, EURUSD is trading in an uptrend and currently is in a correction phase in which it is approaching the trend at 1.17000 support and resistance area.
Trade safe, Joe.

USD/PJY | Going higher? (READ THE CAPTION)As you can see in the 2H chart of USDJPY, it has gone through the FVG and hit the supply zone, but it has dropped to the high of the FVG after reaching the supply zone, trying to bounce back up and not return to the FVG. I expect it to retest the supply zone again.
For the time being, the targets fo

EURUSD Long: Demand at 1.1720 Sets Up a Push Toward 1.1770Hello traders! Here’s a clear technical breakdown of EURUSD (2H) based on the current chart structure. After forming a solid pivot low, EURUSD transitioned into a bullish trend, supported by a rising trend line that guided price action higher. Following this move, the market entered a consolidation

GBP/AUD – 1H chart pattern)...GBP/AUD – 1H chart pattern):
Buy zone: 2.0080 – 2.0100
Target 1: 2.0200
Target 2: 2.0340
Stop Loss: Below 2.0000
Trend shows a pullback with upside continuation toward the marked resistance levels.
If my want short-term scalping targets or a sell setup,

Buy EURGBPEURGBP with a temporary buying opportunity towards 0.87349. A simple support to resistance setup. Would like to see strong bullish moves from this area during the London trading session

EURUSD: Fake Breakout at Resistance Signals Move Toward 1.1680Hello everyone, here is my breakdown of the current EURUSD setup.
Market Analysis
EURUSD previously traded inside a clear downward channel, reflecting sustained bearish pressure during that phase. After forming a base, price broke out of the descending channel and transitioned into a strong upwar

EURUSD Bearish Continuation After Trend BreakQuick Summary
EURUSD remains bearish after the strong sell-off since the start of the week, the Price is expected to continue lower toward 1.17028 after this level Buy positions will only be considered as a mitigation move if a clear retracement target appears
As long as no corrective objective is

EURAUD LONGS AT DEMAND - H4EURAUD longs in play at a H4 demand post a liquidity sweep. Clean setup with 8:1 RR

See all forex ideas
| - | - | - | - | - | - | - | ||
| - | - | - | - | - | - | - | ||
| - | - | - | - | - | - | - | ||
| - | - | - | - | - | - | - | ||
| - | - | - | - | - | - | - | ||
| - | - | - | - | - | - | - | ||
| - | - | - | - | - | - | - | ||
| - | - | - | - | - | - | - |
Trade directly on Supercharts through our supported, fully-verified, and user-reviewed brokers.


