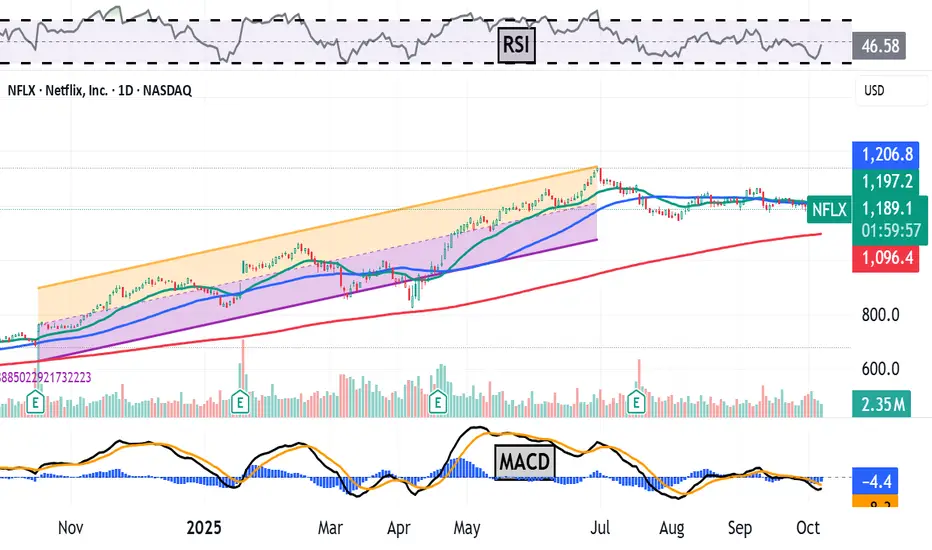
Netflix Is -11% Since June's All-Time High. What Its Chart SaysNetflix NASDAQ:NFLX has fallen more than 10% since hitting an all-time high in June, but the streaming giant is still beating the S&P 500 SP:SPX in the year-to-date, one-year and five-year periods. What does technical and fundamental analysis say is going on?
Let's take a look:
Netflix's Fund

The best trades require research, then commitment.
Get started for free$0 forever, no credit card needed

Scott "Kidd" PoteetThe unlikely astronaut

Where the world does markets
Join 100 million traders and investors taking the future into their own hands.
Major indices
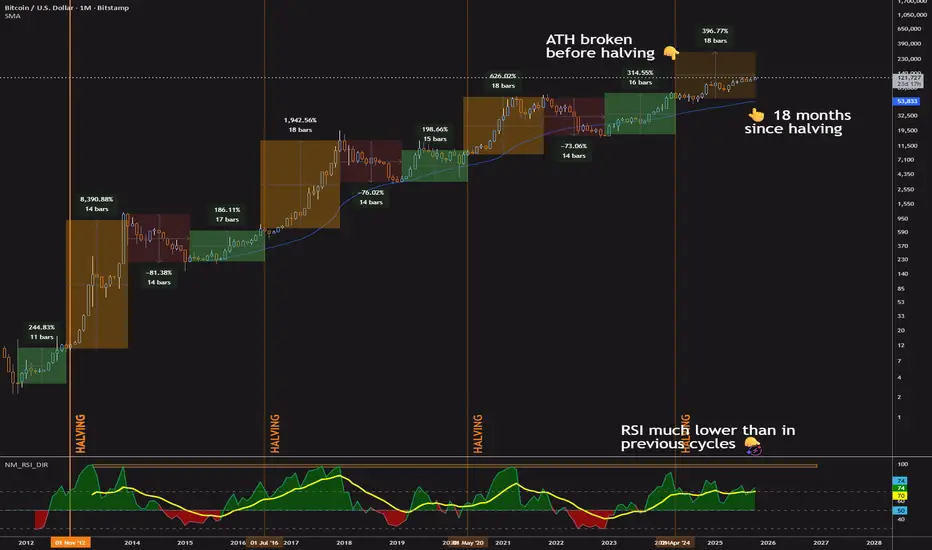
Is Bitcoin's 4-Year Cycle Over? Bitcoin’s 4-year cycle has been a go-to for traders, driven by halving events that spark price surges, sharp corrections, and recovery periods. But something’s off this time.
We’re 18 months into the post-2024 halving rally—hitting the historical peak for bull runs—yet there’s no sign of a crash,
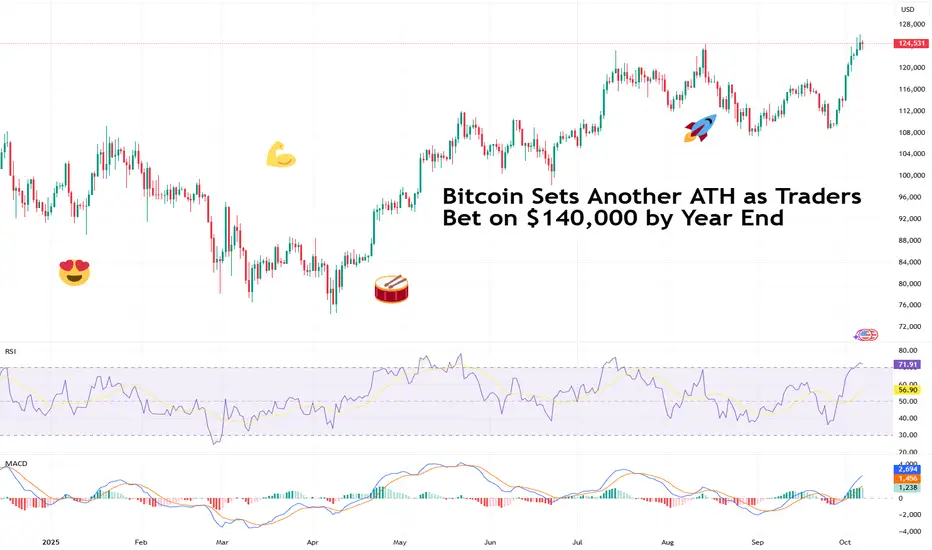
Bitcoin Sets Another ATH as Traders Bet on $140,000 by Year EndBlink and you’ll miss it. Bitcoin’s recent leg up caught lots of traders unprepared. After sinking below $110,000 few weeks back, the OG coin slingshotted to a fresh record high above $126,000 this week. Not a bad way to start October Uptober .
Now, traders are adding to bets that the price will
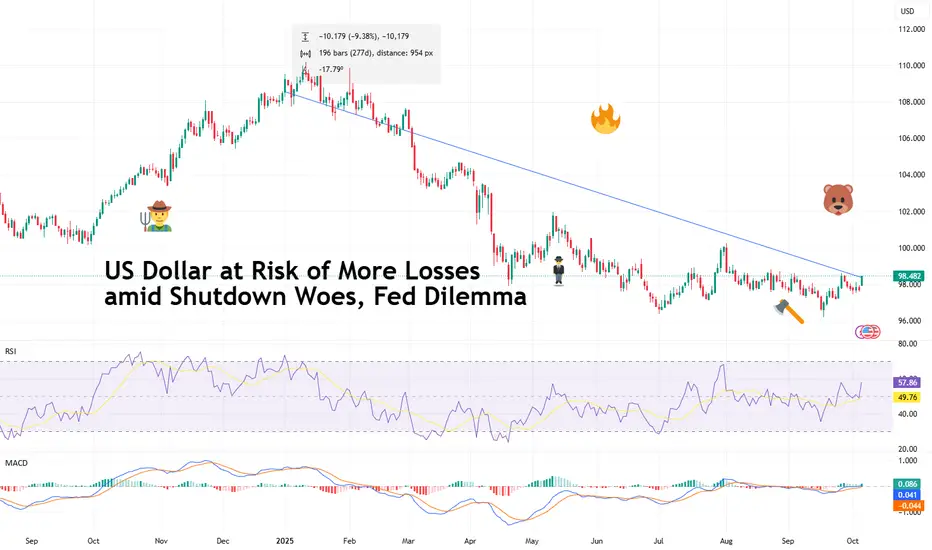
US Dollar at Risk of More Losses amid Shutdown Woes, Fed DilemmaThe US dollar TVC:DXY has been knocked by last week’s US government shutdown and the subsequent economic blackout. At the same time, the Federal Reserve can’t figure out what’s worse – inflation or job crunch.
After Congress failed to pass a funding bill, the government officially went dark at
Retro Editors' picks 2024Closing our retro EP selection , we present to you the last collection of additional scripts that have earned a spot in our Editors' picks, in this case from 2024.
These retrospective selections reflect our continued commitment to honoring outstanding contributions in our community, regardless of

SILVER (XAG/USD): One More Bullish Wave is Coming?!⚠️ SILVER appears to be confined within a horizontal range, as observed on the 4-hour chart. The price is currently nearing the upper limit of this range.
Given the prevailing strong bullish trend, there is a considerable likelihood of a continued upward movement.
A breakout and a 4-hour candle cl

Gold Continues to Challenge Record Resistance Levels👋Hello everyone, what are your thoughts on OANDA:XAUUSD ?
As of this writing, gold continues its upward momentum, having reached new highs as investors increase their bets on the Federal Reserve cutting interest rates in the near future. The concerns over the U.S. government shutdown and global e
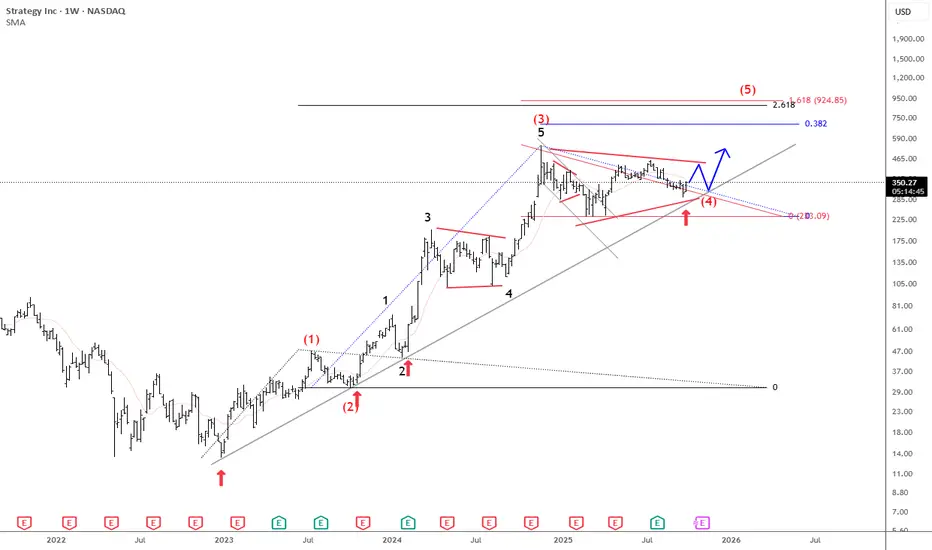
Microstrategy Is Still Pointing Higher For The Final 5th WaveMicrostrategy is a US business intelligence and software company, but it has become best known for its aggressive Bitcoin strategy. Under co-founder Michael Saylor, the company shifted from focusing mainly on software to also using Bitcoin as its primary treasury reserve asset.
Since 2020, MicroStra
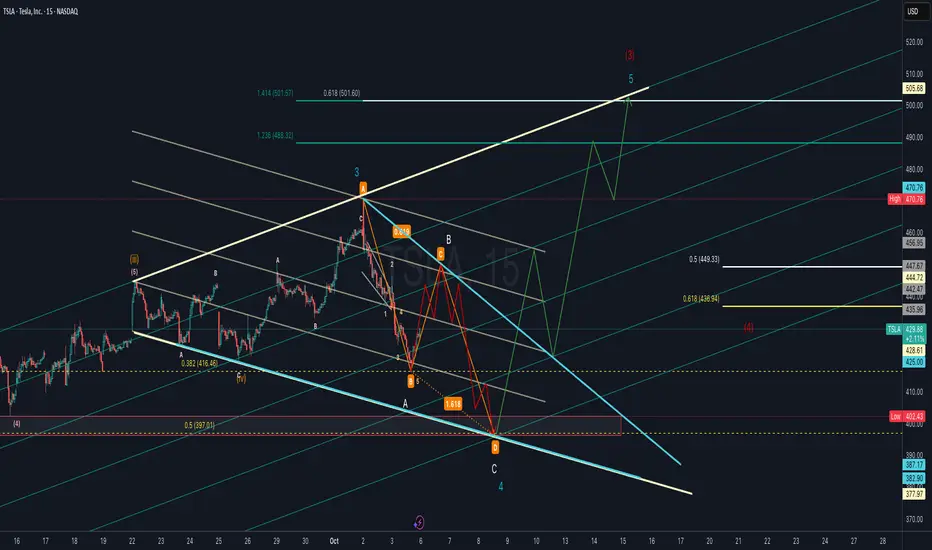
TSLA Elliott Wave Count with ABC Harmonic or Flat Corrective Tesla (TSLA) is forming a potential Wave 4 correction that aligns with an ABC harmonic structure. Price action suggests a possible deeper retracement into the 0.5–0.618 Fibonacci support zone (436–449 area) before resuming its larger uptrend.
If Wave 4 completes near the harmonic “D” zone (highligh
NVDA Ready for Takeoff: $200 Target in Sight!
Based on the daily chart of NVIDIA (NVDA) on NASDAQ, here’s a breakdown:
🔎 Technical Analysis
Overall Trend
The stock is in a strong uptrend (rallying from around $120 to the current $186).
Higher lows are forming, and price is pressing against the 185–187 resistance zone, showing strong buying

See all editors' picks ideas
PongExperience PONG! The classic arcade game, now on your charts!
With this indicator, you can finally achieve your lifelong dream of beating the Markets. . . at PONG!
Pong is jam-packed with features! Such as:
2 Paddles
A moving dot
Floating numbers
The idea of a net
This indicator is solel

Options Max Pain Calculator [BackQuant]Options Max Pain Calculator
A visualization tool that models option expiry dynamics by calculating "max pain" levels, displaying synthetic open interest curves, gamma exposure profiles, and pin-risk zones to help identify where market makers have the least payout exposure.
What is Max Pain?
Max

Volume Profile 3D (Zeiierman)█ Overview
Volume Profile 3D (Zeiierman) is a next-generation volume profile that renders market participation as a 3D-style profile directly on your chart. Instead of flat histograms, you get a depth-aware profile with parallax, gradient transparency, and bull/bear separation, so you can see w

RiskMetrics█ OVERVIEW
This library is a tool for Pine programmers that provides functions for calculating risk-adjusted performance metrics on periodic price returns. The calculations used by this library's functions closely mirror those the Broker Emulator uses to calculate strategy performance metrics (

Simple Decesion Matrix Classification Algorithm [SS]Hello everyone,
It has been a while since I posted an indicator, so thought I would share this project I did for fun.
This indicator is an attempt to develop a pseudo Random Forest classification decision matrix model for Pinescript.
This is not a full, robust Random Forest model by any stretch o

Tick CVD [Kioseff Trading]Hello!
This script "Tick CVD" employs live tick data to calculate CVD and volume delta! No tick chart required.
Features
Live price ticks are recorded
CVD calculated using live ticks
Delta calculated using live ticks
Tick-based HMA, WMA, EMA, or SMA for CVD and price
Key tick levels (S

analytics_tablesLibrary "analytics_tables"
📝 Description
This library provides the implementation of several performance-related statistics and metrics, presented in the form of tables.
The metrics shown in the afforementioned tables where developed during the past years of my in-depth analalysis of various str

Adaptive Trend Classification: Moving Averages [InvestorUnknown]Adaptive Trend Classification: Moving Averages
Overview
The Adaptive Trend Classification (ATC) Moving Averages indicator is a robust and adaptable investing tool designed to provide dynamic signals based on various types of moving averages and their lengths. This indicator incorporates multipl

Statistics • Chi Square • P-value • SignificanceThe Statistics • Chi Square • P-value • Significance publication aims to provide a tool for combining different conditions and checking whether the outcome is significant using the Chi-Square Test and P-value.
🔶 USAGE
The basic principle is to compare two or more groups and check the results

FiniteStateMachine🟩 OVERVIEW
A flexible framework for creating, testing and implementing a Finite State Machine (FSM) in your script. FSMs use rules to control how states change in response to events.
This is the first Finite State Machine library on TradingView and it's quite a different way to think about your

See all indicators and strategies
Community trends
Tesla - The massive triangle breakout!🪩Tesla ( NASDAQ:TSLA ) is breaking out:
🔎Analysis summary:
Last month, we witnessed an incredible but expected rally of about +35% on Tesla. Furthermore, with this move Tesla is attempting to break above the previous all time highs. After bullish confirmation, this would also lead to a massiv

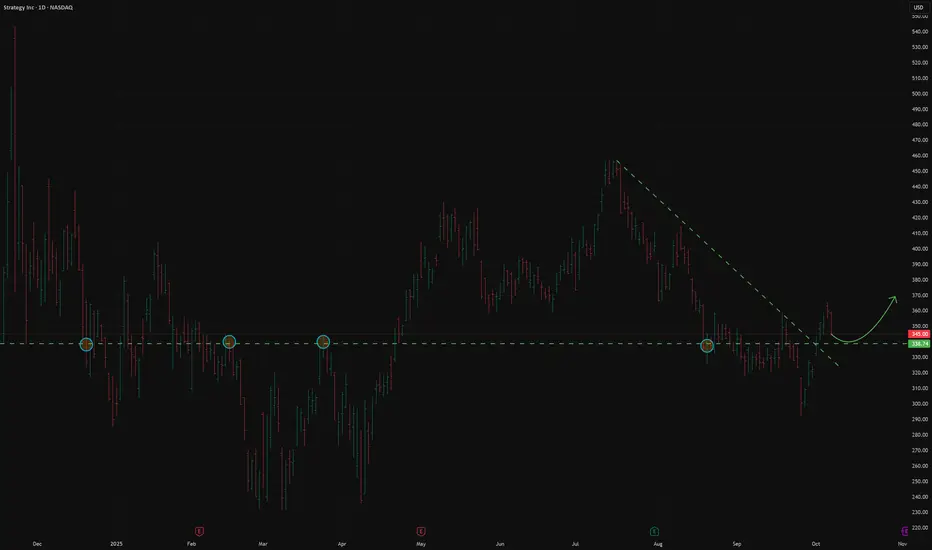
MSTR US🌎MicroStrategy pioneered the use of Bitcoin as a corporate reserve asset. This strategy transformed MSTR from a traditional technology company into a unique hybrid: a provider of analytics solutions and a publicly traded instrument for indirect exposure to Bitcoin.
As of September 2025, the company
Netflix Is -11% Since June's All-Time High. What Its Chart SaysNetflix NASDAQ:NFLX has fallen more than 10% since hitting an all-time high in June, but the streaming giant is still beating the S&P 500 SP:SPX in the year-to-date, one-year and five-year periods. What does technical and fundamental analysis say is going on?
Let's take a look:
Netflix's Fund
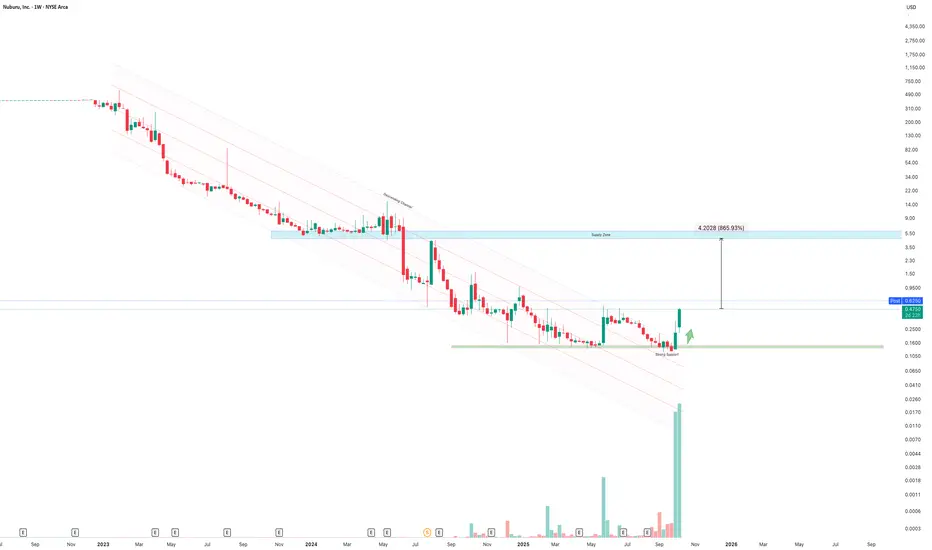
Buru to $5.00 NearTerm?!The chart illustrates a confirmed breakout from a long-term descending channel following an extended period of accumulation near strong support around $0.16–$0.20. A powerful volume surge — the largest in the stock’s history — confirms strong momentum and potential trend reversal.
Price has now clo
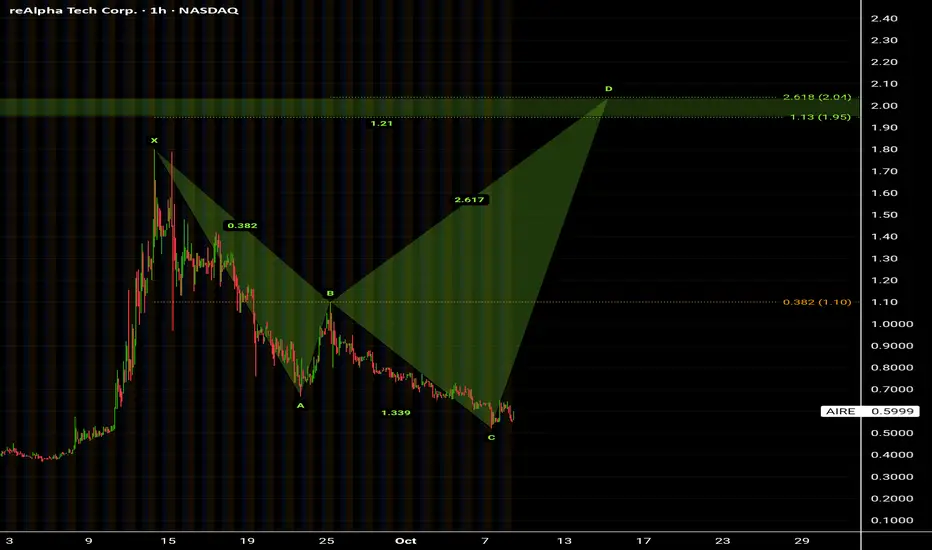
ReAlpha tech corp ( AIRE )Stock on triggering level as I noticed.
Anti Gartley harmonic shap formation pattern on progress.
By breaking up level 1.10 💥 point (B) , the pattern will be activated.
Target prices in the zone between 1.95$ - 2.04$ .
Highly recommended for Buying from present level 👌
I knew it is not expec
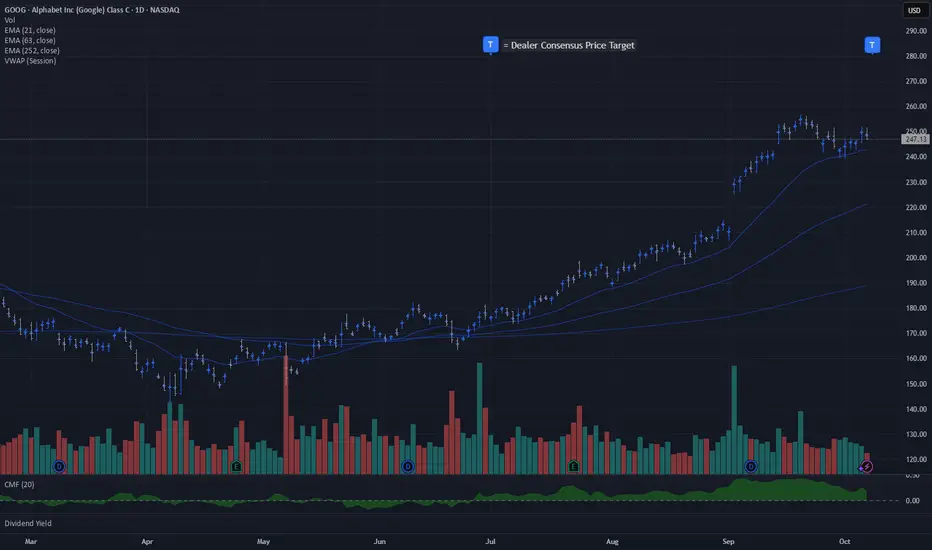
GOOG | Dealer Consensus Price Target $281Special appearance of a mega-cap on the top ranked dealer positioned names.
AWS REVENUE CONCERNS EASED! AMZN EARNINGS MULLIGAN! FULL PORT + NEXT 2 WEEKS OF AMAZON DRIVER WAGES INTO CALLS
26 x 285c 12/19, 5x 280c 11/21
Speculation: We melt up to 235 then pop north for ~10% on the earnings beat + rate cut with SPY 700 EOY projections (In line with GOLDMAN SACHS and WELLS FARGO )
6 of the last 8 earnings reports for AMZN

MARA the bitcoin minerIf MARA breaks $25 and holds it on volume — that’s we have lift off.
It will signals renewed strength in Bitcoin miners, and MARA tends to lead that charge when the crypto market runs hot.

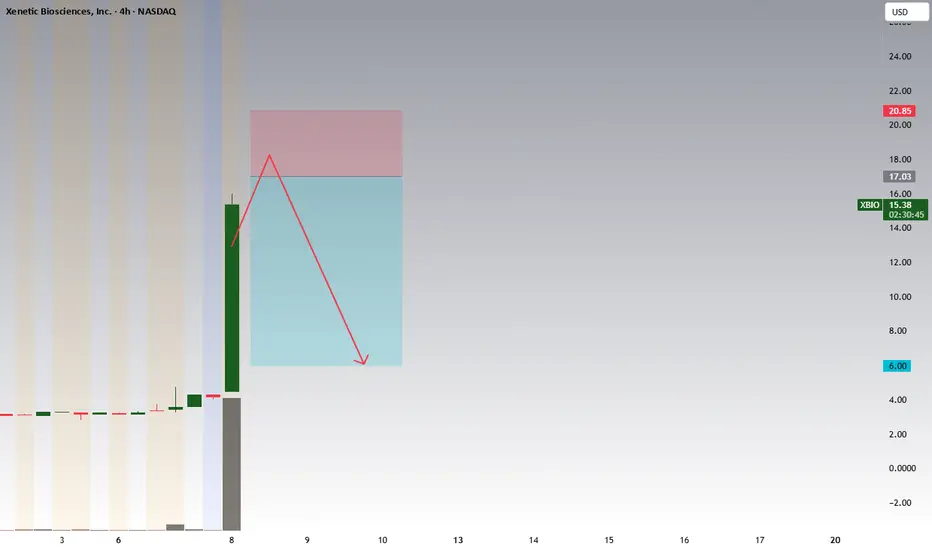
XBIO – Over-Rotated Microfloat Forming the First Red Daily CloseTicker: XBIO
Float: ~1.25 M shares
Volume: ≈ 5.5 M shares → 4.4× float rotation
Dollar Volume: ≈ 59 M USD
Move: +266 % today
Type: Parabolic microfloat blow-off
🧩 Thesis
XBIO completed a full-float rotation and printed a parabolic move — the kind of setup that often signals retail exhaustion.
Now
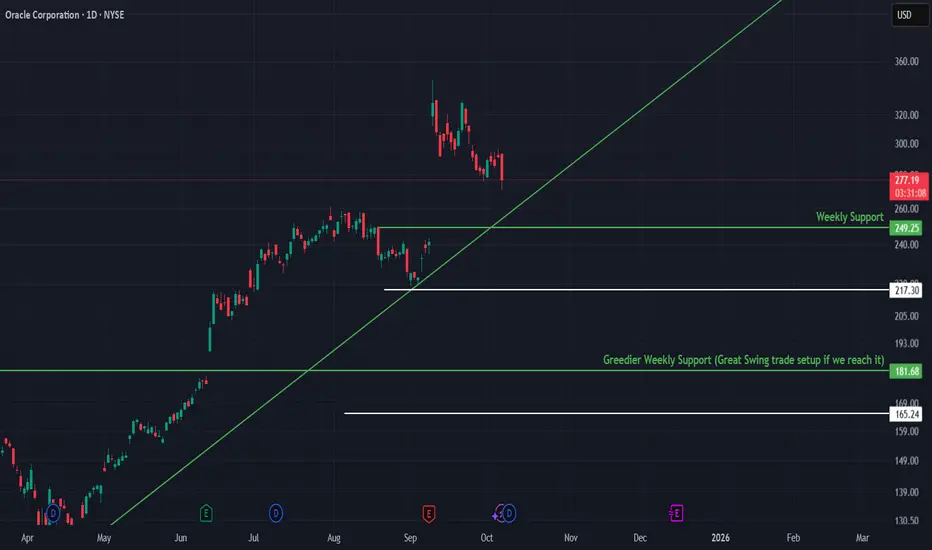
Oracle Corporation (ORCL) – Technical & Fundamental OutlookAfter a strong multi-month rally, Oracle (ORCL) recently broke below its short-term trendline, signaling a cool-off in momentum 📉 after months of steady gains.
Currently, price is holding around $275, with the next key weekly support near $249, which could offer a technical rebound opportunity if bu
See all stocks ideas
Today
CMTLComtech Telecommunications Corp.
Actual
—
Estimate
−0.75
USD
Today
VFSVinFast Auto Ltd.
Actual
—
Estimate
−0.26
USD
Today
MAYSJ. W. Mays, Inc.
Actual
—
Estimate
—
Today
LFCRLifecore Biomedical, Inc.
Actual
—
Estimate
−0.31
USD
Today
GMGIGolden Matrix Group, Inc.
Actual
—
Estimate
−0.00
USD
Today
BSETBassett Furniture Industries, Incorporated
Actual
0.09
USD
Estimate
0.09
USD
Today
RGPResources Connection, Inc.
Actual
−0.07
USD
Estimate
−0.20
USD
Today
RELLRichardson Electronics, Ltd.
Actual
0.13
USD
Estimate
0.02
USD
See more events
Community trends
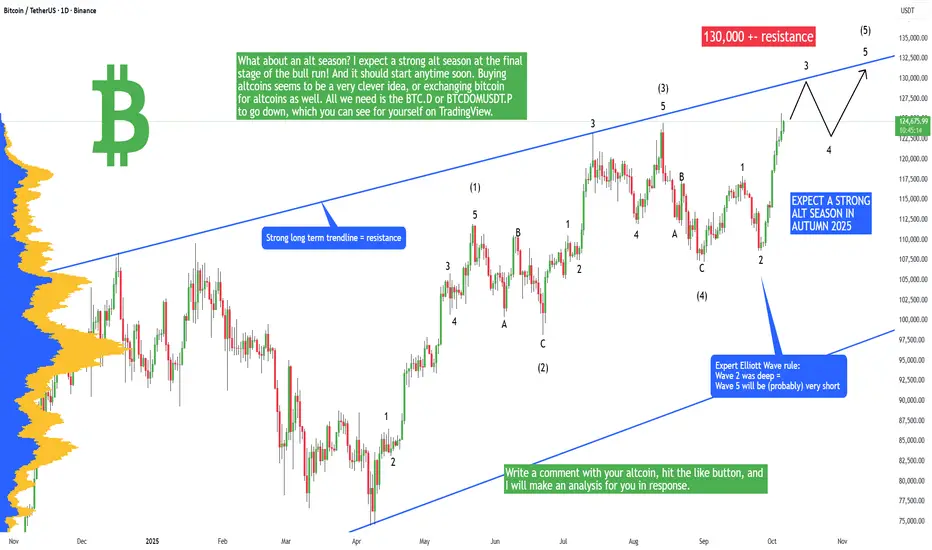
Bitcoin + ALT-SEASON 2025 Starting! (sell here, thank me later)Bitcoin has been pumping heavily in past days! And this trend will likely continue the whole month of October. We have a very likely scenario that will probably happen on Bitcoin, and in this analysis I will tell you which one!
The Elliott Wave theory is one of the strongest tools that you can use
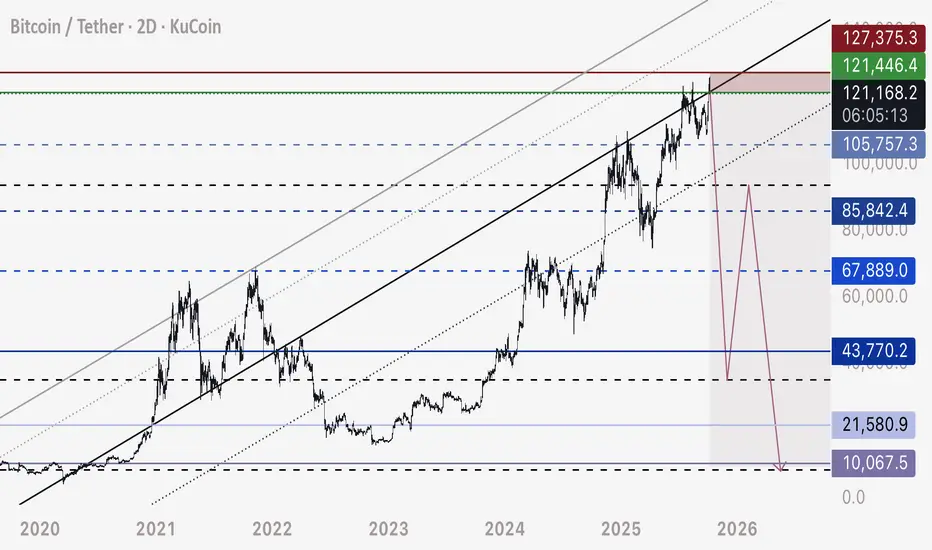
Is Bitcoin's 4-Year Cycle Over? Bitcoin’s 4-year cycle has been a go-to for traders, driven by halving events that spark price surges, sharp corrections, and recovery periods. But something’s off this time.
We’re 18 months into the post-2024 halving rally—hitting the historical peak for bull runs—yet there’s no sign of a crash,
Bitcoin Sets Another ATH as Traders Bet on $140,000 by Year EndBlink and you’ll miss it. Bitcoin’s recent leg up caught lots of traders unprepared. After sinking below $110,000 few weeks back, the OG coin slingshotted to a fresh record high above $126,000 this week. Not a bad way to start October Uptober .
Now, traders are adding to bets that the price will
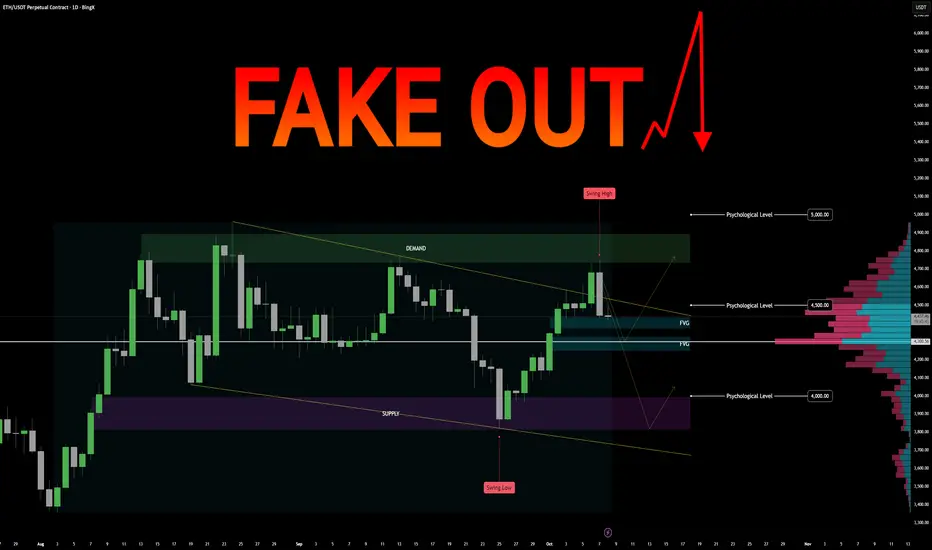
$ETH Market Assessment Incoming FAKEOUT? ETH/USD Perpetual – Market Assessment
Key Zones
Demand: 4737 – 4895
Supply: 3818 – 3994
Fair Value Gaps (FVGs): 4433, 4326
Anchored Volume Node: 4300 (significant liquidity cluster)
Psychological Levels : 4000, 4500, 5000
Recent Swing Points: High 4753, Low 3821
Techni
BITCOIN ENDING DIAGONAL: $160K OR $120K? (1HR CRITICAL UPDATE)While I typically avoid short-term CRYPTOCAP:BTC analysis, this 1hr setup is too critical to ignore. Price is painting a textbook Elliott Wave pattern that could deliver a explosive move.
CURRENT STRUCTURE:
• Waves 1 & 2 ✅ COMPLETE
• Wave 3 (extended) now forming an ENDING DIAGONAL
• Current tr

Bitcoin (BTC/USD) – Short SetupHi guys!
let's dive into btc:
BTC has recently broken down from its ascending channel, signaling a potential shift in short-term momentum. After the breakout, the price could go toward the previous structure zone around $122,000–$123,500, which now acts as a potential supply area.
There are two p

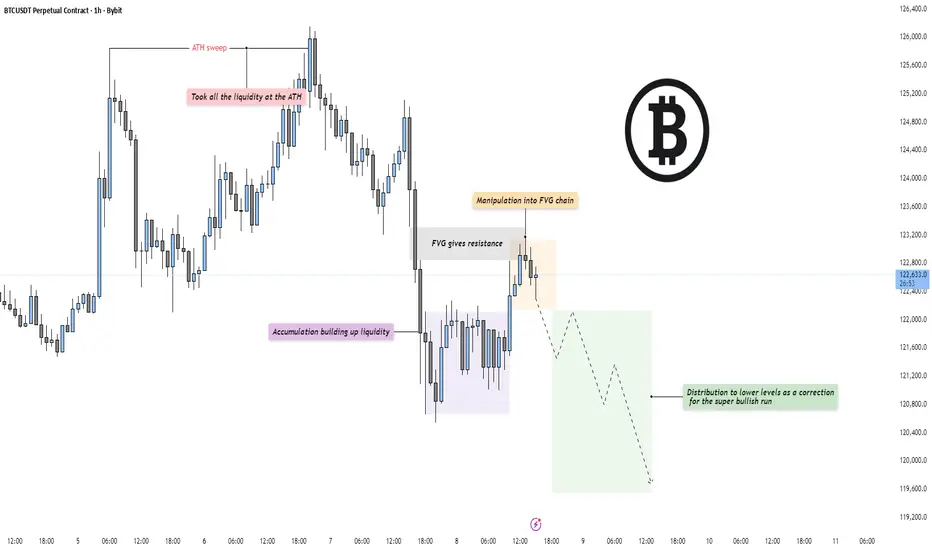
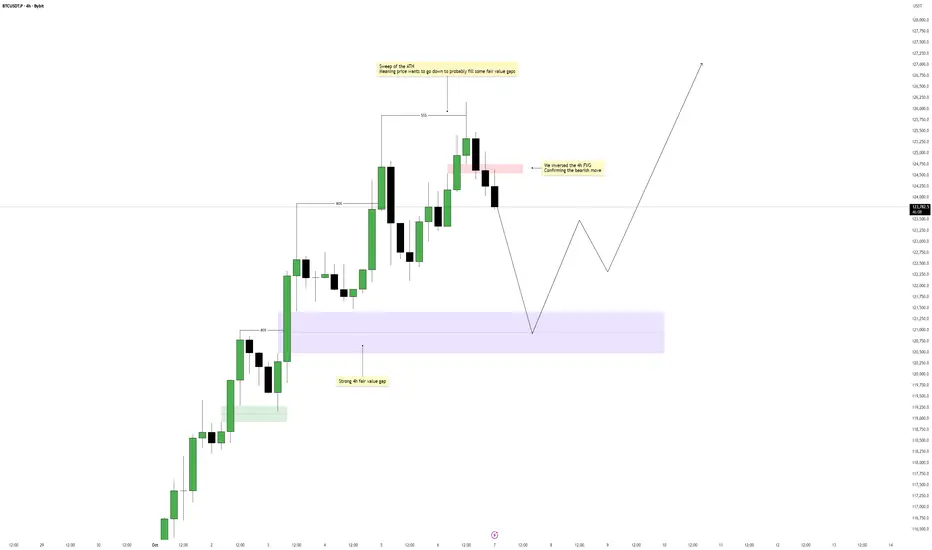
BTC - Distribution after ATH sweepMarket Context
Bitcoin has completed a clear liquidity sweep at the all-time high (ATH) and is now transitioning into a corrective phase. After taking all the liquidity above the prior high, price aggressively rejected and shifted structure to the downside, signaling that smart money may now be eng
Bitcoin – Short-Term Weakness, Long-Term StrengthBitcoin has recently swept the all-time high, triggering a short-term reaction from liquidity resting above that level. This move often signals that the market has completed its buy-side run and is now seeking to rebalance inefficiencies created during the aggressive push upward. The current structu
BTC - Trade Setup Today for my Flash Crash Plan Branching off my previous two posts today, which are linked below and give an in depth analysis and theory behind this idea and plan, here are the details of my short trade on Bitcoin.
Entry - 121,400 to 121,700
Stop Loss - Keep it Tight at 127,400 in case Bitcoin moves up to 126,800 to form the h
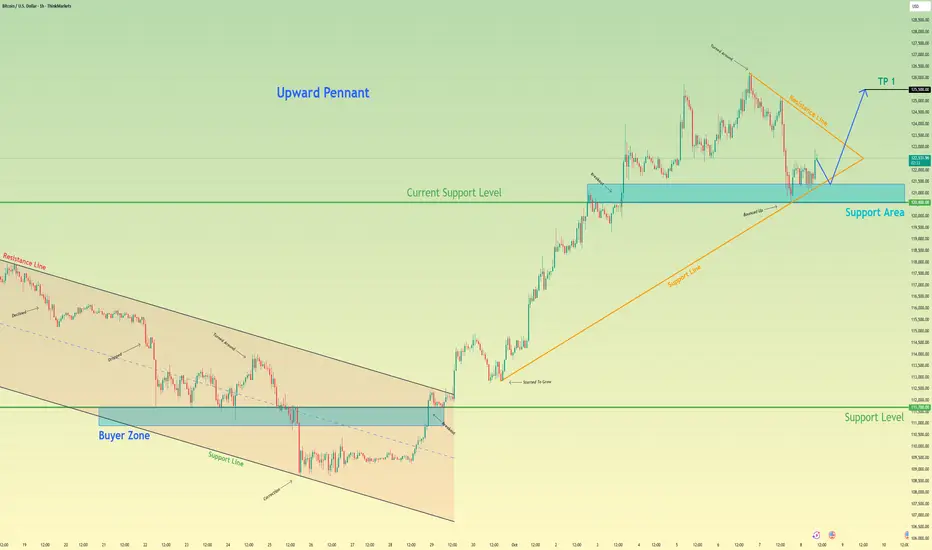
Bitcoin will Bounce From Pennant Support and Rally HigherHello traders, I want share with you my opinion about Bitcoin. The market structure for Bitcoin has recently undergone a major transition from bearish to bullish, following a decisive reversal from the 111700 support level. This shift triggered a breakout from the previous descending channel and gav
See all crypto ideas
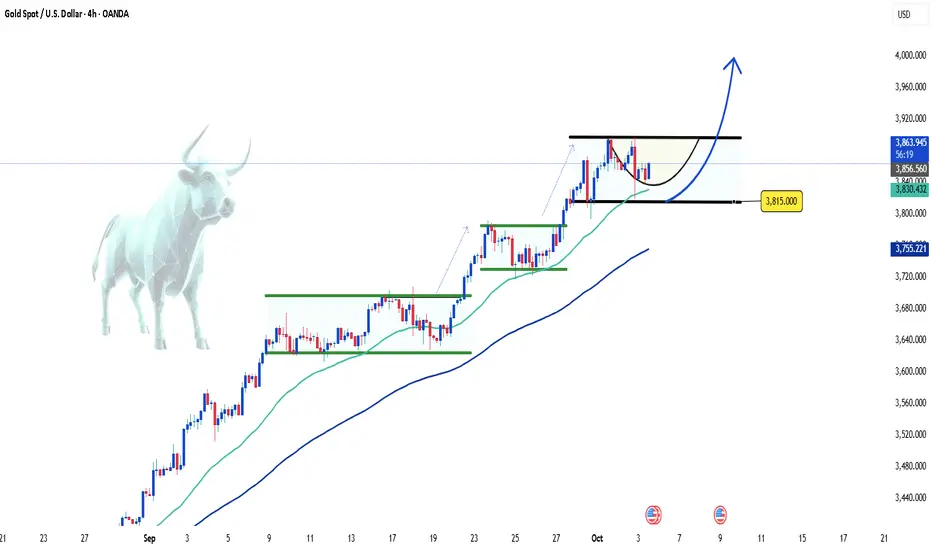
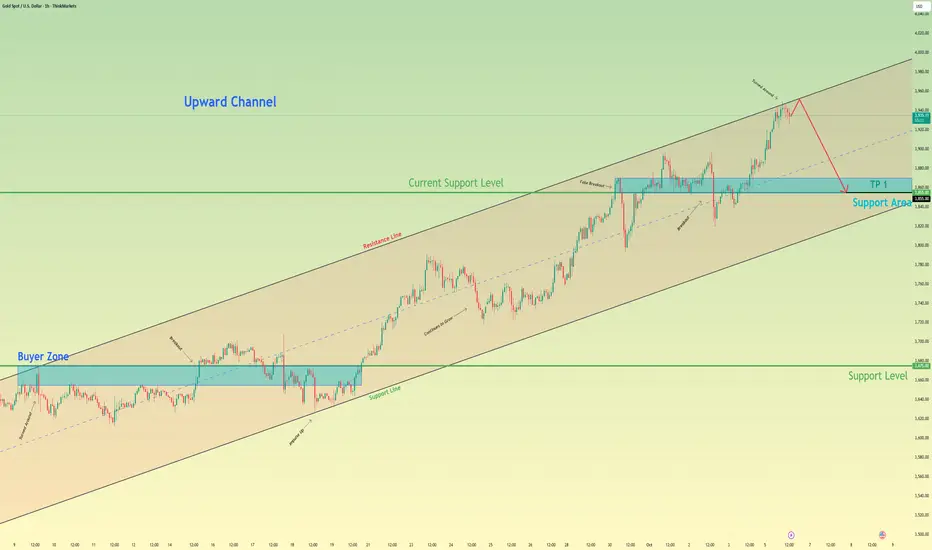
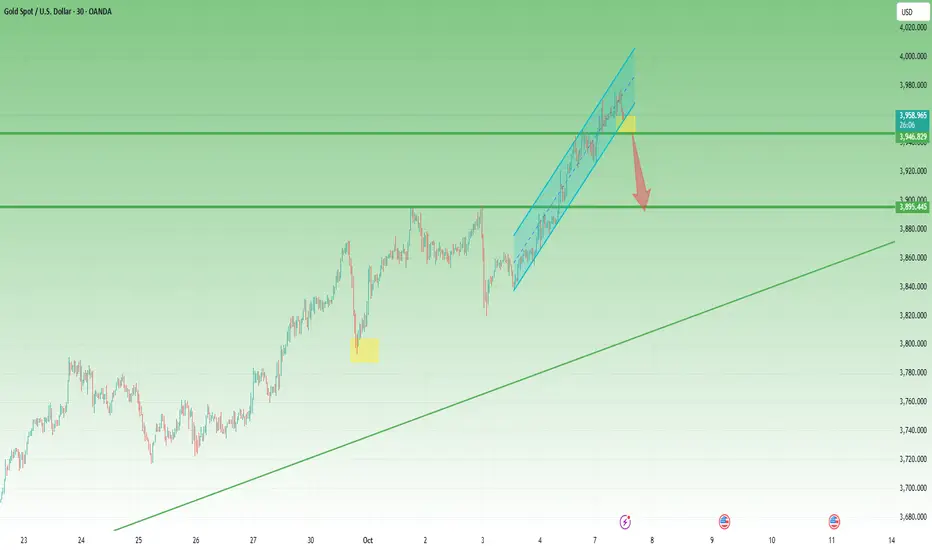
Gold can Start a Correction Towards 3855 SupportHello traders, I want share with you my opinion about Gold. The broader market context for Gold has been decidedly bullish since the price reversed and broke out from a prior descending channel. This structural shift established a new uptrend, which has since been neatly contained within a well-defi
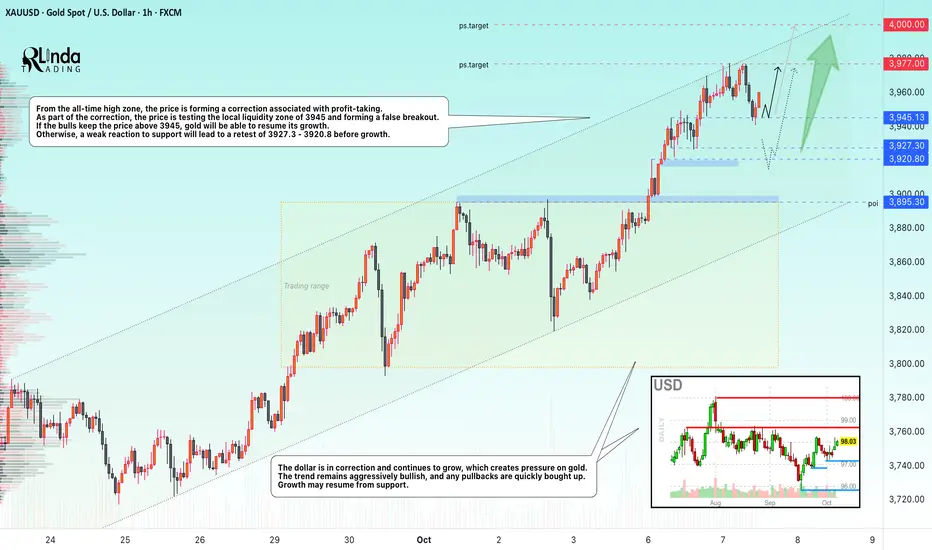
GOLD → The correction will trigger growth to $4,000.FX:XAUUSD hit a new record high of nearly $3,977 and entered a correction phase to build up potential before further growth. Despite the local strengthening of the dollar, the upward trend continues thanks to a combination of macroeconomic and geopolitical factors.
Key supporting factors: Ongo
Lingrid | GOLD Psychological Barrier Cleared Upside IntactThe price perfectly fulfilled my previous idea . OANDA:XAUUSD continues its climb inside the upward channel, holding above the key 4,000 support after a clean rebound. Price action shows consistent higher lows supported by the upward trendline, signaling sustained bullish momentum. As long as the

Gold: Looks Like a Train Without BrakesGold: Looks Like a Train Without Brakes
During the Tokyo and Sydney trading sessions, Gold hit a record high of 3977.5. After that, the price corrected by almost 1% to 3941.
The strong bullish momentum is keeping gold under strong pressure and the accumulation seems small, showing signs of a stro
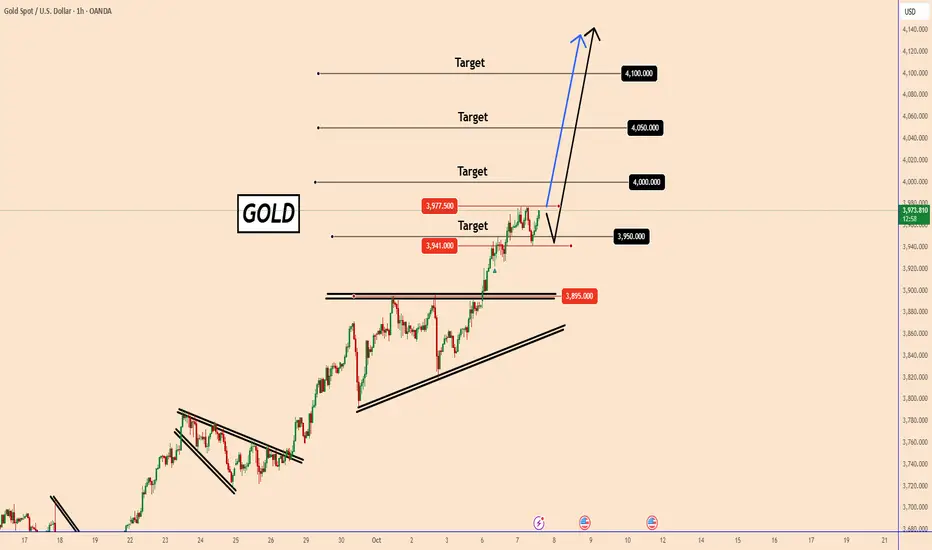
XAUUSD - Target $4,000 in Sight ⭐️Hello everyone, what do you think about the trend of OANDA:XAUUSD ?
XAUUSD has continued its strong upward momentum since the start of the week, breaking past the $3,950 level and approaching the psychological barrier of $4,000. Demand for gold has surged amid concerns about a potential U.S. go

XAU/USD | Gold Nears $4000 as Goldman Sachs Target $4900 by 2026By analyzing the Gold (XAUUSD) chart on the 1-hour timeframe, we can see that the price continued its strong bullish momentum today and reached $3985.66, marking a new all-time high (ATH)! Gold is now just a step away from the $4000 milestone.
Interestingly, Goldman Sachs has raised its gold price f
Gold: The Higher It Flies, the Louder the Correction WhispersAs explained in my Sunday video, the new all-time high for Gold is not a question of if, but how high it can rise once it firmly breaks above 3900.
Indeed, Gold has continued its unstoppable march, printing ATH after ATH, with the latest one formed during today's Asian session at 3977 — another a
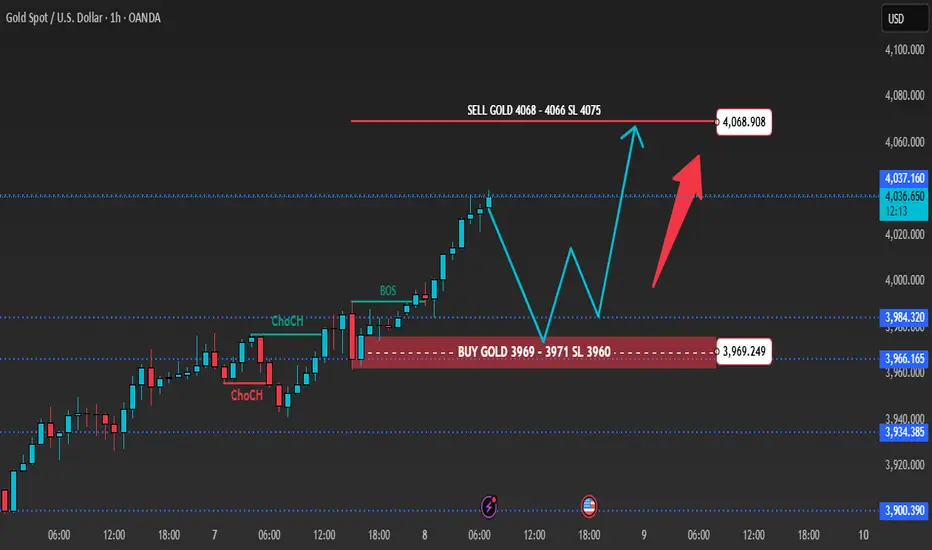
Gold 1H – Bulls Seek Re-Entry Before Fed Minutes💎 XAUUSD – Intraday Trading Plan | Ryan_TitanTrader
📈 Market Context
Gold extends its advance above $4,030 as traders position ahead of this week’s FOMC minutes and key U.S. inflation expectations data. The metal remains supported by persistent geopolitical risk and renewed central-bank demand, whil
Gold: Uptrend Momentum Remains StrongHello everyone, gold continues to show impressive strength as prices hold around 3,958 USD/oz after decisively breaking above the 3,940 mark. This confirms that the uptrend remains in control, even if short-term pullbacks may occur to rebalance the market before further advances.
From a macro pers

XAU/USD Bullish Setup Toward 4115XAU/USD is trading around 4038, holding bullish momentum with support near 4032. Price targets are set at 4060 and 4087, with potential to reach a new ATH at 4115 if buyers maintain strength.

See all futures ideas
NZDUSD Eyes 0.5730 Rebound as Dollar Weakens Near DXY ResistanceHey Traders,
In today's trading session, we are monitoring NZDUSD for a buying opportunity around the 0.57300 zone. The pair has been moving within a descending channel and is now approaching the lower boundary, suggesting potential for a technical rebound from channel support.
From a macro perspec

USDCAD remains bullish, showing signs of strengtheningUSDCAD remains bullish, showing signs of strengthening. After a successful breakout, the pair has completed a minor correction phase, and price accumulation in the current zone suggests potential for further upside movement.
Although the U.S. dollar remains relatively weak in the broader context, t

AUDUSDHello Traders! 👋
What are your thoughts on AUDUSD?
The pair has broken its ascending trendline and completed a pullback to the broken level.
It is now trading below a key resistance zone, showing signs of bearish pressure.
After some consolidation in this area, the price is expected to continue de

GBP/NZD: Pullback Trade from ResistanceThe 📉GBPNZD pair is likely to experience a retracement from the identified daily horizontal resistance level.
The formation of a double top pattern and a bearish imbalance candle on the hourly timeframe further validates this assessment.
Target price: 2.3247.

NZD/USD (Daily timeframe)..NZD/USD (Daily timeframe).
Price is around 0.5750 after breaking down below the key support zone near 0.5800. The Ichimoku cloud is also showing bearish pressure.
Bearish Targets:
1. First Target Zone → 0.5600 – 0.5580
(next major support area, already marked on my chart).
2. Extended Target Zo

EURUSD: Neutral-Bearish! Wait For A -BOS, Then Sell It!Welcome back to the Weekly Forex Forecast for the week of Oct 6 - 10th.
In this video, we will analyze the following FX market: EURUSD
The EURUSD is in consolidation. The government shut down in the US might have something to do with it. Wait for the market to tip its hand! A break of market

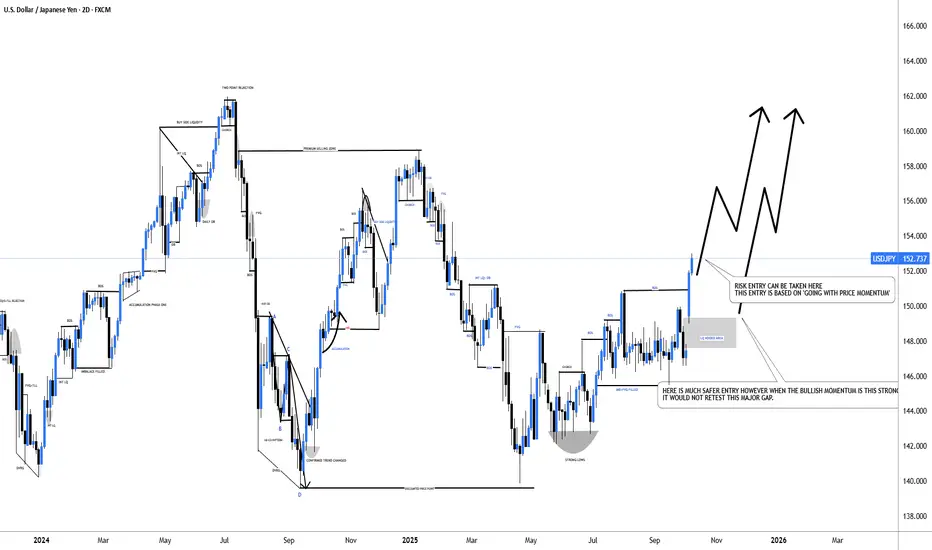
#USDJPY: From +1100 Pips To +1350 Pips A Possible Swing BuyDear Traders,
I hope you’re all having a great trading week!
The USDJPY is currently trading in a 152 price range and is experiencing extreme bullish momentum. The price is rallying without making any corrections, primarily due to the collapse of the Yen. We may see it fall further below. Given th
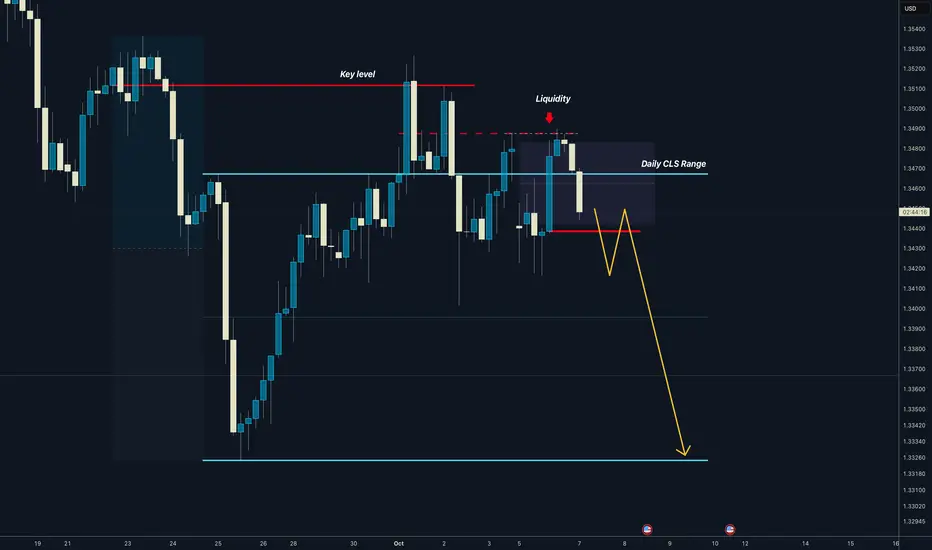
GBPUSD Daily CLS Range, Key Level OB, Distribution PhaseHi friends, new range created. As always we are looking for the manipulation in to the key level around the range. Don't forget confirmation switch from manipulation phase to the distribution phase to make the setup valid. Stay patient and enter only after change in order flow. If price reaches 50%
USDCHF: Strong Uptrend ? 👋Hello everyone, what are your thoughts on OANDA:USDCHF ?
Today, USDCHF continues to show strong upward momentum after forming a clear head and shoulders pattern. Recently, the price has shown signs of breaking out of a consolidation phase, and the bullish trend may continue. With the US Dollar r

EUR/USD Intraday Analysis – October 8, 2025The EUR/USD pair is showing a clear downtrend on the H1 timeframe. Price action has broken key support levels, forming a new lower low, and is currently approaching a potential demand zone. Observing the chart:
Trend: Bearish momentum dominates after a consolidation range between 1.1720–1.1765 was b

See all forex ideas
| - | - | - | - | - | - | - | ||
| - | - | - | - | - | - | - | ||
| - | - | - | - | - | - | - | ||
| - | - | - | - | - | - | - | ||
| - | - | - | - | - | - | - | ||
| - | - | - | - | - | - | - | ||
| - | - | - | - | - | - | - | ||
| - | - | - | - | - | - | - |
Trade directly on the supercharts through our supported, fully-verified and user-reviewed brokers.


