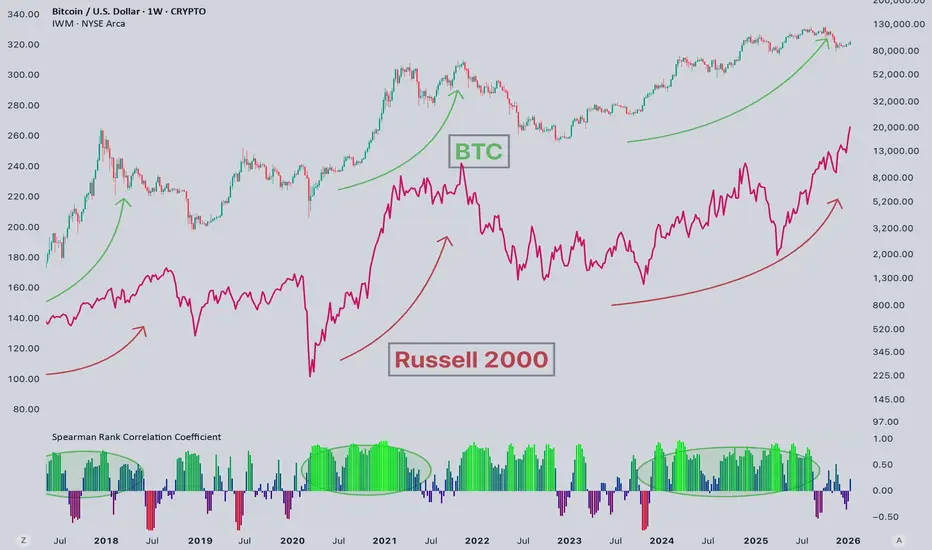
Why is Russell rising? And BTC not?#Russell2000 vs #Bitcoin, A Growing Divergence 📊
Over the last three months, the Russell 2000 has continued to grind higher, while Bitcoin has been moving lower. This divergence naturally raises the question: what’s driving such clear decoupling?
📝 Previously, I shared data showing Bitcoin divergi

The best trades require research, then commitment.
Get started for free$0 forever, no credit card needed

Scott "Kidd" PoteetPolaris Dawn astronaut

Where the world does markets
Join 100 million traders and investors taking the future into their own hands.
GBP/JPY Made A Reversal Pattern , Short Setup To Get 100 Pips !Here is my 1H Chart On GBP/JPY , And finally the chart made a reversal pattern The price creating a very clear reversal pattern ( double top) and the price made a very good bearish price action now from good res area But until now we have not a clear closure below our neckline to confirm the pattern
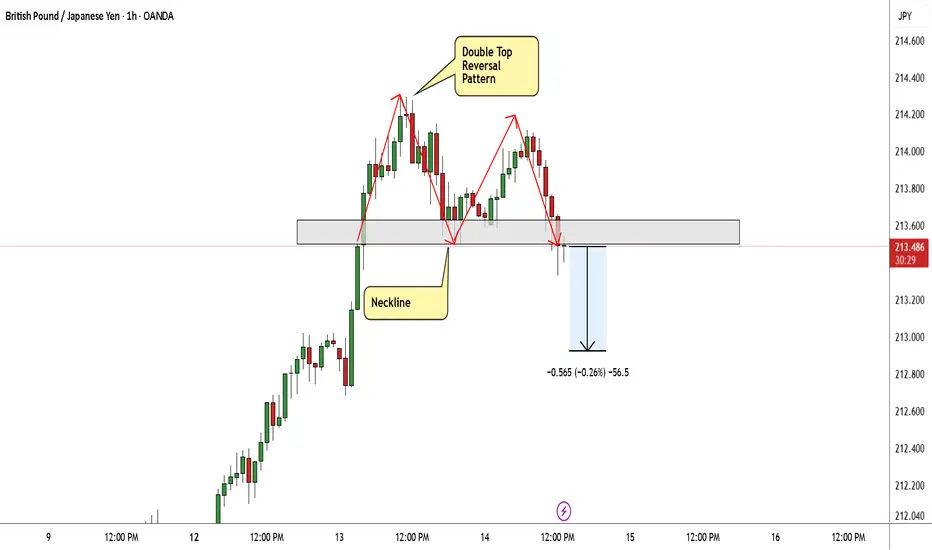
Bullish continuation?GBP/JPY could make a short-term pullback to the support level, which is a pullback support, and could bounce from this level to our take profit.
Entry: 211.43
Why we like it:
There is a pullback support level.
Stop loss: 210.35
Why we like it:
There is a pullback support level.
Take profit: 214.6

Silver Prices Stabilise Near Record HighsSilver Prices Stabilise Near Record Highs
As the XAG/USD chart shows, the price of silver per ounce is consolidating near its all-time high, which lies above $85.
Bullish sentiment dominates the market, as concerns over the independence of the US Federal Reserve, heightened geopolitical tensions,

Litecoin: The Next PumpAfter years of posting my Monero KRAKEN:XMRUSD thesis based on its privacy use case it has finally catapulted into new All Time Highs and entered "price discovery."
So I now look to what is next... focusing on
PATTERN RECOGNITION
FUNDAMENTALS: PRIVACY
THE TRADE
Pattern Recognition
A

When Will Tesla’s Pilot Take Off?Hello Traders 👋
Hope you all are doing well and trading with discipline. Let’s analyze Tesla from a pure technical perspective and see where the next major move could unfold.
Tesla is trading inside a well-defined rising channel, respecting both the rising support and the rising resistance, which c

Post-Rally Consolidation, Awaiting CatalystHello everyone,
Bitcoin is no longer in an expansion phase of the uptrend, but has shifted into a consolidation phase following the recent rally.
From a structural perspective, the medium-term uptrend remains intact. Bitcoin continues to print higher highs and higher lows, with price holding ab

Bitcoin - Holding The Middle, Eyes On The EdgeBitcoin continues to trade within a clearly defined range, with price currently positioned in the upper half of that structure. After a strong move away from the lower boundary, the market has shown acceptance above the midpoint, suggesting buyers are still active but now approaching an area where r

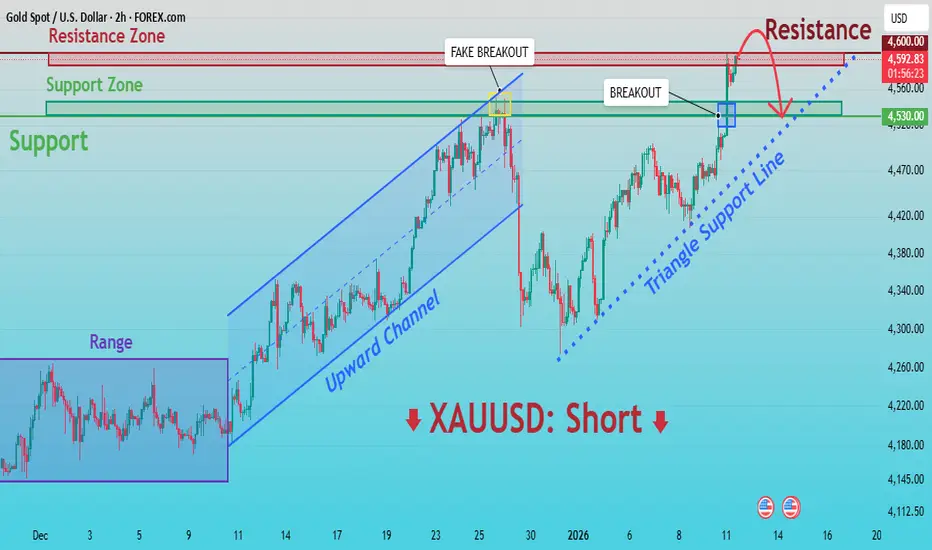
XAUUSD: Critical Supply Zone - Reaction May Define Next MoveHello everyone, here is my breakdown of the current XAUUSD setup.
Market Analysis
Gold is trading within a broader bullish environment, but recent price action shows signs of exhaustion near key resistance. After a period of consolidation inside a clear range, XAUUSD broke to the upside and forme
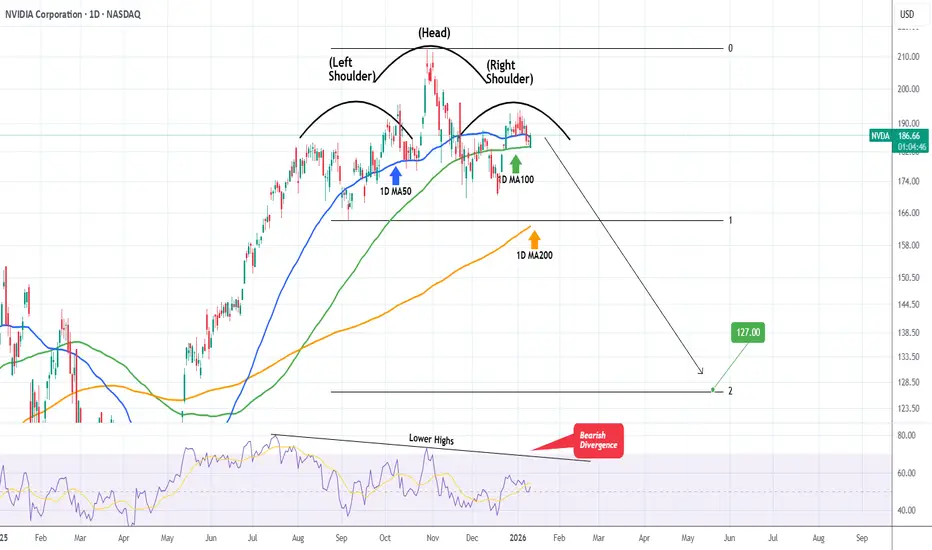
NVIDIA Huge Head & Shoulders forming. $127 technical Target.NVIDIA Corporation (NVDA) is in the process of completing the Right Shoulder of a Head and Shoulders (H&S) pattern, having turned sideways since the October 29 2025 High (ATH).
With the 1D RSI on Lower Highs, i.e. a Bearish Divergence since July 17 2025, it is possible that within a month's time ma
See all editors' picks ideas
DeeptestDeeptest: Quantitative Backtesting Library for Pine Script
━━━━━━━━━━━━━━━━━━━━━━━━━━━━━━━━━━
█ OVERVIEW
Deeptest is a Pine Script library that provides quantitative analysis tools for strategy backtesting. It calculates over 100 statistical metrics including risk-adjusted return ratios (Sharpe

Arbitrage Detector [LuxAlgo]The Arbitrage Detector unveils hidden spreads in the crypto and forex markets. It compares the same asset on the main crypto exchanges and forex brokers and displays both prices and volumes on a dashboard, as well as the maximum spread detected on a histogram divided by four user-selected percenti

Multi-Distribution Volume Profile (Zeiierman)█ Overview
Multi-Distribution Volume Profile (Zeiierman) is a flexible, structure-first volume profile tool that lets you reshape how volume is distributed across price, from classic uniform profiles to advanced statistical curves like Gaussian, Lognormal, Student-t, and more.
Instead of forcin

Multi-Ticker Anchored CandlesMulti-Ticker Anchored Candles (MTAC) is a simple tool for overlaying up to 3 tickers onto the same chart. This is achieved by interpreting each symbol's OHLC data as percentages, then plotting their candle points relative to the main chart's open. This allows for a simple comparison of tickers to tr

Vdubus Divergence Wave Pattern Generator V1The Vdubus Divergence Wave Theory
10 years in the making & now finally thanks to AI I have attempted to put my Trading strategy & logic into a visual representation of how I analyse and project market using Core price action & MacD. Enjoy :)
A Proprietary Structural & Momentum Confluence System

Per Bak Self-Organized CriticalityTL;DR: This indicator measures market fragility. It measures the system's vulnerability to cascade failures and phase transitions. I've added four independent stress vectors: tail risk, volatility regime, credit stress, and positioning extremes. This allows us to quantify how susceptible markets are

Volatility Risk PremiumTHE INSURANCE PREMIUM OF THE STOCK MARKET
Every day, millions of investors face a fundamental question that has puzzled economists for decades: how much should protection against market crashes cost? The answer lies in a phenomenon called the Volatility Risk Premium, and understanding it may fundam

Volume Gaps & Imbalances (Zeiierman)█ Overview
Volume Gaps & Imbalances (Zeiierman) is an advanced market-structure and order-flow visualizer that maps where the market traded, where it did not, and how buyer-vs-seller pressure accumulated across the entire price range.
The core of the indicator is a price-by-price volume prof

Match Finder [theUltimator5]Match Finder is the dating app of indicators. It takes your current ticker and finds the most compatible match over a recent time period. The match may not be Mr. right, but it is Mr. right now. It doesn't forecast future connection, but it tells you current compatibility for today.
Jokes aside,

Trend Line Methods (TLM)Trend Line Methods (TLM)
Overview
Trend Line Methods (TLM) is a visual study designed to help traders explore trend structure using two complementary, auto-drawn trend channels. The script focuses on how price interacts with rising or falling boundaries over time. It does not generate trade sign

See all indicators and strategies
Community trends
Similar events for GNPXBased on 4 similar events, I expect a drop to one of 2 levels and one of 3 outcomes: bounce, double top or breakout top, where all 3 options gave great short term LONG opportunities.

Nike accumulation? I'm looking at Nike for a while now and it's a really interesting chart, we have been in a downtrend since 2021 and the stock has lost quite a lot of value due to inflation, tariffs and rising competition. Nike's leadership has changed and a new CEO has been leading the company for a year now. Also

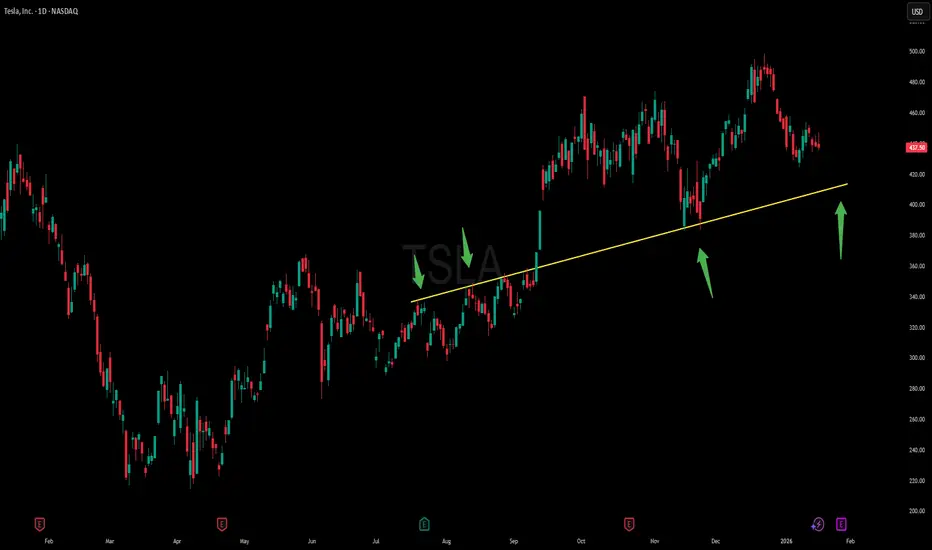
TESLA TRADE IDEA $TSLANASDAQ:TSLA Over the last 365 days, Tesla has consistently respected this trendline, providing several high-quality trading opportunities. Each time price has approached this level, we’ve seen strong reactions, making it a technically significant area to watch. From a chart perspective, this trendl
$NVDA — H200 suppliers have paused production due to Chinese cusNASDAQ:NVDA — added to my short yesterday in after-hours on the news that H200 suppliers have paused production due to Chinese customs blocking shipments.
Worth noting: in December, NVDA rallied ~$20 on similar headlines. That kind of reaction late in a trend often signals exhaustion, not strength

AMD OutlookHere it goes.
Yes, some of yall might see this and say "uh yeah crazy analysis, you just drawn up all the possible scenarios" since all the market can do is go up, down or consolidate.
Well, no.
This is about expected behaviour and bias.
As long as we are inside the top box, following the yel

Breaking: Venus Concept Inc. (VERO) Tanked 29% Albeit surging over 450%, Venus Concept Inc. (NASDAQ: NASDAQ:VERO ) tanked 29% in Fridays extending trading session. The dip brought the shares RSI to oversold region of 31.
In recent news, Madryn Asset Management disclosed a 91% stake in the medical aesthetic technology company.
In an SEC filin

Pressure cookerI’m continuing with the BIOTECH theme, which could soon match the space economy in terms of bullish strength.
Some information about the company:
10x Genomics is appealing because it holds a leading position in technologies that are redefining biomedical research, particularly those dedicated to si

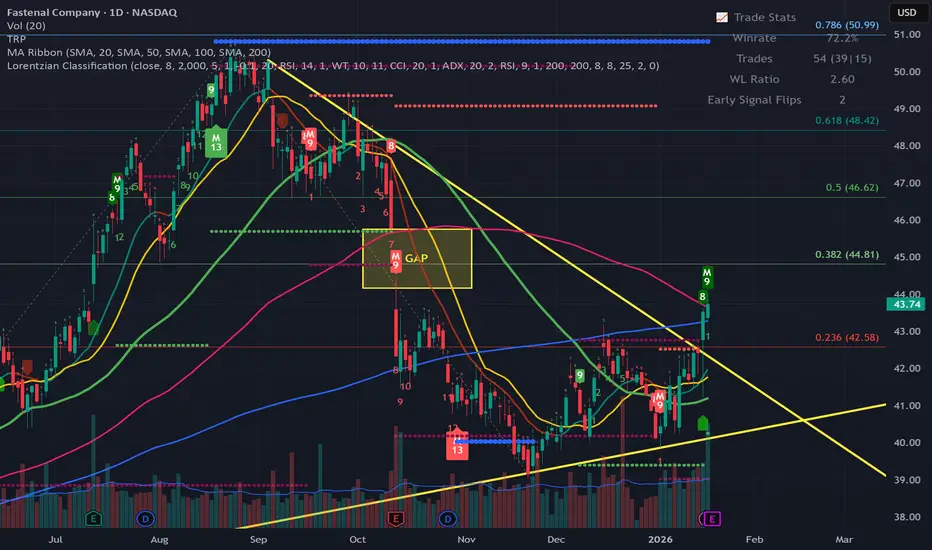
FAST — Breakout StructureHello Everyone, Followers,
FAST is the second one for today.
Let''s drill down:
📈 FAST is forming a clean breakout structure after a prolonged downtrend and base formation.
Price has broken above descending resistance and is now attempting to reclaim key moving averages.
🔹 Technical Overview
TSLA : path to 600$ levelThere are 2 thesis here.
Thesis 1:
if the Tesla make good earnings this season there is a chance it could go to 600$ level from current level if that breaks the weekly down trend line by end of Jan 2026.
Thesis 2:
if Tesla fails to show good earnings. there is a chance the current weekly down

BIDU Holds Strong After Rally :Consolidation Signals StrengthBaidu is currently pausing after a sharp upside expansion, with price action showing controlled consolidation rather than signs of exhaustion. Momentum has eased slightly as the market digests recent gains, suggesting a healthy rebalancing phase within the broader structure. This type of price behav

See all stocks ideas
Today
CZNCCitizens & Northern Corp
Actual
—
Estimate
0.59
USD
Today
CBSHCommerce Bancshares, Inc.
Actual
—
Estimate
0.99
USD
Today
BRIDBridgford Foods Corporation
Actual
—
Estimate
—
Today
MCBMetropolitan Bank Holding Corp.
Actual
—
Estimate
2.20
USD
Today
BANFBancFirst Corporation
Actual
—
Estimate
1.79
USD
Today
LFCRLifecore Biomedical, Inc.
Actual
—
Estimate
−0.14
USD
Today
SRCE1st Source Corporation
Actual
—
Estimate
1.61
USD
Today
FPHFive Point Holdings, LLC
Actual
—
Estimate
—
See more events
Community trends
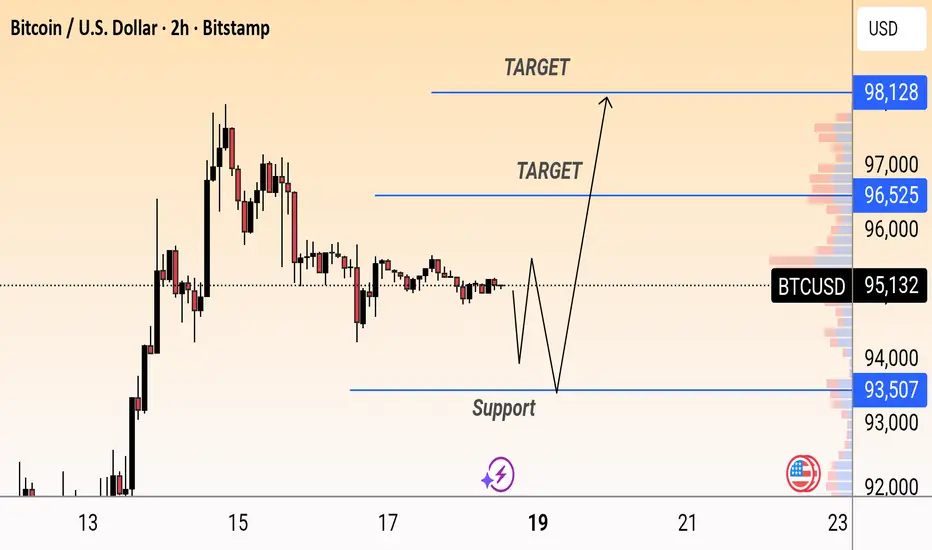
BTCUSDT Bullish BTCUSD is consolidating near 95,100 with strong support around 93,500. A bounce from this zone could trigger a move toward 96,500 and 98,100 targets.
BTCUSD Facing Supply Zone – Demand Area as Next SupportBitcoin is currently trading inside a range after breaking the ascending channel structure. The bullish momentum has weakened, and price is now respecting a descending supply line, showing sellers are in control.
A clear breakdown from the range confirms short-term bearish bias. Price is likely to

BTCUSD Facing Rejection at Seller Zone - Short Scenario in PlayHello traders! Here’s my technical outlook on BTCUSD (1H) based on the current chart structure. BTCUSD is currently trading within a broader corrective-to-bearish structure after failing to sustain bullish momentum near the recent highs. Earlier in the session, price moved inside an ascending channe

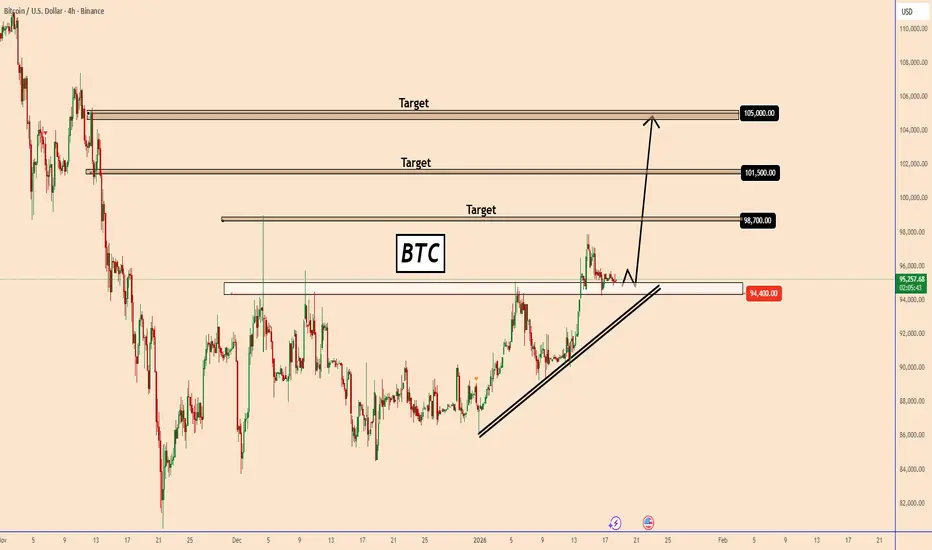
BTC: Breakout Confirmed – Bulls Defend 94,400 SupportBTC: Breakout Confirmed – Bulls Defend 94,400 Support
Four days ago BTC managed to break through a strong resistance area that has now turned into resistance.
The price has been holding above 94400 for several days after the breakout, showing strong bullish momentum.
As long as the price is ris
DASHUSDT | Don't FOMO buy now...Here is where you enterHello traders,
DASH has went ape mode the last couple of days reaching 70% in a single day peeking at $96.85. Buying here would not be very smart. Price is already overextended.
I can see that price has already formed a complete 5 impulsive waves and now is about to do an ABC correction.
My zone

BTC Macro Roadmap: The $110k Institutional Supply ZoneAnalysis: I am currently monitoring the $109k–$116k region as a primary Point of Interest (POI). This zone represents a high-confluence cluster:
Daily Order Block: A clear area of institutional distribution.
Price Imbalance: A Daily Fair Value Gap (FVG) that needs to be filled.
Volume POC: My Anc

Why is Russell rising? And BTC not?#Russell2000 vs #Bitcoin, A Growing Divergence 📊
Over the last three months, the Russell 2000 has continued to grind higher, while Bitcoin has been moving lower. This divergence naturally raises the question: what’s driving such clear decoupling?
📝 Previously, I shared data showing Bitcoin divergi
BNB Analysis: Bullish Wedge BreakoutHi
BNB has formed a classic wedge pattern following a strong impulsive move to the upside. After consolidating within this structure, price has now broken out above the upper trendline, signaling a continuation of bullish momentum.
Based on the measured move of the pattern, the first upside target

Bitcoin: This Level Offers Optimal Scenario For 100K Objective.Bitcoin is poised to break higher from the current price area BUT it is worth noting these other high probability support areas. The 92K to 93K offers the most attractive level because of the alignment of the trend line and a previous key support (order block). While a swing trade long opportunity m

BTC going 106,023Hello guys, according to me, BTC indicated buying in Daily time frame it is correcting righ now and once it closes the candle above it can go all the way uptown 107000

See all crypto ideas
GOLD 1H CHART ROUTE MAP UPDATE & TRADING PLAN FOR THE WEEKHey Everyone,
Please see our 1h chart levels and targets for the coming week.
We are seeing price play between two weighted levels with a gap above at 4598 and a gap below at 4539, as support. We will need to see ema5 cross and lock on either weighted level to determine the next range.
We will se

GOLD - A long squeeze of support could trigger growthFX:XAUUSD continues to consolidate, Friday's long squeeze (false breakdown) of support provides an opportunity for growth amid geopolitical issues...
The dollar is strengthening against the backdrop of Thursday's economic data and Trump's geopolitical actions, but against this backdrop, gold i

Elise | XAUUSD · 30M – Demand Reaction With Upside TargetsOANDA:XAUUSD
After multiple failed attempts to break below support, XAUUSD formed a sharp bullish reaction from demand, indicating absorption of sell-side liquidity. Current price action suggests a corrective move higher toward prior resistance and imbalance zones within the range.
Key Scenarios

Gold Price Respects Ascending Trend Line - Next Target 4,680Hello traders! Here’s my technical outlook on XAUUSD (4H) based on the current chart structure shown in the screenshot. XAUUSD is trading within a broader bullish structure, supported by a well-defined ascending trend line that has guided price action since the market formed a solid base and started

Gold Weekly Levels: Break above 4630 → 4720/4725🔱 GOLD WEEKLY SNAPSHOT — EXECUTIVE SUMMARY (NEW WEEK | JAN 2026)
✨ Bullish bias stays active for the week — but the upside is capped
🧲 Fresh overhead sell-side liquidity: 4630–4635 = first magnet
🟣 Max overbought + January ceiling: 4720–4725
📌 Expectation: limited upside from Point C in January

GOLD (XAUUSD) – SELL SETUP (15M)🔻 Sell Zone: 4610 – 4612
🛑 Stop Loss: 4626
🎯 Take Profit Levels:
✅ TP1: 4595
✅ TP2: 4580
✅ TP3: 4565
✅ TP4: 4550
📉 15-Minute Confirmation:
Rejection from resistance zone
Bearish candle close on 15M
Liquidity sweep / lower high formed
📌 Trade Management:
After TP1 → move SL to breakeven
Partial profi

Gold Bullish setup XAUUSD is holding above the support zone near 4569–4536. A bullish bounce is expected, with upside targets around 4620 and 4656 if price continues to respect this support.

Gold (XAUUSD) Bullish Breakout SetupGold is trading above a rising trendline, indicating sustained bullish structure.
Price is consolidating within a strong buying zone, and a confirmed breakout above 4623 may trigger further upside.
Key resistance levels are 4640, followed by the final target at 4659.
Bias remains bullish as long as

Gold prices hold above 4600; next week's market trend.
news:
Amidst the volatile global financial markets, gold's appeal as a traditional safe-haven asset is facing a severe test.
On Friday (January 16th) during the Asian session, spot gold weakened, briefly falling below the $4600 mark to $4591.32 per ounce, and is currently trading around $4597.

XAUUSD Short: Rejection from Major Supply, Eyes On $4,520 DemandHello traders! Here’s a clear technical breakdown of XAUUSD (4H) based on the chart structure shown in the screenshot. XAUUSD previously traded within a consolidation range, where price moved sideways after a corrective phase, reflecting temporary balance between buyers and sellers. This range acted

See all futures ideas
GBPJPY at Risk? Sell Zone Near 212.000 as BoJ Intervention LoomsHey Traders,
In tomorrow’s trading session, we are closely monitoring GBPJPY for a potential selling opportunity around the 212.000 zone. GBPJPY remains in a well-defined downtrend and is currently undergoing a corrective pullback, approaching a key trendline confluence and the 212.000 support-turn

EURUSD: Bullish Setup After Corrective Channel PullbackHello everyone, here is my breakdown of the current EURUSD setup.
Market Analysis
EURUSD is trading within a broader bullish structure, supported by a rising trend line that has guided price action from the recent swing lows. Earlier in the move, price formed a clear accumulation range, where the

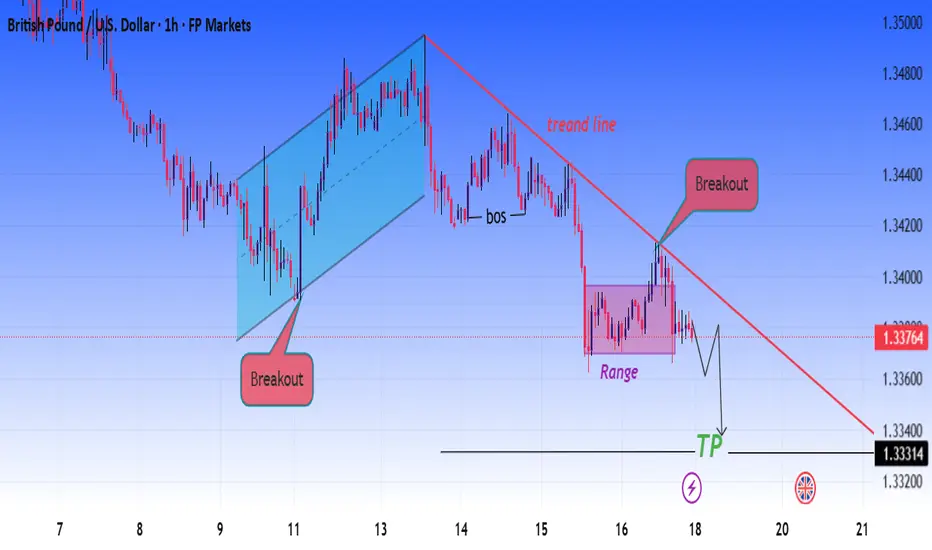
GBPUSD Breakdown from Trendline – Bearish Continuation SetupGBPUSD is respecting a clear descending trendline, and price has just given a strong breakout + retest confirmation. After the break of structure (BOS), price consolidated in a small range and failed to reclaim the trendline, indicating sellers are still in control.
This setup suggests a bearish co
EURUSD Short: Supply Holds, Bears in Control, Move To 1.1550Hello traders! Here’s a clear technical breakdown of EURUSD (3H) based on the current chart structure. EURUSD initially traded within a consolidation range, where price moved sideways after a prior decline, indicating temporary equilibrium between buyers and sellers. This range acted as a base for t

AUD/USD: Bull Trap Incoming?AUD/USD is showing clear signs of a slowdown in the bullish trend after December’s impulse, with price now consolidating below a key supply area and within a structure that is starting to lose momentum. On the daily chart, the market delivered a clean directional move, but the current phase is typic

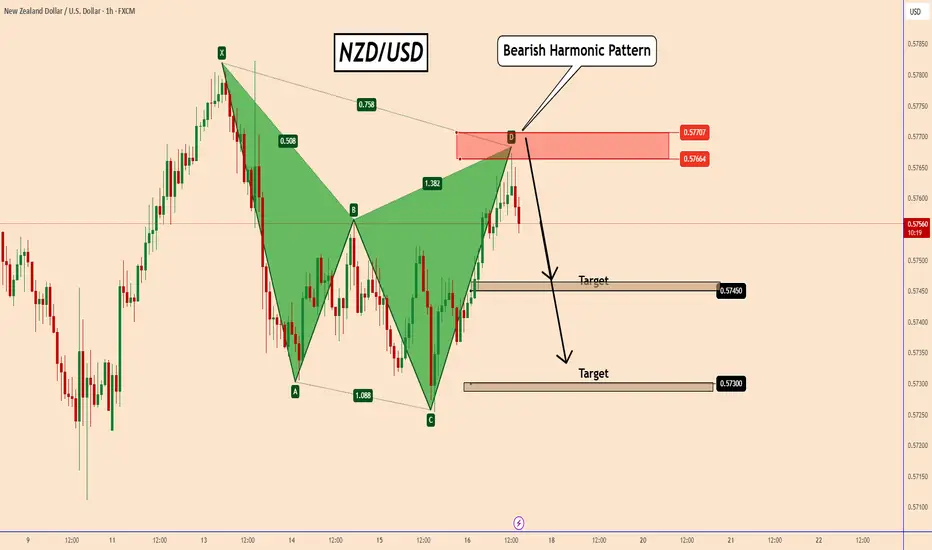
NZDUSD: Bearish Harmonic Pattern[NZDUSD: Bearish Harmonic Pattern
NZDUSD completed a bearish harmonic pattern on the 60-minute chart.
It is a bit risky as it has not been trending for a long time, but it is very likely that the overall improvement in strength in USD pairs will push NZDUSD down again.
Most likely, the top of the
EURUSD Bearish Continuation From Channel StructureQuick Summary
EURUSD is expected to continue its bearish trend after A clear descending price channel has formed which supports further downside, Before continue lower price may sweep liquidity at 1.16271
After that a rejection from the orderblock at 1.16303 could offer a sell opportunity.
Full An

USD/JPY 2 Day Chart AnalysisAll the JPY pairs have seen bullish runs with YEN weakness throughout the market.
But with USD/JPY at 159.00 now, will we see that momentum stall or even reverse?
This zone acted as a ceiling in the market a year ago.
Is this still where the market deems JPY value for money?

GBPUSD SHORT TRADE POSSIBLE ACCORDING TO MY ANALYSISGBPUSD can fall from my zone this is for education only not a buy sell advice if you take just take with proper risk managment

USDJPY BULLISHTechnically:
USDJPY bullish on daily
USDJPY retrace at resistance become support
USDJPY printed no bearish divergence

See all forex ideas
| - | - | - | - | - | - | - | ||
| - | - | - | - | - | - | - | ||
| - | - | - | - | - | - | - | ||
| - | - | - | - | - | - | - | ||
| - | - | - | - | - | - | - | ||
| - | - | - | - | - | - | - | ||
| - | - | - | - | - | - | - | ||
| - | - | - | - | - | - | - |
Trade directly on Supercharts through our supported, fully-verified, and user-reviewed brokers.


