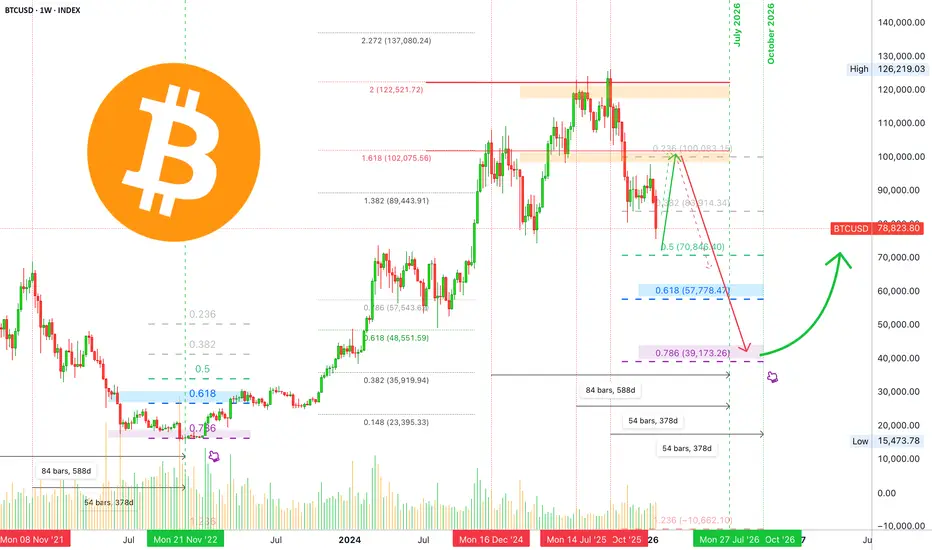
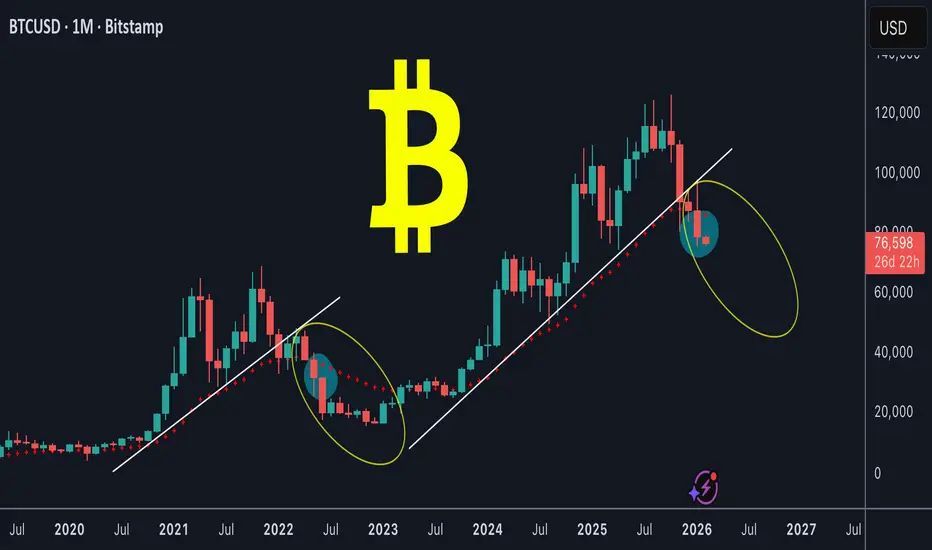
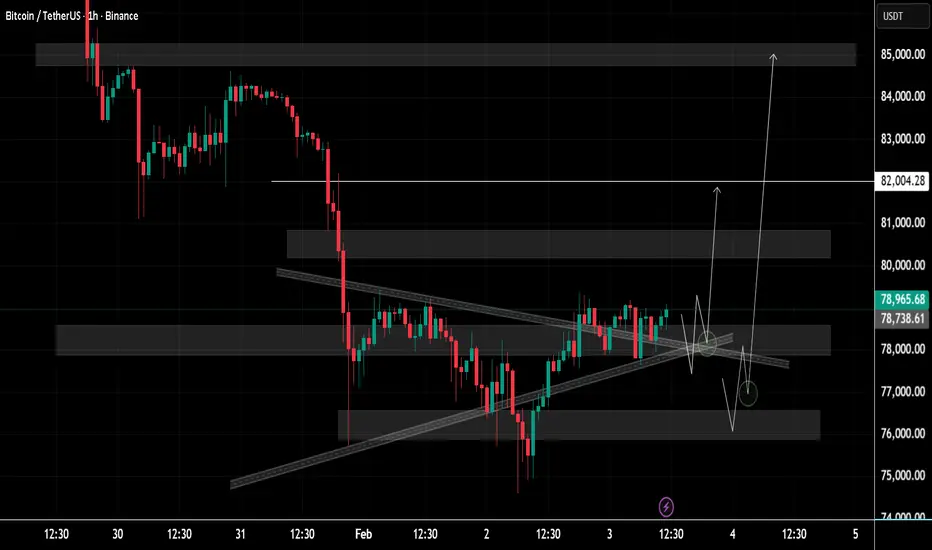
Bitcoin - Last drop, then a huge pump! (watch this wedge)Bitcoin is currently trading at around 78,000 at the time of writing this article, and I expect the price to go down to 71k - 72k in the short term. Why? As we can see on the chart, there are many reasons why Bitcoin should go down. The first reason is that whales (banks, institutions) still didn't

The best trades require research, then commitment.
Get started for free$0 forever, no credit card needed

Scott "Kidd" PoteetPolaris Dawn astronaut

Where the world does markets
Join 100 million traders and investors taking the future into their own hands.

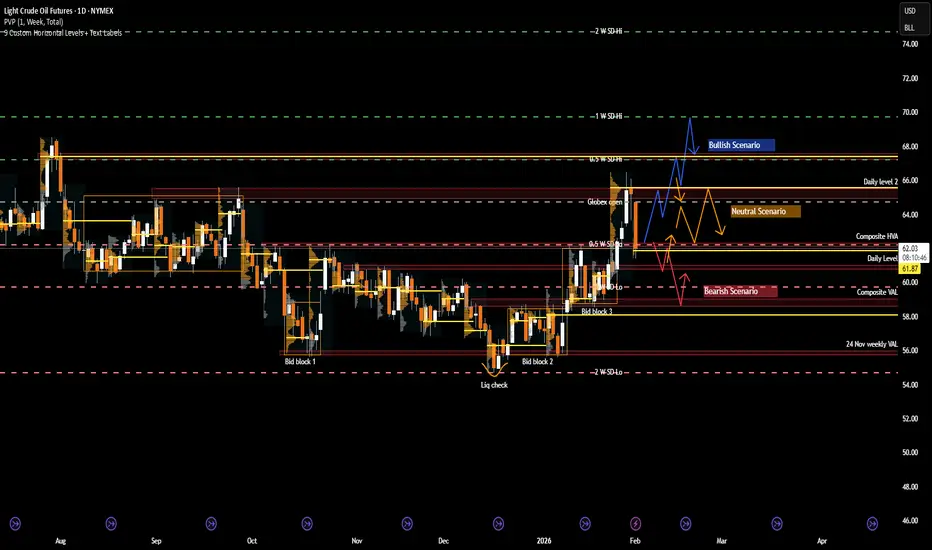
CL: Crude Oil at a Crossroads as Geopolitics Meet Key LevelsRecent Sentiment and Key Headlines Driving Crude
Crude oil sentiment over recent weeks has been shaped by a renewed mix of geopolitical risk and shifting expectations around global supply discipline. Headlines tied to Venezuela and Iran have been particularly influential, adding a layer of risk pr
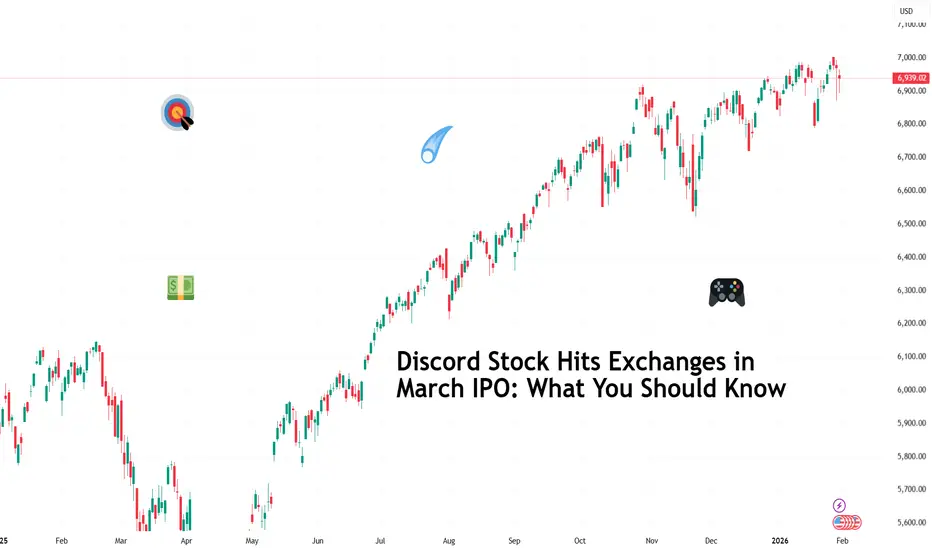
Discord Stock Hits Exchanges in March IPO: What You Should KnowDiscord NASDAQ:DISCORD has filed confidential IPO paperwork with the SEC and is aiming for a March debut (ref: the IPO calendar ), reigniting speculation around one of Silicon Valley’s most closely watched private companies.
The late-stage startup has lined up heavyweight underwriters Goldman Sa
AUD/USD – H1 - Head & Shoulders BreakdownAUD/USD has printed a clean Head & Shoulders pattern on the H1 timeframe , signaling a potential trend reversal after a strong bullish run. Price has now broken below the neckline, confirming bearish momentum and opening the door for a deeper correction. OANDA:AUDUSD
🔍 Technical Analysis
🧠 Cla

Bitcoin long-term: Full analysis year 2026 including 2027 & 2029My dear reader... It is my pleasure to write again for you today. I would like to show you the chart for Bitcoin long-term; what it looks like, what to expect.
Recently, we had a nice surprise with a bearish move that lasted just a few days longer than expected. A supposed retrace that went from $9
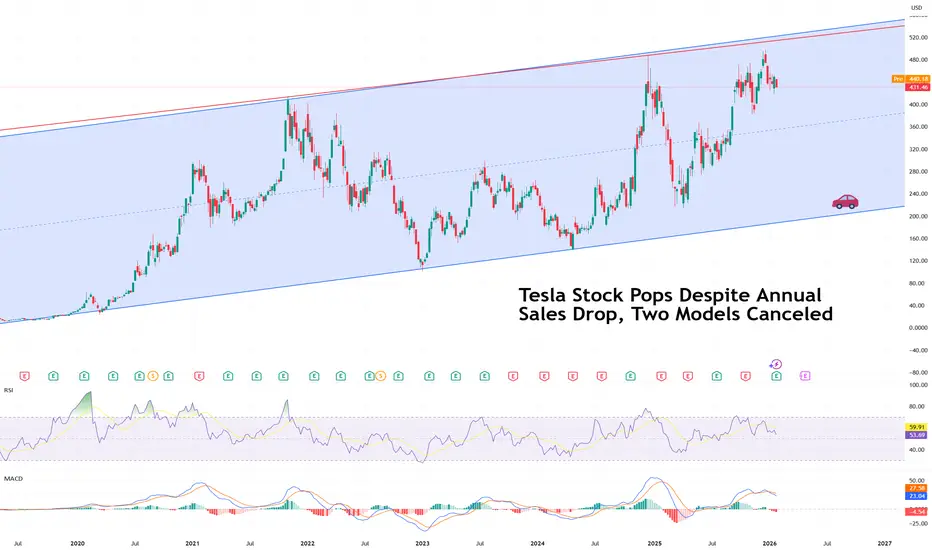
Tesla Stock Pops Despite Annual Sales Drop, Two Models CanceledTesla stock NASDAQ:TSLA managed a modest pop pre-market Thursday, rising about 3%, even as the company delivered a quarter that, on the surface, looked anything but celebratory.
Profits slid. Revenue dipped. Vehicle sales declined. Two iconic models were sent quietly into retirement. And yet, the
EURUSDHello Traders! 👋
What are your thoughts on EURUSD?
EUR/USD has successfully broken above the descending trendline as well as a key resistance zone, confirming a bullish breakout on the daily timeframe.
At current levels, price is approaching a resistance area. Therefore, a short-term correction

Hellena | GOLD (4H): LONG to resistance 5200.Since the movement continues and clearly shows no signs of reversing, I had to slightly revise the wave count, and it looks as if the impulse has been extended.
This means that the higher-order wave “3” has just ended or will end soon.
This means that wave “5” is not over yet and we should expect a

Silver’s Generational Super Cycle: 31 Years of Waiting, 15 YearsWelcome to a special macro edition of the Mubite market analysis.
Today, we are zooming out to the 12-Month (Yearly) timeframe on Silver (XAG/USD).
In trading, patience is not just a virtue; it is a requirement for generational wealth. The chart we are looking at today tells a story of massive cyc

Silver at $110 in Fierce Rally, Gold Tops $5,100. What’s Behind?(What a chart.)
Silver OANDA:XAGUSD is on a tear. Actually, scratch that — silver is on a mission. Prices have surged more than 250% over the past year, including a blistering 50% jump in January alone, lifting the metal to around $109 an ounce and placing the $110 level firmly in sight .
That

See all editors' picks ideas
Smart Trader, Episode 03, by Ata Sabanci, Candles and TradelinesA volume-based multi-block analysis system designed for educational purposes. This indicator helps traders understand their current market situation through aggregated block analysis, volumetric calculations, trend detection, and an AI-style narrative engine.
━━━━━━━━━━━━━━━━━━━━━━━━━━━━━━━━━━━━━━━

Asset Drift ModelThis Asset Drift Model is a statistical tool designed to detect whether an asset exhibits a systematic directional tendency in its historical returns. Unlike traditional momentum indicators that react to price movements, this indicator performs a formal hypothesis test to determine if the observed d

Hyperfork Matrix🔱 Hyperfork Matrix 🔱 A manual Andrews Pitchfork tool with action/reaction propagation lines and lattice matrix functionality. This indicator extends Dr. Alan Andrews' and Patrick Mikula's median line methodology by automating the projection of reaction and action lines at equidistant intervals, cr

Arbitrage Matrix [LuxAlgo]The Arbitrage Matrix is a follow-up to our Arbitrage Detector that compares the spreads in price and volume between all the major crypto exchanges and forex brokers for any given asset.
It provides traders with a comprehensive view of the entire marketplace, revealing hidden relationships among d

Wyckoff Schematic by Kingshuk GhoshThe "Wyckoff Schematic" is a Pine Script indicator that automatically detects and visualizes Wyckoff Method accumulation and distribution patterns in real-time. This professional tool helps traders identify smart money movements, phase transitions, and critical market structure points.
Key Features

Volume Cluster Profile [VCP] (Zeiierman)█ Overview
Volume Cluster Profile (Zeiierman) is a volume profile tool that builds cluster-enhanced volume-by-price maps for both the current market window and prior swing segments.
Instead of treating the profile as a raw histogram only, VCP detects the dominant volume peaks (clusters) insid

DeeptestDeeptest: Quantitative Backtesting Library for Pine Script
━━━━━━━━━━━━━━━━━━━━━━━━━━━━━━━━━━
█ OVERVIEW
Deeptest is a Pine Script library that provides quantitative analysis tools for strategy backtesting. It calculates over 100 statistical metrics including risk-adjusted return ratios (Sharpe

Arbitrage Detector [LuxAlgo]The Arbitrage Detector unveils hidden spreads in the crypto and forex markets. It compares the same asset on the main crypto exchanges and forex brokers and displays both prices and volumes on a dashboard, as well as the maximum spread detected on a histogram divided by four user-selected percenti

Multi-Distribution Volume Profile (Zeiierman)█ Overview
Multi-Distribution Volume Profile (Zeiierman) is a flexible, structure-first volume profile tool that lets you reshape how volume is distributed across price, from classic uniform profiles to advanced statistical curves like Gaussian, Lognormal, Student-t, and more.
Instead of forcin

Multi-Ticker Anchored CandlesMulti-Ticker Anchored Candles (MTAC) is a simple tool for overlaying up to 3 tickers onto the same chart. This is achieved by interpreting each symbol's OHLC data as percentages, then plotting their candle points relative to the main chart's open. This allows for a simple comparison of tickers to tr

See all indicators and strategies
Community trends
Nvidia - What a consolidation!🥽Nvidia ( NASDAQ:NVDA ) is just moving sideways:
🔎Analysis summary:
For more than the past six months, Nvidia has overall been moving sideways. But looking at the higher timeframe, it is still pretty likely that Nvidia will create a shorter term correction. This will then lead to a major bull

Intuit and Netflix. The Danger of Broken TrendsIntuit and Netflix. The Danger of Broken Trends
Momentum is the most powerful force in physics and finance but when an object in motion suddenly stops the impact is catastrophic. We often assume trends last forever yet the moment a multi year structure fractures it triggers a violent repricing e

Riot Platforms at $15.47: Oversold Setup Points to a Bounce ThiCurrent Price: 15.47 (Analysis was generated on Monday Morning)
Direction: LONG
Confidence level: 56%(Price is sitting near a widely watched support zone with oversold momentum signals, while trader commentary suggests dip-buying interest despite mixed broader sentiment.)
Targets
Target 1: 16.30

AMD Will this Double Top start the new Bear Cycle?Advanced Micro Devices (AMD) has been practically consolidating since its October 27 2025 High between the Resistance it created and the 1D MA100 (black trend-line) that served as Support in November - January, holding firmly.
Two weeks ago the resulting 1D MA100 rebound got rejected on that Resist

$AMZN to upside during earnings week This is my AMZN long-term call setup.
I’m currently positioned in the 255 call expiring February 27th, 2026.
From a 1D-timeframe perspective, the uptrend remains intact from Nov 24, 2025.
Price continues to print higher lows on the daily, and we’re holding above the rising 200 EMA — which keeps th

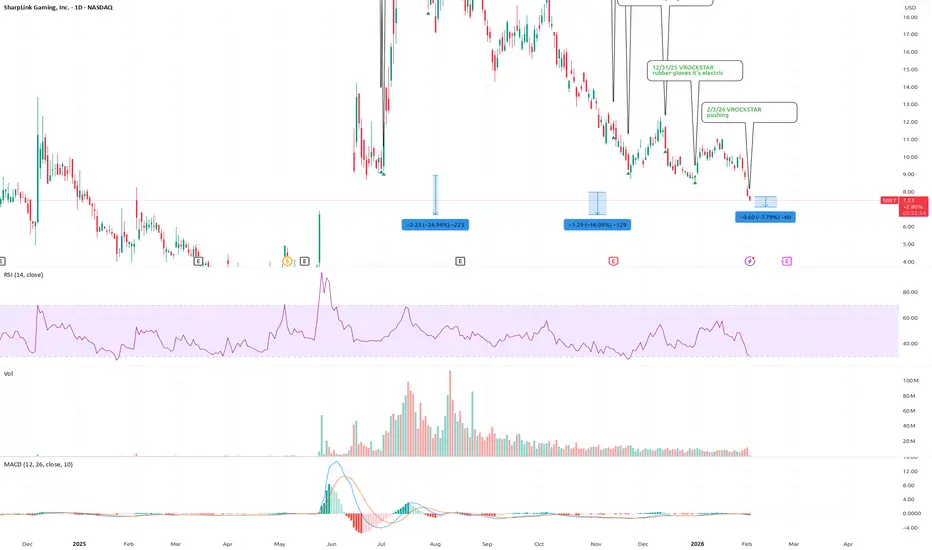
2/3/26 - $sbet - pushing2/3/26 :: VROCKSTAR :: NASDAQ:SBET
pushing
- $1.8k implied eth
- no liquidation risk
- can still go lower
- but i'm starting to size this up
- 40% of book
V
PALANTIR: Bounce From Key Support LevelPLTR shares continued their decline, reaching support at $148.51 yesterday. For the turquoise wave 3 to complete, this level needs to be decisively breached. However, there remains a risk that the green five-wave sequence is not yet finished, which could see the price move above the $222.00 resistan

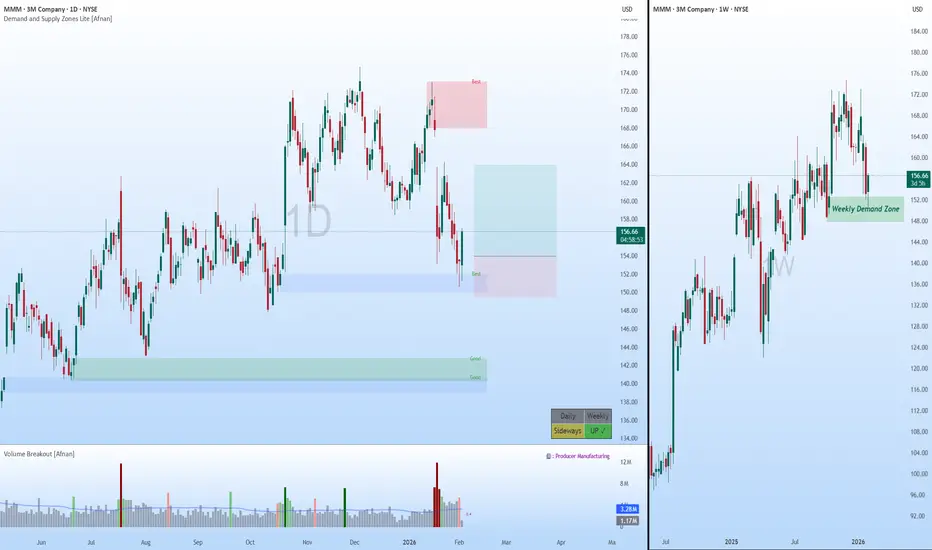
MMM : Power of Nested Demand Zones in a Strong UptrendThe weekly trend is clearly UP . Price structure shows higher highs and higher lows, which immediately puts the odds in favor of buyers. When the higher timeframe trend is bullish, our focus should always be on buying from demand , not guessing tops.
🟢 Multi-Timeframe Demand Zone Alignment 🟢
On
wait for confirmationLet’s stay patient. The trend is still bearish, so the smart move is to wait for price to clearly break and close above the channel resistance. Once that resistance is crossed and confirmed, we’ll all jump in on the opportunity together. No FOMO — confirmation first.

WULF | DailyNASDAQ:WULF — Quantum Model Projection
Bullish Alt. 📈 | Daily
Since late October, Triangle Intermediate Wave (4) has matured into a textbook formation, with its final Minor Wave E pullback held by the Q-Structure λₛ within the divergent zone, as anticipated.
Despite Minor E’s internal structure

See all stocks ideas
Today
AUDCAudioCodes Ltd.
Actual
0.16
USD
Estimate
0.16
USD
Today
PAXPatria Investments Limited
Actual
0.50
USD
Estimate
0.45
USD
Today
BALLBall Corporation
Actual
0.91
USD
Estimate
0.90
USD
Today
WTWWillis Towers Watson Public Limited Company
Actual
8.12
USD
Estimate
7.96
USD
Today
ADMArcher-Daniels-Midland Company
Actual
0.87
USD
Estimate
0.80
USD
Today
EPDEnterprise Products Partners L.P.
Actual
0.75
USD
Estimate
0.69
USD
Today
PEPPepsiCo, Inc.
Actual
2.26
USD
Estimate
2.24
USD
Today
ITGartner, Inc.
Actual
3.94
USD
Estimate
3.51
USD
See more events
Today
J
JAGUJaguar Uranium Corp.
Exchange
AMEX
Offer price
4.00 - 6.00
USD
Tomorrow
M
MANEVeradermics Inc.
Exchange
NYSE
Offer price
14.00 - 16.00
USD
Feb 5
F
FPSForgent Power Solutions Inc.
Exchange
NYSE
Offer price
25.00 - 29.00
USD
Feb 5
B
BOBSBob’s Discount Furniture Inc.
Exchange
NYSE
Offer price
17.00 - 19.00
USD
Feb 6
A
AGMBAgomAb Therapeutics NV
Exchange
NASDAQ
Offer price
15.00 - 17.00
USD
Feb 6
OFRMOnce Upon A Farm PBC
Exchange
NYSE
Offer price
17.00 - 19.00
USD
Feb 6
L
LFTOLiftoff Mobile Inc.
Exchange
NASDAQ
Offer price
26.00 - 30.00
USD
See more events
Community trends
Bitcoin - Last drop, then a huge pump! (watch this wedge)Bitcoin is currently trading at around 78,000 at the time of writing this article, and I expect the price to go down to 71k - 72k in the short term. Why? As we can see on the chart, there are many reasons why Bitcoin should go down. The first reason is that whales (banks, institutions) still didn't
February Alts Market RequestFebruary Altcoin Analysis Request – Limited Slots ⚠️
February will be treated with a potential bear market mindset. Expect selective, risk-aware analysis only, focused on structure, downside protection, and realistic scenarios, not hype.
🔹 Only 20 altcoins will be analyzed for February
🔹 First com

Elise | BTCUSD – 30M – Bearish ContinuationBITSTAMP:BTCUSD
After the sharp sell-off, BTC attempted a corrective consolidation but failed to regain bullish momentum. The price respected the supply zone and showed rejection, indicating this move is a distribution phase rather than a reversal. As long as price remains capped below supply, dow

The "US Bitcoin Reserve" is a Lie. (A Macro Deep Dive)While Retail is chasing headlines about a "Strategic Bitcoin Reserve," Smart Money is aggressively de-risking. Why? Because the "News" is a linguistic misunderstanding, and the "Macro" just turned violently bearish.
If you are buying this dip because you think the US Government is about to print t

BTC monthly chart is bearishBTC / USD
I've been bearish on Bitcoin for the past 4 months (previous posts are attached below), and today we're seeing the price of Bitcoin continue to decline.
What is the current situation for Bitcoin (monthly chart)?
In short, Bitcoin has broken its upward trendline (white), as well as a
Bitcoin at High-Probability Reversal Zone – Long Setup in PlayAs I expected in the previous idea , Bitcoin( BINANCE:BTCUSDT ) started declining and reached its full target.
Right now, Bitcoin has entered the heavy support zone($78,260-$70,080). Generally, strong support and resistance zones don’t break with just one attempt. On a daily timeframe, this is the

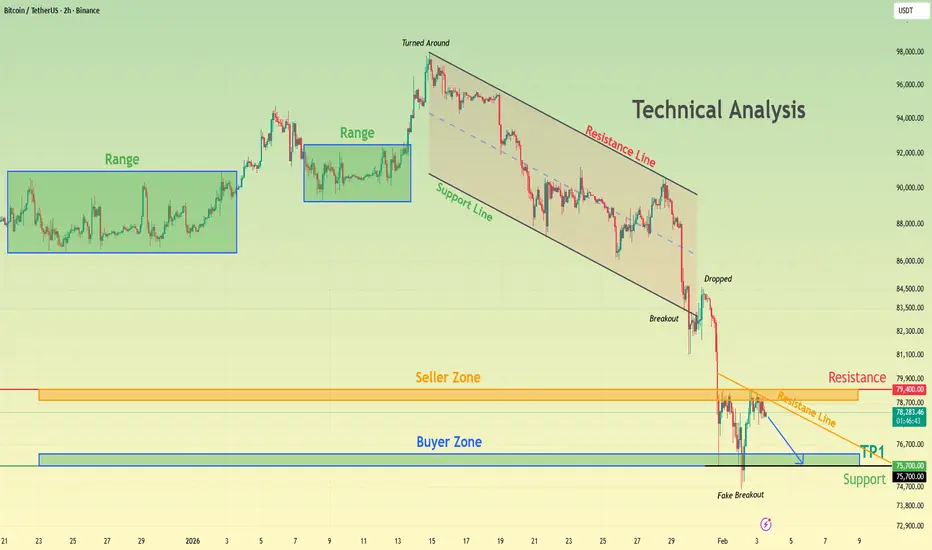
BTCUSDT Bearish Structure Holds - Short From ResistanceHello traders! Here’s my technical outlook on BTCUSDT (2H) based on the current chart structure. Bitcoin initially traded within a clearly defined range, where price moved sideways for an extended period, indicating market equilibrium and accumulation before the next directional move. This ranging p
Bitcoin Price Update – Clean & Clear ExplanationBitcoin is currently consolidating after a sharp sell-off, trading around 78,900. Price action is forming a symmetrical triangle, showing indecision as buyers and sellers compress price toward a breakout point.
Key Technical Structure
If Price is squeezed between a descending resistance trendline
BTCUSDT Long: Breakdown, Fakeout & Potential Rebound To $79,300Hello traders! Here’s a clear technical breakdown of BTCUSDT (3H) based on the current chart structure. BTCUSDT was previously trading within a well-defined ascending channel, where price consistently respected rising support and resistance, printing higher highs and higher lows. This structure conf

SHIBA INU: Don't Miss This Trade - LONG TERM TRADESHIBA INU: Don't Miss This Trade - LONG TERM TRADE
Currently, SHIBA INU is in a Long-Term Accumulation Before Next Move
SHIBA INU is approaching a major historical support zone around 0.0000067, a level that has triggered strong bullish reactions in the past.
Price has been consolidating for mont

See all crypto ideas
Gold Tests 4400 as Bullish Scenario EmergesGold Tests 4400 as Bullish Scenario Emerges
After taking into account all the confusion created by GOLD on our previous analysis, the chances are that gold may rise from the current zone.
Gold has already tested a very strong support zone dating back to mid-October 2025. It looks like the price h

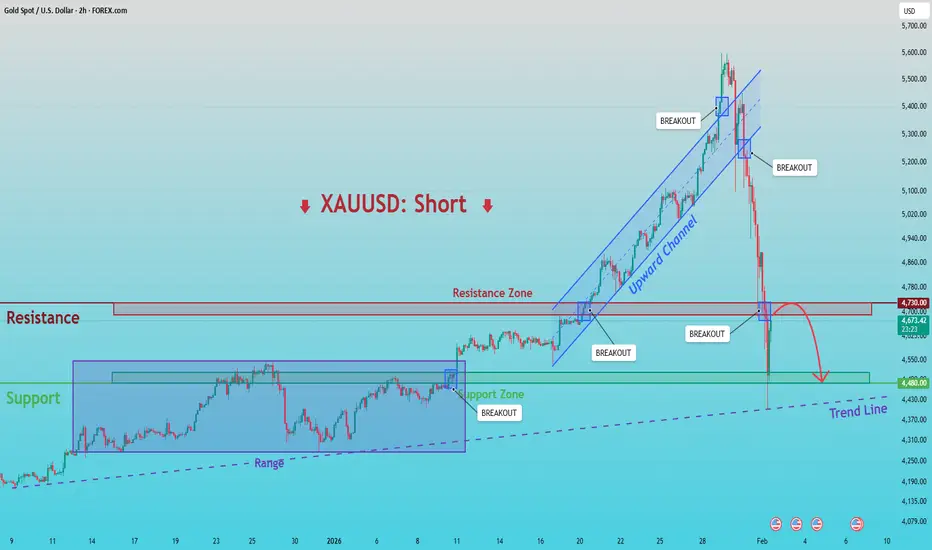
XAUUSD: Below 4,730 Resistance - Targeting 4,480 SupportHello everyone, here is my breakdown of the current XAUUSD setup.
Market Analysis
XAUUSD was previously trading within a clearly defined upward channel, where price respected both the rising support and resistance boundaries, forming a sequence of higher highs and higher lows. This structure conf
Gold 30-Min — Volume Buy & Sell Reversal Triggered⚡Base : Hanzo Trading Alpha Algorithm
The algorithm calculates volatility displacement vs liquidity recovery, identifying where probability meets imbalance.
It trades only where precision, volume, and manipulation intersect —only logic.
✈️ Technical Reasons
/ Direction — LONG / Reversal 4355 Area

Gold Price Analysis – Key Resistance, Support Levels, and PotentThis chart provides an in-depth analysis of gold prices, highlighting critical resistance and support zones. The Sell Zone at 5,438.172 represents a key resistance level where price may face rejection, offering a potential sell opportunity if the level holds. The Support Zone at 4,933.394 is expecte

Hellena | GOLD (4H): LONG to 4800 area.Colleagues, the situation with gold is very complicated. The latest strong and deep correction suggests that these movements are movements in higher-order waves, which should have formed later.
But we have what we have, and I believe that wave “III” of the highest order is complete, which explains

Gold Under Pressure | Fed Chair Warsh Fuels Sell Zone at 4,800Hey Traders,
In today’s trading session, we are closely monitoring XAUUSD (Gold) for a potential selling opportunity around the 4,800 zone. Gold was previously trading in a strong uptrend and is now undergoing a corrective phase, approaching a key retracement level and the 4,800 support-turned-resi

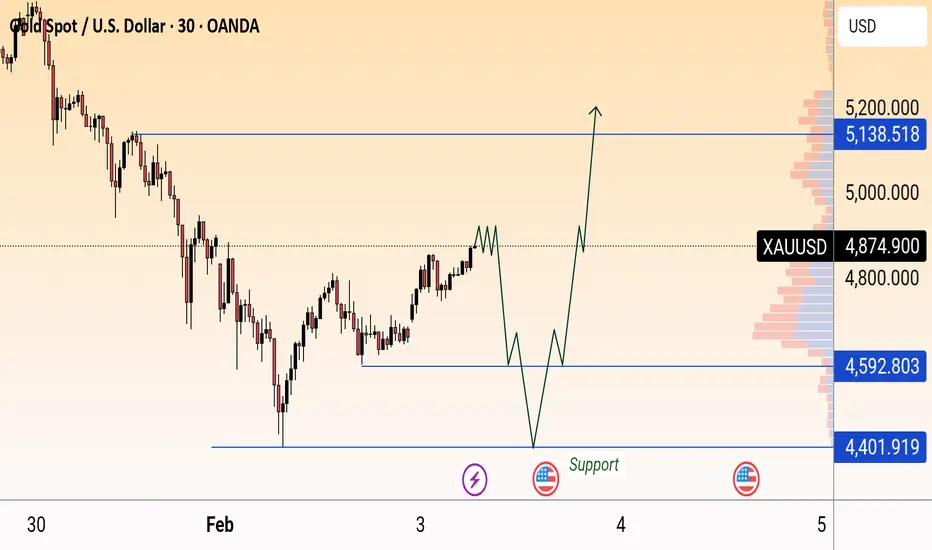
GoldGold is currently consolidating after a strong bullish move. Price is holding above the key support zone around 4,590–4,600, indicating buyers are still active. The structure suggests a possible pullback into support, followed by a bullish continuation.
If price respects the support area, we may see
Gold H1: Distribution Phase After Break of StructureThis is a 1-hour (H1) XAUUSD (Gold vs USD) chart showing a clear market structure shift from accumulation to distribution, then into a strong bearish trend.
Key phases visible:
Range / Accumulation (Left side)
Price moves sideways inside a marked range, indicating consolidation and liquidity build

Gold Breaks Its Trend – Sellers Take ControlAfter a sharp rally to record highs, XAUUSD has officially entered a structural weakening phase , no longer just a normal corrective pullback. Pressure from a stronger USD, expectations that the Fed will maintain a hawkish stance, and aggressive profit-taking in the derivatives marke t have all c

GOLD - Correction within the local downtrend FX:XAUUSD stabilizes after correction, returning above $4750 after testing the $4400 area earlier in the week. However, the overall trend remains under pressure.
Key factors: DXY remains strong, limiting gold's growth. Tensions between the US and Iran have eased slightly, reducing demand for g

See all futures ideas
EURUSD Bulls Take Control - 1.1940 as Next TestHello traders! Here’s my technical outlook on EURUSD (3H) based on the current chart structure. EURUSD previously traded within a well-defined ascending channel, where price consistently respected both the rising support line and the channel resistance, confirming steady bullish control and healthy

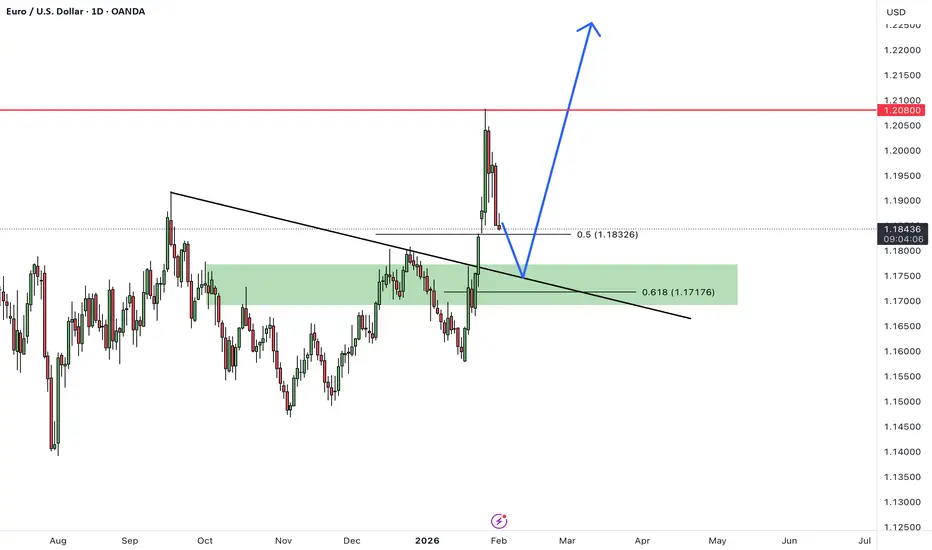
EURUSDHello Traders! 👋
What are your thoughts on EURUSD?
EUR/USD successfully broke above the key resistance zone and the descending trendline, extending its bullish move toward the 1.1200 area. From this level, the pair entered a corrective phase.
This pullback is considered a healthy correction and a
USD/CHF – Triangle Breakout Confirmed (30.01.2026)📝 Description🔍 Setup FX:USDCHF
USD/CHF formed a clear Triangle consolidation after a strong bearish move, showing lower highs and higher lows — compression before expansion.
Price has now broken above the descending trendline and is holding structure with a breakout & retest near the support zon

EURUSD Short: Rally Stalls at Supply - Key Reaction Near 1.1800Hello traders! Here’s a clear technical breakdown of EURUSD (1H) based on the current chart structure. EURUSD has recently completed a notable structural shift after trading within a well-defined descending channel. During this phase, price consistently respected the falling resistance and printed l

03.02.26 Daily ForecastPairs on Watch -
FX:NZDUSD
FX:EURUSD
FX:NZDCAD
A short overview of the instruments I am looking at for today, multi-timeframe analysis down to what I will be looking at for an entry. Enjoy!

AUD/USD | IFVG Retest (READ THE CAPTION)As you can see in the hourly chart of AUDUSD, after today's open, it soared the skies and hit the IFVG High at 0.7043 and reached 0.7050 before dropping and closing in the IFVG zone and then afterwards, dropping lower, going outside the IFVG zone and now it's being traded at 0.7031. I expect AUD to

USDJPY 30Min Engaged ( Bullish Reversal Entry Detected )⚡Base : Hanzo Trading Alpha Algorithm
The algorithm calculates volatility displacement vs liquidity recovery, identifying where probability meets imbalance.
It trades only where precision, volume, and manipulation intersect —only logic.
Technical Reasons
/ Direction — LONG / Reversal 154.860 Area

CADCHF: When Can It Resume The Bullish TrendCADCHF: When Can It Resume The Bullish Trend
CADCHF is suffering from a prolonged downtrend due to issues that I will not explain in much detail.
CADCHF reached a historical low of 0.5600. This area has been tested three times so far and has bounced back up, indicating that we have strong interes

GBPUSD: Crowded Shorts + Bearish February SeasonalityGBPUSD continues to trade within a well-defined bullish daily structure following the impulsive breakout from the November base. Price is now consolidating inside a premium zone after the latest expansion, a condition that typically precedes either a shallow pullback or a time-based correction rathe

After a strong rally, the market is cooling off to retest equiliHello everyone,
EURUSD is currently displaying a very familiar forex market behavior: a sharp advance → profit-taking → a return toward balance.
Earlier, EURUSD rebounded clearly from the 1.16 area, forming a sequence of higher highs and higher lows, with EMA 34 and EMA 89 stacked cleanly and s

See all forex ideas
| - | - | - | - | - | - | - | ||
| - | - | - | - | - | - | - | ||
| - | - | - | - | - | - | - | ||
| - | - | - | - | - | - | - | ||
| - | - | - | - | - | - | - | ||
| - | - | - | - | - | - | - | ||
| - | - | - | - | - | - | - | ||
| - | - | - | - | - | - | - |
Trade directly on Supercharts through our supported, fully-verified, and user-reviewed brokers.


