Elon Musk vs Trump: Who you betting on?Elon Musk and Donald Trump have recently had a public falling-out, with their feud playing out on social media and in political circles.
The dispute seems to have started over Trump's new budget bill, which Musk has criticized for increasing the national debt. Trump, in turn, accused Musk of being

The best trades require research, then commitment.
Get started for free$0 forever, no credit card needed

Scott "Kidd" PoteetThe unlikely astronaut

Where the world does markets
Join 100 million traders and investors taking the future into their own hands.

OptionsMastery: Inverse head and shoulders on UAL! 🔉Sound on!🔉
📣Make sure to watch fullscreen!📣
Thank you as always for watching my videos. I hope that you learned something very educational! Please feel free to like, share, and comment on this post. Remember only risk what you are willing to lose. Trading is very risky but it can change your life!

The MSCI World index sets a new all-time record!The MSCI World stock market index set a new all-time record during the trading session of Monday June 2, wiping out the entire stock market shock of February/March, which saw the global equity market lose 20%. This technical signal still needs to be confirmed at the end of the week at the next weekl

USDJPY forms textbook head and shoulders patternOur last bearish call on USDJPY played out perfectly. Now, a new setup is forming. With US ISM data showing contraction and stock markets under pressure, the dollar-yen could be next to drop. Watch as we break down the textbook head and shoulders pattern and the levels to watch for a potential 600+

Do bulls have enough steam to drive gold higher?A lot of things to consider this week, a lot of data and geopolitical tensions. Will the economic uncertainty and potential bad US jobs data drive TVC:GOLD higher? Let's dig in.
FX_IDC:XAUUSD
Let us know what you think in the comments below.
Thank you.
77.3% of retail investor accounts lose

Bull market scenario LITECOINAt this period, I'm speaking about LITECOIN, which currently has one of the strongest bull-looking charts on cryptocurrency!
We may see the price testing Fibo's higher levels very soon...
A bull market may begin, so I recommend focusing on higher price markings...
On another market, like BTC, Ethe

TRVG - Basic Analysis can lead to great trade ideas!This is as simple as it gets. See a taper, be a taper!
Good trade opportunity incoming if we prove a breakout of red strong selling and we can make our way toward a HTF purple tapered selling and ultimately prove a HTF buying continuation in orange.
Happy Trading :)

Rate Cuts and Risky Bets: When the Fed Rolls Out the Red Carpet🎬 The Fed’s June Meeting Is Around the Corner
Mark your calendars: June 17–18 is when the Federal Reserve's Federal Open Market Committee (FOMC) convenes next. With the benchmark interest rate ECONOMICS:USINTR currently holding steady at 4.25% – 4.50%, investors and policymakers alike are keenl

Bullish Trigger Hit! Looking For Longs on the S&PLast time we spoke, I mentioned some key levels I wanted to see price drop to before considering a move to the upside. And what do you know — here we are.
In today’s video, I share an update on the trade idea and how we can position ourselves for the next big play.
Walk with me as I break down thi

Does Bitcoin Keep You Up at Night?Just a meme I made this morning.
The Weekly All Time High Breakout has failed, twice, just like 2021...

See all editors' picks ideas
Support and Resistance Logistic Regression | Flux Charts💎 GENERAL OVERVIEW
Introducing our new Logistic Regression Support / Resistance indicator! This tool leverages advanced statistical modeling "Logistic Regressions" to identify and project key price levels where the market is likely to find support or resistance. For more information about the proc

Mandelbrot-Fibonacci Cascade Vortex (MFCV)Mandelbrot-Fibonacci Cascade Vortex (MFCV) - Where Chaos Theory Meets Sacred Geometry
A Revolutionary Synthesis of Fractal Mathematics and Golden Ratio Dynamics
What began as an exploration into Benoit Mandelbrot's fractal market hypothesis and the mysterious appearance of Fibonacci sequences i

EMD Trend [InvestorUnknown]EMD Trend is a dynamic trend-following indicator that utilizes Exponential Moving Deviation (EMD) to build adaptive channels around a selected moving average. Designed for traders who value responsive trend signals with built-in volatility sensitivity, this tool highlights directional bias, market

Bear Market Probability Model# Bear Market Probability Model: A Multi-Factor Risk Assessment Framework
The Bear Market Probability Model represents a comprehensive quantitative framework for assessing systemic market risk through the integration of 13 distinct risk factors across four analytical categories: macroeconomic indic

Range Filter [DW]This is an experimental study designed to filter out minor price action for a clearer view of trends.
Inspired by the QQE's volatility filter, this filter applies the process directly to price rather than to a smoothed RSI.
First, a smooth average price range is calculated for the basis of the fil

Delta Volume Columns Pro [LucF]█ OVERVIEW
This indicator displays volume delta information calculated with intrabar inspection on historical bars, and feed updates when running in realtime. It is designed to run in a pane and can display either stacked buy/sell volume columns or a signal line which can be calculated and dis

BERLIN CandlesA problem with Heikin Ashi is that while it gives you a great overview of overall direction, it is rarely possible to use it as a replacement for normal japanese
candlesticks. The reason for this is that actual price data is lost, since the candles are more akin to a moving average than a different

Support Resistance ChannelsHello All,
For Long time I was planning to make Support/Resistance Channels script, finally I had time and here it is.
How this script works?
- it finds and keeps Pivot Points
- when it found a new Pivot Point it clears older S/R channels then;
- for each pivot point it searches all pivot po

MathSpecialFunctionsConvolve1DLibrary "MathSpecialFunctionsConvolve1D"
Convolution is one of the most important mathematical operations used in signal processing. This simple mathematical operation pops up in many scientific and industrial applications, from its use in a billion-layer large CNN to simple image denoising.
___

ErrorFunctionsLibrary "ErrorFunctions"
A collection of functions used to approximate the area beneath a Gaussian curve.
Because an ERF (Error Function) is an integral, there is no closed-form solution to calculating the area beneath the curve. Meaning all ERFs are approximations; precisely wrong, but mostly a

See all indicators and strategies
News didn't load
Looks like that didn't go very well. Let's try again.
Community trends
congrats to tesla longs! boost and follow for more ❤️🔥 in my last tesla update in early april I mentioned the break of trend resistance, and how that resistance acted as support.. how this meant the bottom was likely in. lots of people doubted this, but here we are a few months later at my short term targets 🎯
now we are

OptionsMastery: Inverse head and shoulders on UAL! 🔉Sound on!🔉
📣Make sure to watch fullscreen!📣
Thank you as always for watching my videos. I hope that you learned something very educational! Please feel free to like, share, and comment on this post. Remember only risk what you are willing to lose. Trading is very risky but it can change your life!

Elon Musk vs Trump: Who you betting on?Elon Musk and Donald Trump have recently had a public falling-out, with their feud playing out on social media and in political circles.
The dispute seems to have started over Trump's new budget bill, which Musk has criticized for increasing the national debt. Trump, in turn, accused Musk of being
TSLA Honey Ticking Bull Trap!TSLA has a beautiful big ars bear flag! While it should have broken down to trigger a short trade, it decided to Honey Tick people right into a Trap!
It formed a perfect MEGAPHONE in wave 3 up that has now CRACKED! This is a much juicer short setup with the potential of collapsing from here and tak

Tesla Still Slightly Bearish Until FED Cuts RatesOne of my followers asked, "how about now?"
The question comes because he is bullish and I am sharing bearish charts.
Here is the thing, the chart is still bearish of course because of the red candles and the double-top. This can't change unless the last high is broken with significant rising volu

Tesla POP off the lowsTesla is currently experiencing a 5 wave impulsive move from the lows of the tarriff turmoil zone, and seeing increasing strength as it climbs and consolidates.
Generally, whenever you have strong bounces such as this one, you can look for a 5 wave impulse move and utilize fibonacci extensions whi

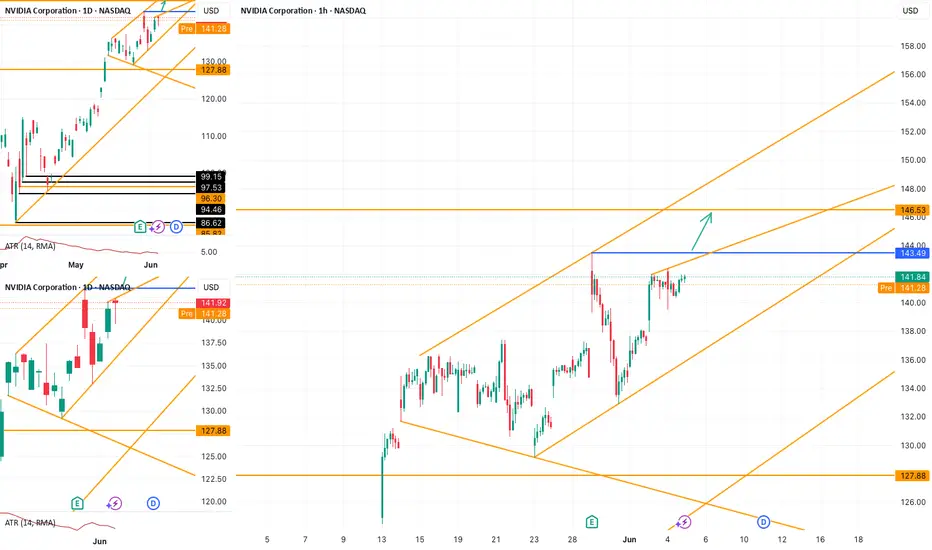
NVDA Setup: Clean Path to 146.53 If 143.49 Gives WayNASDAQ:NVDA continues to move within a rising channel. On the 1H chart, no major trendline currently limits further upside. If price breaks above the key swing high at 143.49 , the next potential target lies around 146.53 .
Meta Platforms - This stock tastes sooo good!Meta Platforms - NASDAQ:META - will print a new all time high:
(click chart above to see the in depth analysis👆🏻)
Over the course of the past two months, Meta has been rallying +40%. This recent behaviour was not unexpected at all but rather the consequence of the all time high break and retes

COST Short – Double Top Rejection with Bearish CCI SignalNASDAQ:COST
📅 Entry: June 5, 2025
📉 Price: 1,055
✋ Stop: 1,078
🎯 Target: 1,013
⚖️ Risk-Reward: 1:2
✅ Status: Target hit earlier than expected
🧠 Trade Idea:
COST tested a major resistance zone at 1,078 — aligning with:
A historical horizontal resistance
The top boundary of a rising channel
Meanwhi

See all stocks ideas
Today
ABMABM Industries Incorporated
Actual
0.86
USD
Estimate
0.86
USD
Today
MANUManchester
Actual
−0.33
USD
Estimate
−0.25
USD
Today
GIIIG-III Apparel Group, LTD.
Actual
0.19
USD
Estimate
0.13
USD
Today
RNWReNew Energy Global plc
Actual
0.06
USD
Estimate
0.06
USD
Today
DAKTDaktronics, Inc.
Actual
—
Estimate
0.15
USD
Today
PODCPodcastOne, Inc.
Actual
—
Estimate
−0.03
USD
Today
KIRKKirkland's, Inc.
Actual
—
Estimate
−0.47
USD
Today
PLCEChildren's Place, Inc. (The)
Actual
—
Estimate
−0.08
USD
See more events
News didn't load
Looks like that didn't go very well. Let's try again.
Community trends
Bitcoin - Secret pattern no one talks about, drop below 100k!The price of Bitcoin is currently in a downtrend. We can see that the price is inside this secret descending channel that really no one talks about. As long as we are in this channel, Bitcoin remains bearish, and we can expect a huge drop in the short term! So what is the plan?
Currently I recommen

BITCOIN under brutal 4H squeeze. Buyers or sellers will prevail?Bitcoin (BTCUSD) is currently under the strongest squeeze we've seen this year as it's being compressed between the 4H MA50 (blue trend-line) and 4H MA200 (orange trend-line). Such tight price action usual precedes explosive moves.
Technically two patterns prevail: a long-term Channel Up and a shor

Bitcoin's Structure Breaks — PRZ May Trigger a BounceBitcoin ( BINANCE:BTCUSDT ) has finally continued its downward trend , as I expected in my previous idea .
Do you think this downward trend will continue or not?
Bitcoin has now managed to break the Support zone($104,180-$103,670) and the lower line of the Ascending Broadening Wedge Patt

TradeCityPro | Bitcoin Daily Analysis #108👋 Welcome to TradeCity Pro!
Let’s dive into the analysis of Bitcoin and key crypto indices. As usual, in this analysis, I’ll review the futures session triggers for New York.
⏳ 1-Hour Timeframe
As you can see in the 1-hour timeframe, yesterday the 105087 trigger was activated, and now after a pullb

HelenP. I Bitcoin may grow to resistance zone from trend lineHi folks today I'm prepared for you Bitcoin analytics. This chart shows how the price declined to the trend line and then made an impulse up to the support level, which coincided with the support zone. Also, price started to trades inside a pennant, where it soon broke the support level and then tra

AAVE I Weekly CLS I Model 2 I Dump it !!Hey, Market Warriors, here is another outlook on this instrument
If you’ve been following me, you already know every setup you see is built around a CLS Footprint, a Key Level, Liquidity and a specific execution model.
If you haven't followed me yet, start now.
My trading system is completely

Bitcoin's Roadmap: Price Structure, Fair Value & Market RhythmSince bottoming on November 21, 2022, Bitcoin has embarked on a remarkable bull run, rising +623.5% over 927 days and reaching a new all-time high (ATH) of ~112K.
When compared to the previous bull cycle, spanning 1061 days and producing a +2086% gain, this current rally shows signs of diminishing

ETHEREUM → Consolidation amid a bull marketBINANCE:ETHUSD is consolidating in the range of 2400-2750, and locally, the coin looks quite promising even against the backdrop of Bitcoin forming a correction...
ETH is forming a strong consolidation within which it confirms a bullish market structure. After a false breakout of resistance, the

Altcoins Market Bull Market Confirmed, RavencoinI have something very, very interesting here, and it has two parts.
1) Ravencoin is breaking out with three digits green, +150% within today's candle.
2) This is very interesting because this is the exact same chart as all the other major and minor altcoins —What one does, the rest follows. It con

Bitcoin may break resistance level and continue to move upHello traders, I want share with you my opinion about Bitcoin. If we look at the chart, we can see how the price entered an upward channel and declined to the support line. Then it started to grow and soon reached the 93500 support level, after which it broke this level and then some time traded nea

See all crypto ideas
News didn't load
Looks like that didn't go very well. Let's try again.
GOLD → Retesting resistance may lead to a breakoutFX:XAUUSD is still bullish. The price is consolidating in the range of 3390-3345, with an intermediate bottom forming inside the channel, which overall indicates positive signs.
On Thursday, gold is consolidating ahead of $3390. Consolidation after growth, within a bullish trend, is a good sign.

Lingrid | GOLD trend Continuation Targets April High RetestOANDA:XAUUSD has reclaimed the 3,350 level following a successful retest of the upward trendline, sustaining a bullish channel structure. After multiple breakouts and a clean consolidation above previous resistance, price is setting up for a potential move toward the 3,500 mark. A pullback and boun

GOLD 1H CHART ROUTE MAP UPDATEHey Everyone,
As anticipated, the market structure continues to respect our key levels and EMA5 dynamics to the letter.
After the clean bounce from 3334 into 3359, price did indeed push back toward 3389 for the retest, just as outlined. Once again ema5 failed to cross and lock above 3389, confirmi

GOLD NEXT MOVE (buying continued )(05-06-2025)Go through the analysis carefully and do trade accordingly.
Anup 'BIAS for the day (05-06-2025)
Current price- 3388
"if Price stays above 3370, then next target is 3398, 3415, 3430 and 3340 and below that 3430 and 3310 ".
-POSSIBILITY-1
Wait (as geopolitical situation are worsening )
-POSSIBILI

THE KOG REPORT - UpdateEnd of day update from us here at KOG:
It's been a decent week on the markets with our path and red boxes playing well from the low to the high for the pull back trade into the region we wanted and then the long completing all but one Red box target which was missed by 20pips.
With NFP tomorrow

XAU/USD..4h chart Pattern.Here’s a summary of My Gold (XAU/USD or XAU/INR?) trade setup:
📈 Trade Idea (Long Position in Gold)
Entry: 3394
Target: 3500
Stop Loss: Not specified (⚠️ Risk undefined)
Potential Gain: +106 points
Percentage Gain: +3.12%
🧮 Trade Considerations:
Reward: 3500 − 3394 = +106
Risk: ⚠️ Not defined

GOLD - Price can drop to support line of triangle patternHi guys, this is my overview for XAUUSD, feel free to check it and write your feedback in comments👊
In this chart price formed a triangle pattern, where it first declined to support line and then made an impulse up.
After this, Gold broke $3165 level and, after a small correction reached and broke

XAU/USD) Breakout strong bullish trend Read The captionSMC Trading point update
Technical analysis chart of gold (XAUUSD) on the 4-hour timeframe. Here’s a breakdown of the key ideas presented in the chart:
---
Key Support/Resistance Zone
A yellow rectangular zone marks a significant support/resistance level.
This level was previously a resis

Gold Hits All Targets with 500+ Pips – Eyes Now on $3420By examining the gold chart on the 4-hour timeframe, we can see that after our previous analysis, the price moved exactly as expected and successfully hit all four targets — $3367, $3380, $3391, and $3400 — reaching as high as $3403 and delivering over 500 pips of return.
After sweeping the liquidi

XAU/USD.2h chart pattern..From your XAU/USD (Gold vs USD) 2-hour chart, im showing a bullish channel breakout with a clearly marked target level.
📊 Observations:
The chart displays an ascending channel with price breaking above a key resistance zone (~3412).
The projected target is explicitly marked at:
🎯 3,500.641
Thi

See all futures ideas
News didn't load
Looks like that didn't go very well. Let's try again.
EURUSD Analysis Today: Technical and Order Flow Analysis !In this video I will be sharing my EURUSD analysis today, by providing my complete technical and order flow analysis, so you can watch it to possibly improve your forex trading skillset. The video is structured in 3 parts, first I will be performing my complete technical analysis, then I will be mov

USD/CAD) Bearish trand analysis Read The captionSMC trading point update
Technical analysis of USD/CAD on the 3-hour timeframe reflects a bearish market outlook. Here’s a breakdown of the idea:
---
Trend Overview:
The pair is in a clear downtrend, confirmed by:
Lower highs and lower lows
Price trading below the 200 EMA
A bearish flag

USD/CHF 4H Bearish Setup: FVG Rejection & EMA Resistance Strateg🔵 Chart Structure
🔻 Downtrend Identified
* Lower highs & lower lows forming.
* Resistance line sloping down 📉.
🧲 EMA 70 (0.82387)
* Acting as dynamic resistance 🔴.
* Price currently sitting just below it ⬇️.
💠 FVG (Fair Value Gap) — 0.82441 to 0.83097
* Price expected to fill the imbalance here.

GBP/USD.4H Chart pattern,GBP/USD (4-hour timeframe
An ascending triangle pattern.
A clear horizontal resistance around 1.36200–1.36300.
An upward projection toward a "TARGET POINT" labeled above the resistance.
To estimate the target from this breakout:
📌 Target Calculation (Measured Move Method)
Using the height of

USD/CAD - Bearish Flag (04.06.2025)The USD/CAD Pair on the M30 timeframe presents a Potential Selling Opportunity due to a recent Formation of a Bearish Flag Pattern. This suggests a shift in momentum towards the downside in the coming hours.
Possible Short Trade:
Entry: Consider Entering A Short Position around Trendline Of The

Lingrid | EURCAD long OPPORTUNITY in Consolidation ZoneFX:EURCAD has formed a double bottom at the intersection of the support level and upward trendline after a steep correction from the 1.57201 high. The price is consolidating just above 1.56000, showing signs of reversal as it tries to reclaim the bullish structure. A confirmed breakout above minor

05.06.25 Morning ForecastPairs on Watch -
FX:AUDUSD
OANDA:XPTUSD
A short overview of the instruments I am looking at for today, multi-timeframe analysis down to what I will be looking at for an entry. Enjoy!

EURAUD - Bearish... but not for long!Hello TradingView Family / Fellow Traders. This is Richard, also known as theSignalyst.
As per our last EURAUD analysis, attached on the chart, it rejected the upper bound of the blue channel and traded lower.
What's next?
📈EURAUD is now retesting the lower bound of the channel.
Moreover, the

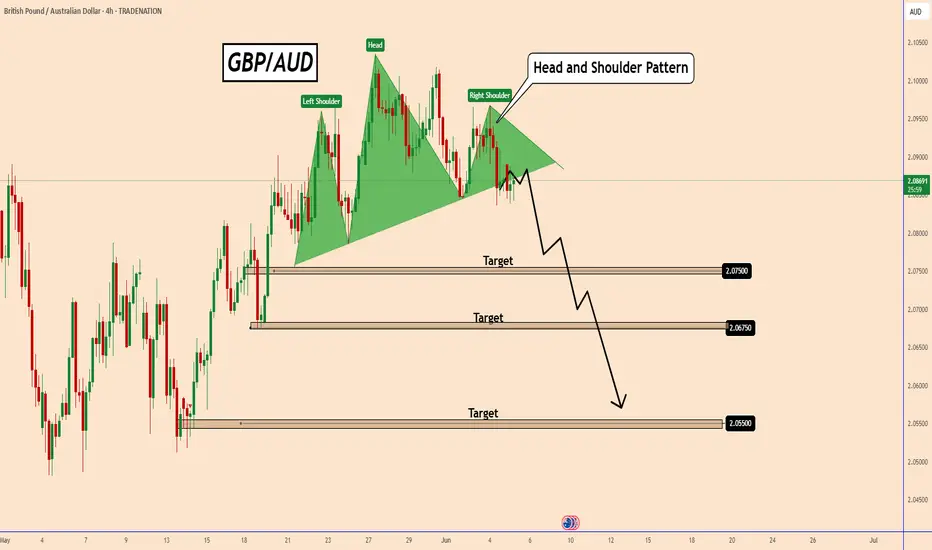
GBPAUD: Potential Head and Shoulders PatternGBPAUD: Potential Head and Shoulders Pattern
GBPAUD is showing a possible Head and Shoulders pattern on the 4-hour timeframe. The pattern suggests a possible trend reversal and a decline in GBP.
The pattern is almost complete, but this week has very low volume and could develop further.
Once the
GBPUSD reaches resistance zone: Watching for potential reversalOANDA:GBPJPY has reached a pretty significant resistance level, that has been an obvious turning point in the past, with several strong reversals from the area. So naturally, I’m watching to see how price reacts here again.
If we get confirmation of rejection (what I usually watch for: like a bear

See all forex ideas
| EUR | USD | GBP | JPY | CHF | AUD | CAD | ||
|---|---|---|---|---|---|---|---|---|
| EUR | - | - | - | - | - | - | - | |
| USD | - | - | - | - | - | - | - | |
| GBP | - | - | - | - | - | - | - | |
| JPY | - | - | - | - | - | - | - | |
| CHF | - | - | - | - | - | - | - | |
| AUD | - | - | - | - | - | - | - | |
| CNY | - | - | - | - | - | - | - | |
| CAD | - | - | - | - | - | - | - |
News didn't load
Looks like that didn't go very well. Let's try again.
Trade directly on the supercharts through our supported, fully-verified and user-reviewed brokers.


