Traders,
We are now entering a critical phase in Bitcoin price action. The next few day or two will determine the following weeks ahead of potential bullish upside or more downside.
Here are the fundamental catalysts that I've been following that are particularly interesting when looking at current price action:
1. FBI recently seized 1Brokers domain for allowing US citizens to trade on their website
2. Bitmex and Bitfinex are under the crosshairs of the US regulators as well as CFTC
3. Justin Sun (Tron founder) was recently grounded in China for his illegal fund raising debacle
4. The recent Facebook Libra and US Senate hearings have now put BTC and crypto in the spotlight of regulators
With all this in mind, price will often precede news because there are always going to be insiders, professionals, and smart money moving the market before the news comes to the ears of average retailers. So all this news is what we're seeing being priced in finally. Where that stops or reverses is hard to determine because time is never something that a technician like myself can predict. However, we can gauge what levels price could stop, reverse, keep moving etc.
BTC Analysis
---------------
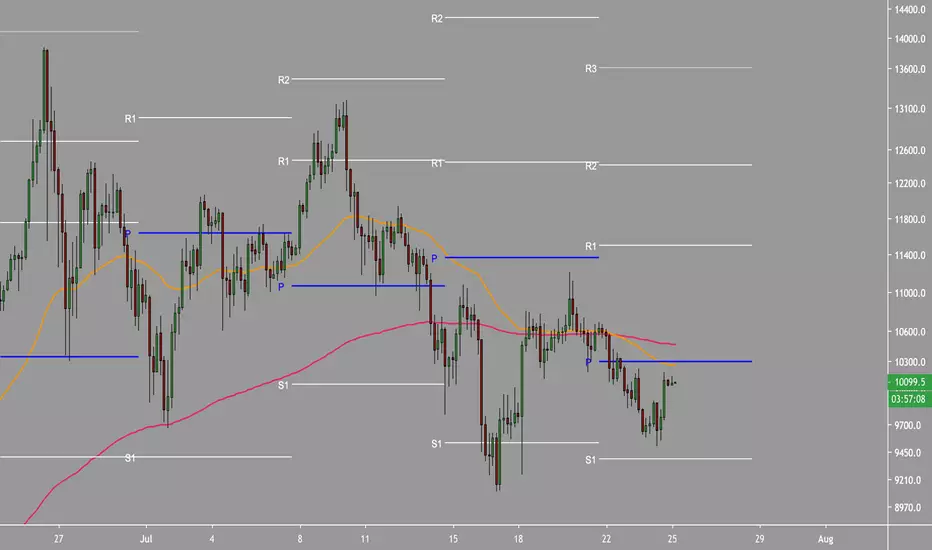
4h BTC Analysis:
1. The 50/200EMA (gold and red) show they have crossed bearishly and price is now floating under the 4h pivot
2. At the very least, as per the 4h chart, you want to wait above the $10600 level on 2-3 consecutive 4h candles to have price show strength
3. If price climbs up to the $10300 level with weak volume, you could potentially short with a stop above $10650 and potential target back to $9600 and then $9100
Not investment advice
We are now entering a critical phase in Bitcoin price action. The next few day or two will determine the following weeks ahead of potential bullish upside or more downside.
Here are the fundamental catalysts that I've been following that are particularly interesting when looking at current price action:
1. FBI recently seized 1Brokers domain for allowing US citizens to trade on their website
2. Bitmex and Bitfinex are under the crosshairs of the US regulators as well as CFTC
3. Justin Sun (Tron founder) was recently grounded in China for his illegal fund raising debacle
4. The recent Facebook Libra and US Senate hearings have now put BTC and crypto in the spotlight of regulators
With all this in mind, price will often precede news because there are always going to be insiders, professionals, and smart money moving the market before the news comes to the ears of average retailers. So all this news is what we're seeing being priced in finally. Where that stops or reverses is hard to determine because time is never something that a technician like myself can predict. However, we can gauge what levels price could stop, reverse, keep moving etc.
BTC Analysis
---------------
4h BTC Analysis:
1. The 50/200EMA (gold and red) show they have crossed bearishly and price is now floating under the 4h pivot
2. At the very least, as per the 4h chart, you want to wait above the $10600 level on 2-3 consecutive 4h candles to have price show strength
3. If price climbs up to the $10300 level with weak volume, you could potentially short with a stop above $10650 and potential target back to $9600 and then $9100
Not investment advice
Note
1d BTC Analysis:
1. The daily 21/30EMA (black and white) as well as pivot somewhat coordinate with price levels on the 4h - approx. $10600-$10700
2. Price climbing above this on at least 2 consecutive daily candles will ensure there is now strength and momentum coming in to push price up further
3. If price gets rejected by the 50MA (blue), look for the 100MA to be the next landing spot over the coming week or two
Note
Not a positive sign that both LTC and ETH are showing weakness by going back to their strong trend lines since the beginning of 2019 and either hovering right on it or getting rejected by the trend line
Note
This BTC chart is the master chart that is determining the movement of the entire market, esp. the LTC and ETH charts shown above. Notice how the critical trend line that held us up for months rejected price last week and price is unable to climb above the trend line.
I fully understand that trend lines can be recreated at different angles but a rejection at the exact point like that is not a coincidence it's marking a momentum shift.
Note
The weekly chart shows that we have not determined any direction in price. We are still under the $11600 marker and above the $9600 marker. In terms of weekly chart, this is no man's/woman's land. I'd say the safest spot to get in is above closing of $11600 or to short would be a close below $9600 closing. Until then, remaining flat on your positions would be wise unless you're scalping.
Note
Actionable items:1. Wait patiently and don't make a move
2. Long from $101XX to $103XX for scalps
3. Short from $103XX or $104XX down to $9600 or $9100 or lower
4. Wait for weekly close on Sunday 12AM UTC
5. Wait for multiple 4h or daily closings above $10800 at least* and then long toward $11600 and if that breaks then long to $13k
Not investment advice
Note
BTC Analysis July 26---------
On the 4h chart we see to be creating a higher low from the $9100 low we put in last week. However, aside from the purple $9625 marker there is nothing that will hold price up if it falls through that level. If it does break then we'll have the $9100 level to fall to.
Note
Price seems to also be creating what seems like a symmetrical triangle which is contracting price and volume.
And that same 4h line if we stretch it back looks to go back all the way into middle of May to create a nice trend line (white trend line) with 5 different touches.
Note
The 4h price chart shows two different patterns nearing the final push to either the downside or the upside. With so much selling that's happened over the last week, I'd presume that at the very least we'd get a slight pop up before a continuation down. Or, it could be very possible that we keep on moving up. Although, we won't be able to tell unless we have some strong closings of multiple 4h candles above the 50/200EMA (yellow and red) and the 4h pivot currently around $10250. All of which leads me to believe that even if we get a pop, it'd be wise to take a profit around the $102XX region. A stop near the $9575 to $9625 area.
Notice the 4h RSI showing us we're trying to break through descending trend line resistance. Once we break through this, we may have some room to fly toward the next resistance.
Note
Enjoy your Friday night free trade gift folks. If you listened to my previous call above. Cheers!
Note
BTC Update July 27After hitting our target we took profit yesterday and were waiting for follow through. It did not happen. Now we look to short.
Short opportunities are:
1. Wait for a retrace to $9650/97XX and short
2. Short now at $9500 toward $9100 and stop at $9800
3. Safest stop will be $10300
Join our Crypto movement with Alpha Trades
Disclaimer
The information and publications are not meant to be, and do not constitute, financial, investment, trading, or other types of advice or recommendations supplied or endorsed by TradingView. Read more in the Terms of Use.
Join our Crypto movement with Alpha Trades
Disclaimer
The information and publications are not meant to be, and do not constitute, financial, investment, trading, or other types of advice or recommendations supplied or endorsed by TradingView. Read more in the Terms of Use.