Crude Intraday MRS SystemStrategy build on the foundation of Mean Reversion Systems. Highly optimized for MCX-CrudeOil 75% Intraday and 25% Positional trades on 15 minutes Time Frame.
Bands and Channels

🌸 SaiNetra V2 (Invite Only) 🌸"Blessed by Swamy | Institutional Grade Zones | ATR SL/TP | Sai Sankalpam Official."

Multi EMA (20-200)📄 Script Description: Multi EMA (20-200)
This indicator plots 10 Exponential Moving Averages (EMAs) on the chart using a single indicator slot.
The EMAs included are based on the following periods: 20, 40, 60, 80, 100, 120, 140, 160, 180, and 200.
Each EMA is drawn with a different color to make trend structure easier to analyze at a glance.
This setup is ideal for:
Identifying dynamic support and resistance zones
Detecting trend strength and direction through EMA alignment
Spotting consolidation areas (when EMAs compress)
Building multi-timeframe strategies
Key Features:
Minimal, clean plotting
Lightweight and fast loading
Designed to save indicator slots on TradingView free or lower-tier plans
Tip:
Watch for "perfect stacking" of EMAs (all in order) to confirm strong trends, and monitor EMA compressions for potential breakout setups.
By : Joe

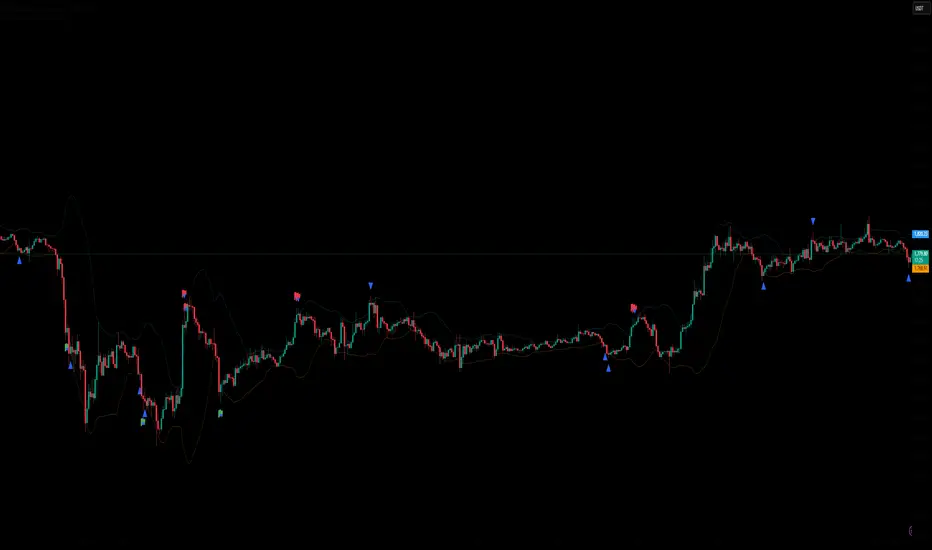
Bollinger Free BarsIdentify Extreme Price Actions with Non-Overlay Visualization
Core Functionality
This indicator detects two types of Bollinger Band breakout patterns without cluttering your chart:
1 ️⃣ Half Breakout Bar (Blue Triangles)
- Triggers when both open & close prices are outside the Bollinger Bands
- Suggests strong directional momentum continuation
2 ️⃣ Complete Breakout Bar (Red Flags)
- Activates when entire price action (including wicks) stays outside the bands
- Signals extreme volatility exhaustion points
Feature Highlights
◾ Smart Band Display
Translucent bands (#2196F3 & #FF9800 with 70% transparency) maintain chart clarity while showing dynamic volatility ranges
◾ Parameter Customization
- Adjustable period (default 20) & deviation multiplier (default 2.0)
- Selectable price source (close/open/high/low)
◾ Statistical Validation
Based on Bollinger Band's 95.4% price containment principle, signals filter out 4.6% extreme market conditions for high-probability scenarios.
Recommended Usage
1. Combine with volume analysis (significant breakout with high volume increases signal reliability)
2. Confirm with trend lines or RSI divergence
3. Adjust transparency via "Style" tab for multi-indicator layouts
Code Safety
- No repainting: All calculations use historical price data only
- No external network requests
- Open-source logic compliant with Pine Script v6 standards
Disclaimer
This tool is for technical analysis education only. Past performance doesn't guarantee future results. Always validate signals with fundamental analysis and proper risk management.
Relative Strength IndexRSI script that indicates whenever there is a crossover with RSI and the rsi ma

RSI Divergence pro with Bollinger Band Full Control📜 Indicator: RSI Divergence Pro with Full Bollinger Band Control
✨ Main Features:
RSI Divergence Detection:
Regular Bullish and Bearish Divergences
Hidden Bullish and Bearish Divergences
Configurable lookback ranges
Moving Averages on RSI:
Simple Moving Average (SMA 9)
Weighted Moving Average (WMA 45)
Each can be enabled/disabled individually, with customizable colors
Full Bollinger Band Integration:
Bollinger Bands based on RSI, not price!
Adjustable BB Length and Standard Deviation multiplier
Turn on/off each band separately:
Upper Band
Basis (Middle Line)
Lower Band
Custom colors and line widths for each band
Optional fill between Upper and Lower Bands with adjustable fill color
Support/Resistance Zones:
Overbought (70) and Oversold (30) levels are drawn and filled lightly
Alert Conditions:
Bullish Divergence
Hidden Bullish Divergence
Bearish Divergence
Hidden Bearish Divergence
⚙️ Settings Overview:
Setting Group Options
RSI Settings RSI Length, Source, Color
Moving Averages Show/Hide MA9 and WMA45, Lengths, Colors
Bollinger Bands Show/Hide BB, Length, StdDev Multiplier, Line Color, Line Width
Bollinger Band Control Individually toggle Upper, Basis, Lower bands, Fill color option
Divergence Settings Configure lookback left/right, range limits, and which divergences to show
Alerts 4 types of divergences trigger alerts
📈 Visualization:
Blue Line → RSI
Orange Line → MA9 of RSI (if enabled)
Fuchsia Line → WMA45 of RSI (if enabled)
Green, Red, and Blue Lines → Bollinger Bands overlaid on RSI
Green/Red Labels → Divergence Points
Blue Highlighted Zone → Between Overbought/Oversold levels
🚀 Special Highlights:
You can completely control the appearance of Bollinger Bands:
(Enable only Upper/Lower/Basis individually, or hide everything if you want a clean look.)
The fill between bands gives a soft visual guide to volatility around RSI.
All settings are designed to be lightweight for fast rendering even on lower-end computers.
Highly customizable for professional trading setups or scalping strategies.

RSI Divergence pro with Bollinger Band Full ControlRSI Divergence with MA9 & WMA45
Description:
This indicator identifies both regular and hidden RSI divergences based on pivot highs and lows of the RSI. It plots:
The RSI line, along with two optional moving averages:
SMA (MA9): for smoothing short-term RSI movements.
WMA (WMA45): for broader RSI trend detection.
It visually marks divergence signals directly on the RSI pane:
Bullish Divergence → "Bull" label
Hidden Bullish Divergence → "H Bull" label
Bearish Divergence → "Bear" label
Hidden Bearish Divergence → "H Bear" label
The indicator includes the following features:
Adjustable RSI period, source, and divergence lookback settings.
Optional display of MA9 and WMA45 on the RSI.
Customizable colors for bullish, bearish, hidden divergence signals.
Overbought and oversold zones are shown at 70 and 30, with a background fill for easy visualization.
Built-in alert conditions trigger notifications when divergences are detected.
This script is useful for traders looking to anticipate trend reversals by spotting RSI divergences in combination with moving average smoothing.

BuzzScalper [Ra]BuzzScalper Indicater — Precision Scalping Tool used for my personal use to Grow Small Account with Confidence.
It is a fast-paced, easy to use, simple guiding script designed for scalpers and new traders who thrive on quick, frequent opportunities.
BuzzScalper is a easy to use, simple trading script built specifically for scalpers who want to grow small accounts methodically — with high-probability setups and confidence.
It combines price action, momentum tracking, and volatility filtering to generate quick, low-risk trading opportunities, helping traders maximize gains while minimizing exposure.
It is ideal for those who have less time on charts, fast reactions, and clear signals to scale smaller accounts into consistent growth.
Built For:
Small account growth through quick, high-confidence trades
Scalpers working on 1m to 15m charts
Traders who want to compound returns steadily instead of gambling on long-term holds
Those looking for precise entries and exits rather than guesswork
Best Timeframes:
1m, 3m, 5m, 15m for rapid trade cycles
Why BuzzScalper?
Focuses on high-odds scalping opportunities
Minimizes unnecessary risk to protect small accounts
Helps newer or growing traders build confidence through clear, mechanical signals
Designed for discipline and fast scaling without emotional trading mistakes
Grow smarter. Trade sharper. Scale confidently.
BuzzScalper — Small Entries. Big Ambitions.

Advanced Smart Entry | TP | SL | EMA ForecastThis Pine Script indicator is called "Advanced Smart Entry | TP | SL | EMA Forecast" and it is designed to help traders set up and visualize their entry points, take profit (TP) levels, stop loss (SL) levels, and forecasted exponential moving average (EMA) levels on the chart. It combines a smart entry strategy with multiple TP levels, a stop loss, and an EMA forecast to provide an enhanced view of potential price movements.
Here’s a breakdown of the indicator’s components:
### **1. Entry Condition:**
- The indicator uses a simple moving average (SMA) crossover strategy as an example entry condition:
- **Enter Long**: The indicator looks for a crossover of a 9-period SMA over a 21-period SMA.
- When this crossover occurs, the indicator executes a "long" entry, meaning it expects price to move upwards.
### **2. Take Profit (TP) Levels:**
- **TP1, TP2, TP3**: After the entry is triggered, the indicator automatically sets three levels for taking profit:
- **TP1**: A price level based on a predefined multiplier (`riskReward1`), typically 1.05 times the entry price.
- **TP2**: A second TP level based on the `riskReward2` multiplier (e.g., 1.10 times the entry price).
- **TP3**: A third TP level based on the `riskReward3` multiplier (e.g., 1.15 times the entry price).
### **3. Stop Loss (SL):**
- **Stop Loss**: A stop loss level is automatically calculated based on a multiplier (`stopLossPct`) of the entry price. This is usually set below the entry price to limit potential losses.
- For example, if the stop loss multiplier is 0.95, the stop loss is set at 95% of the entry price.
### **4. Forecasted EMA (Exponential Moving Average):**
- **EMA Forecast**: The indicator also provides an extrapolated or forecasted EMA line, which predicts where the price could be based on the current EMA.
- **EMA Length**: The length of the EMA is customizable with an input value (`emaLength`), typically set to 50 periods.
- **Forecast Period**: The forecast period (`forecastPeriod`) determines how many bars into the future the EMA is forecasted.
- The forecasted EMA is drawn as a dashed red line, extending beyond the current price action.
- **Toggle Option**: Users can toggle whether or not they want the EMA forecast line and label to be displayed, via a simple checkbox (`showForecastEMA`).
### **5. Visualization:**
- **Entry Line**: A blue line is drawn at the entry price, extending into the future to visualize where the entry occurred.
- **Stop Loss Line**: A dashed red line is drawn at the stop loss price level, helping to quickly identify the risk associated with the trade.
- **Take Profit Lines**: Green lines are drawn at TP1, TP2, and TP3 levels to indicate the potential profit targets.
- **EMA Forecast Line**: A dashed red line is drawn to show the predicted future level of the EMA.
- **Labels**: Labels are added to the right of the chart for all key levels (entry, stop loss, TP1, TP2, TP3, and forecast EMA), displaying the actual price values.
### **Key Features:**
1. **Dynamic TP & SL Levels**: Automatically calculates and visualizes three take profit levels and a stop loss based on the entry price.
2. **EMA Forecast**: Provides an extrapolated forecast of the EMA, helping traders visualize potential future price direction.
3. **User Toggle for EMA Forecast**: A toggle input allows users to switch the EMA forecast display on or off.
4. **Multiple Visual Cues**: The indicator uses multiple lines and labels to visualize important price levels, making it easier to plan trades and manage risk.
### **How to Use It:**
- The indicator is ideal for traders who rely on moving averages for trend identification and want to set automated entry and exit points with a clear risk-to-reward ratio.
- By combining the entry strategy, multiple TP levels, and forecasted EMA, traders can gain a clearer understanding of potential price action and make more informed decisions.
- The toggle for the EMA forecast provides flexibility, allowing users to focus on either the entry/exit levels or the forecasted EMA based on their preferences.
This indicator is a comprehensive tool for managing trades, combining entry signals, multiple profit targets, a stop loss, and predictive analysis of the EMA.

alotaibi 511أنت قلت:
alotaibi 511 – مؤشر جان المتطور للتوقيت والمستويات السعرية 🔷
"alotaibi 511" هو مؤشر تداول ذكي يعتمد على نظرية W.D. Gann الشهيرة، ويجمع بين التحليل السعري والزمني لتحديد أقوى مستويات الدعم والمقاومة المستقبلية، بناءً على العلاقة الهندسية بين السعر والزمن.
ما يميز المؤشر:
✅ يعتمد على الجذر التربيعي للسعر الأساسي (قمة أو قاع)
✅ يستخدم زوايا جان الشهيرة مثل 45°، 90°، 180°، 360° (ومضاعفاتها) لحساب مستويات الصعود والهبوط
✅ يرسم مستويات السعر المستقبلية بدقة، مع ليبلات توضّح القيم
✅ يمتد بخطوط إلى الزمن الماضي (الشمال) لمتابعة التكرار الزمني
✅ يعطيك تنبيه تلقائي عند اقتراب السعر من أي مستوى
✅ يسمح لك بإظهار أو إخفاء أهداف الصعود والهبوط بضغطة زر (أيقونة سهلة الاستخدام)
طريقة الاستخدام:
اختر السعر الأساسي من قمة أو قاع مهم.
المؤشر يحسب تلقائيًا مستويات جان بناءً على هذا السعر.
تظهر الخطوط على الشارت، مع ليبلات على اليمين.
راقب تحركات السعر عند هذه المستويات:
انعكاس = فرصة دخول.
كسر = انتقال للمستوى التالي.
تابع التكرارات الزمنية لمزيد من الدقة (متى يتكرر التفاعل؟ بعد كم شمعة؟).
🔷 alotaibi 511 – Gann Advanced Indicator for Timing and Price Levels 🔷
"alotaibi 511" is a smart trading indicator based on the famous theory of W.D. Gann, combining price and time analysis to identify strong future support and resistance levels using the geometric relationship between price and time.
💡 Key Features:
✅ Based on the square root of the base price (a key high or low)
✅ Utilizes Gann’s well-known angles such as 45°, 90°, 180°, 360° (and their multiples) to calculate up and down levels
✅ Accurately plots future price levels, with labels displaying the values
✅ Extends horizontal lines into the past (left side of the chart) to track time-based reactions
✅ Auto-alerts you when the price approaches any key level
✅ Allows you to toggle on/off the display of uptrend or downtrend targets via a simple switch (icon-based)
📘 How to Use:
Choose a base price from a significant high or low on the chart.
The indicator automatically calculates Gann levels based on that price.
The levels are drawn as horizontal lines, with labels positioned to the right.
Observe price action at these levels:
Reversal = potential trade entry.
Breakthrough = next level becomes your target.
Watch for time-based repetitions to increase accuracy (e.g., how many candles between reactions).
🖊️ Signature:
The indicator was developed by alotaibi – version 511
It is designed to be flexible, clear, and easy to use for all types of traders.

alotaibi 511 alotaibi 511 – مؤشر جان المتطور للتوقيت والمستويات السعرية 🔷
"alotaibi 511" هو مؤشر تداول ذكي يعتمد على نظرية W.D. Gann الشهيرة، ويجمع بين التحليل السعري والزمني لتحديد أقوى مستويات الدعم والمقاومة المستقبلية، بناءً على العلاقة الهندسية بين السعر والزمن.
ما يميز المؤشر:
✅ يعتمد على الجذر التربيعي للسعر الأساسي (قمة أو قاع)
✅ يستخدم زوايا جان الشهيرة مثل 45°، 90°، 180°، 360° (ومضاعفاتها) لحساب مستويات الصعود والهبوط
✅ يرسم مستويات السعر المستقبلية بدقة، مع ليبلات توضّح القيم
✅ يمتد بخطوط إلى الزمن الماضي (الشمال) لمتابعة التكرار الزمني
✅ يعطيك تنبيه تلقائي عند اقتراب السعر من أي مستوى
✅ يسمح لك بإظهار أو إخفاء أهداف الصعود والهبوط بضغطة زر (أيقونة سهلة الاستخدام)
طريقة الاستخدام:
اختر السعر الأساسي من قمة أو قاع مهم.
المؤشر يحسب تلقائيًا مستويات جان بناءً على هذا السعر.
تظهر الخطوط على الشارت، مع ليبلات على اليمين.
راقب تحركات السعر عند هذه المستويات:
انعكاس = فرصة دخول.
كسر = انتقال للمستوى التالي.
تابع التكرارات الزمنية لمزيد من الدقة (متى يتكرر التفاعل؟ بعد كم شمعة؟).🔷 alotaibi 511 – Gann Advanced Indicator for Timing and Price Levels 🔷
"alotaibi 511" is a smart trading indicator based on the famous theory of W.D. Gann, combining price and time analysis to identify strong future support and resistance levels using the geometric relationship between price and time.
Key Features:
✅ Based on the square root of the base price (a key high or low)
✅ Utilizes Gann’s well-known angles such as 45°, 90°, 180°, 360° (and their multiples) to calculate up and down levels
✅ Accurately plots future price levels, with labels displaying the values
✅ Extends horizontal lines into the past (left side of the chart) to track time-based reactions
✅ Auto-alerts you when the price approaches any key level
✅ Allows you to toggle on/off the display of uptrend or downtrend targets via a simple switch (icon-based)
📘 How to Use:
Choose a base price from a significant high or low on the chart.
The indicator automatically calculates Gann levels based on that price.
The levels are drawn as horizontal lines, with labels positioned to the right.
Observe price action at these levels:
Reversal = potential trade entry.
Breakthrough = next level becomes your target.
Watch for time-based repetitions to increase accuracy (e.g., how many candles between reactions).
🖊️ Signature:
The indicator was developed by alotaibi – version 511
It is designed to be flexible, clear, and easy to use for all types of traders.

BB+RSI+MACD Strategy (TKW)]This strategy is designed for mean reversion trading during range-bound, non-trending markets.
It combines Bollinger Bands, RSI, MACD, and ADX to identify extreme price deviations and potential reversal points.
Use Specifically on 15 min timeframe.

Market Structure Confluence [AlgoAlpha]OVERVIEW
This script is called "Market Structure Confluence" and it combines classic market structure analysis with a dynamic volatility-based band system to detect shifts in trend and momentum more reliably. It tracks key swing points (higher highs, higher lows, lower highs, lower lows) to define the trend, then overlays a basis and ATR-smoothed volatility bands to catch rejection signals and highlight potential inflection points in the market.
CONCEPTS
Market structure is the foundation of price action trading, focusing on the relationship between successive highs and lows to understand trend conditions. Break of Structure (BOS) and Change of Character (CHoCH) events are important because they signal when a market might be shifting direction. This script enhances traditional structure by integrating volatility bands, which act like dynamic support/resistance zones based on ATR, allowing it to capture momentum surges and rejections beyond just structural shifts.
FEATURES
Swing Detection: It detects and labels Higher Highs (HH), Higher Lows (HL), Lower Highs (LH), and Lower Lows (LL) based on user-defined time horizons, helping traders quickly spot the trend direction.
BOS and CHoCH Lines: When a previous swing point is broken, the script automatically plots a Break of Structure (BOS) line. If the break represents a major trend reversal (a CHoCH), it is marked differently to separate simple breakouts from real trend changes.
Rejection Signals: Special arrows plot when price pierces a band and then pulls back, suggesting a potential trap move or rejection signal in the direction of the new structure.
Alerts: Built-in alerts for structure breaks, CHoCHs, swing points, rejections at bands, and trend flips make it easy to automate setups without manually watching the chart.
USAGE
Set your preferred swing detection size depending on your timeframe and trading style — smaller numbers for intraday, larger numbers for swing trading. Choose whether you want BOS/CHoCH confirmed by candle closes or by wick breaks. Use the volatility band settings to fine-tune how tightly or loosely the bands hug the price, adjusting sensitivity based on market conditions. When a BOS or CHoCH occurs, or when a rejection happens at the bands, the script will highlight it clearly and optionally trigger alerts. Watch for combinations where both structure breaks and volatility band rejections happen together — those are high-quality trade signals. This setup works best when used with basic trend filtering and higher timeframe confirmation.

KOLBASKA AIKOLBASKA AI VANGA
regression channel
Pivot Levels
FIBA
Price Movement Prediction
TNX DIONIS

Gelişmiş Stochastic-RSI Kesişmesi ve Trend Filtresitüm paritelerde çalışacak al sat stratejisi terste kolay kolasay kalmıyor

RSI mit Kauf- und VerkaufssignalenRSI calculation: The RSI is calculated over a period of 14 periods (default value).
Buy signal (longSignal): A buy signal is generated when the RSI rises from below 30 above 30 (oversold area).
Sell signal (short signal): A sell signal is generated when the RSI falls below 70 from above 70 (overbought area).
Graphical representation: The buy and sell signals are displayed as symbols on the candles. The RSI is plotted at the bottom of the chart.

TDI - Traders Dynamic Index [Goldminds] - Signals on Chartthis indicator is based off of the tdi. signal triggers once there is a 1 minute shift or bos after a higher time frame tdi hook or break of bands. just follow higher time frame order flow. i only use this for gold

TDI - Traders Dynamic Index [Goldminds] - Signals on Chartthis indicator is just based off of tdi and inducement. anytime there is a 1min choch after a tdi hook an alert will trigger. just follow higher time frame order flow and only take signals that are inside previous range

Custom Green Candle Conditionthis indicator based candle and ema combination .............................................................................................................................................................................................................................................................................................................................

EMA 20/50/200 IndicatorIt shows you EMA20, EMA50 and EMA200 as lines in the chart.
In addition, it shows you intersections of EMA20 and EMA50 with an arrow (optional).

Sinyal Çekici :) 🎯 DESCRIPTION:
A simple and effective strategy that allows you to send signals from different indicators to external platforms via webhook notifications. Compatible with Long and Short positions, you can manage your trades with customizable lot sizes.
⚙️ USAGE:
1. Enter your API Key and Token information
2. Set your desired lot amount
3. Enable dual-direction trading based on your preference
4. Select your signal sources
🔔 FEATURES:
• Webhook integration
• Long/Short position support
• Visual position indicators
• Customizable lot size
• Real-time notifications
⚠️ DISCLAIMER:
This strategy does not constitute investment advice. It is recommended to apply your own risk analysis and management in all your investment decisions.

Japanese Candles PremiumConfiguration Inputs:
Enable/Disable BUY
Enable/Disable SELL
Enable/Disable Take Profit / Stop Loss
Choose Take Profit / Stop Loss %
Trading Logic:
For each signal, simulate entry (and exit with TP/SL)
Count winning/losing trades
Display Profit Factor, Total Trades, etc.
Enhanced Alerts:
Only if specific conditions are met as configured.
Results Panel:
You will see a small panel with automatic statistics.

Custom EMAs (6, 14, 32 Low/High)This script plots four customized EMAs:
EMA 6 (close) in white
EMA 32 (low) in green
EMA 32 (high) in green
EMA 14 (close) in blue
Useful for detecting volatility envelopes, fast momentum shifts, and trend confirmations.
by Joe
