BullTrading Easy Tops & Bottoms / Community Edition🚀 BullTrading Easy Tops & Bottoms – Community Edition
🎁 100% FREE – Yours Forever | From Trader to Trader
After 10 years of chart obsession, late-night testing, and real market grinding... I’m finally releasing my most reliable scalping tool – FREE for every trader who refuses to quit.
Introducing: BullTrading Easy Tops & Bottoms – Community Edition – a battle-tested, no-nonsense indicator designed to pinpoint high-probability reversal zones on the 5-minute chart.
No subscriptions. No premium upgrades. No BS. Just pure edge, given back to the community that helped me survive the chaos of trading.
🔥 What Makes It Different?
🟩 Green Zones = Strong BUY Signals at Local Bottoms
🟥 Red Zones = Strong SELL Signals at Local Tops
🔳 Visual Boxes show EXACT entry areas – easy to spot, easy to act
💯 No Repainting.
What you see is what you trade.
⚡ Tailored for Speed:
* Perfect for 5-minute scalping
* Built for Forex, Crypto, Stocks, Indices
* Works on any broker, no complex setup
* Instant zone detection – no guesswork
* Display exact proportions for Stop & Reverse Entries SSR!!
📊 Pro-Level Intelligence:
* Historical Zone Memory for backtesting & learning
* Automatic Zone Expiration when levels break
* Multi-session optimised (Asian, London, NY)
* Clean interface = Maximum focus
🎮 How to Use It:
1. Add it to your 5-minute chart
2. Wait for a zone to appear, then wait for the signal
3. Enter when price taps the zone boundary
4. Manage your trade based on your preferred R:R
✅ Done.
🧠 Why I’m Giving This Away for Free:
Because I know what it feels like to burn money on overpriced tools that overpromise and underdeliver.
Because I found something that works for me – and I want it to work for you too.
Because real success should be shared, not sold.
This is my way of giving back.
This is our Community Edition – powered by traders, for traders.
🔥 THE CHALLENGE:
If this tool helps you grow your account, land cleaner entries, or find more confidence in your strategy or fund yourself with a prop firm.…
I dare you to share it.
💬 Drop your wins, screenshots, and stories in the comments.
📢 Let’s build a feed full of real results from real traders.
That’s all I ask in return for a tool that could change your game.
⚙️ Quick Settings Overview:
* Show Signals: Enable/disable zones
* Signal Duration: Set how long zones stay active (default: 288 bars)
* Historical Days: Load past zones for testing (default: 7)
💬 Support & Community:
This is a community-powered release. That means no private support, but the comment section is your home base.
✅ Ask questions
✅ Share tips
✅ Show off your setups
We’re in this together.
🔁 Ongoing Updates:
I’ll keep improving this based on community feedback. So keep sharing, testing, and suggesting.
🌟 Final Thoughts:
This is not a “get rich quick” hack and still needs further refinement.
But it is a powerful tool built from real experience. It won’t trade for you – but it will help you see cleaner opportunities if you use it with discipline.
If you love it:
⭐ Add to your favourite Indicators
💬 Post your wins below
🔄 Share with a trader who needs a real edge
Let’s flip the odds in our favor.
Let’s dominate the charts.
Let’s do it together. 💪
#topsandbottoms #tradingcommunity #5minutetrader #scalpingedge #forex #crypto #stocks #traderlife #freeindicator #bulltrading
📜 Legal Disclaimer – BullTrading Easy Tops & Bottoms – Community Edition
The BullTrading Easy Tops & Bottoms – Community Edition indicator is provided for educational and informational purposes only. It is not intended as financial, investment, or trading advice, and does not constitute a recommendation to buy, sell, or hold any financial instrument.
Trading financial markets involves substantial risk. Past performance of any trading strategy or indicator is not indicative of future results. Users of this indicator assume full responsibility for their trading decisions. No guarantees are made regarding the accuracy, reliability, or profitability of the signals generated by this tool.
This indicator is offered 100% free and as-is, without any express or implied warranties. The creator, Akuma Epic Studios FZCO, and BullTrading Asset Management SAPI de CV shall not be held liable for any losses or damages, direct or indirect, arising from the use, misuse, or reliance on this tool.
All trading decisions should be made with consideration of your financial situation and risk tolerance. Consultation with a licensed financial advisor is strongly recommended before making any investment decisions.
By using this indicator, you acknowledge and agree to these terms. Your use constitutes acceptance of full responsibility and the understanding that trading is inherently risky and should be approached with caution and discipline.
Chart patterns

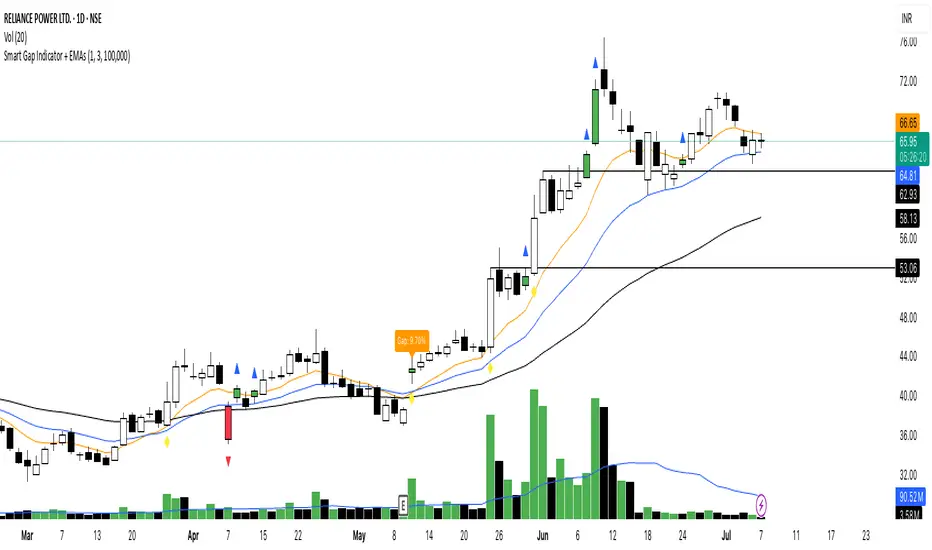
Smart Gap Indicator + EMAs📈 Smart Gap Indicator + EMAs
Spot high-impact gaps with precision and confidence.
🔍 What it does:
This tool identifies and highlights strategic price gaps that often precede strong directional moves. It filters out noise by combining advanced logic with volume activity and trend bias, helping you focus on the most relevant setups.
📊 Key Features:
Smart Gap Detection – Automatically detects meaningful gap up/down events based on dynamic thresholds.
EMA Trend Filter – Optional multi-EMA filter (10, 21, 50) to help align trades with the prevailing market trend.
Volume Spike Signal – Highlights volume surges that may indicate institutional involvement.
Clean Visuals – Configurable labels, shapes, and optional gap fill lines to aid quick interpretation.
Gap Performance Table – Summarizes recent gap activity to assess directional bias.
⚠️ Built-in Alerts:
Gap Up
Gap Down
Gap + Volume Spike
💡 Made by a trader, for traders.
Whether you're a swing trader, gap hunter, or momentum follower—this tool was crafted to give you an edge where it matters most: timing.
Impulse & Terminal Detector [DEV]I am studying Elliott Waves,
and I am verifying the knowledge I have learned by applying it to indicators.
This may be right or wrong, but I think people studying Elliott Waves will find it fun to use this indicator together and see how it interacts with my learning, so I am sharing the indicator.
1. There is a blind spot in that it is pivot-based. This needs more research.
So the shape found varies depending on the length of the pivot.
2. A triangle indicates a normal impulse, and a diamond indicates a terminal.
We often confuse them, and the book tells us to distinguish between them.

Moving Average Convergence Divergence//@version=5
indicator(title="Moving Average Convergence Divergence", shorttitle="MACD", timeframe="", timeframe_gaps=true)
// Getting inputs
fast_length = input(title = "Fast Length", defval = 12)
slow_length = input(title = "Slow Length", defval = 26)
src = input(title = "Source", defval = close)
signal_length = input.int(title = "Signal Smoothing", minval = 1, maxval = 50, defval = 9)
sma_source = input.string(title = "Oscillator MA Type", defval = "EMA", options = )
sma_signal = input.string(title = "Signal Line MA Type", defval = "EMA", options = )
// Calculating
fast_ma = sma_source == "SMA" ? ta.sma(src, fast_length) : ta.ema(src, fast_length)
slow_ma = sma_source == "SMA" ? ta.sma(src, slow_length) : ta.ema(src, slow_length)
macd = fast_ma - slow_ma
signal = sma_signal == "SMA" ? ta.sma(macd, signal_length) : ta.ema(macd, signal_length)
hist = macd - signal
alertcondition(hist >= 0 and hist < 0, title = 'Rising to falling', message = 'The MACD histogram switched from a rising to falling state')
alertcondition(hist <= 0 and hist > 0, title = 'Falling to rising', message = 'The MACD histogram switched from a falling to rising state')
hline(0, "Zero Line", color = color.new(#787B86, 50))
plot(hist, title = "Histogram", style = plot.style_columns, color = (hist >= 0 ? (hist < hist ? #26A69A : #B2DFDB) : (hist < hist ? #FFCDD2 : #FF5252)))
plot(macd, title = "MACD", color = #2962FF)
plot(signal, title = "Signal", color = #FF6D00)

多周期共振策略 PRO · Multi-Timeframe Resonance v1.6🇬🇧 English
🚀 Multi-Timeframe Resonance System – Spot Strong Rallies & Reversal Zones At a Glance!
✨ Licensed & Exclusive · Official Version Only · Long-Term Subscription / Licensed Distribution Supported
📌 Highlights
🔹 Multi-Timeframe Resonance Detection
Analyze multiple timeframes simultaneously. Auto-tag trend phases and consolidation zones—quickly identify entries and exits. Supports M‑Top / W‑Bottom / consolidation breakouts / trend reversals.
🔹 Clarity in Trend vs Ranging
Visually highlight trend expansion (green = bullish) and range zones (red = bearish), no need to switch timeframes manually.
🔹 Perfect for All Asset Classes
Stock / ETF, Futures / Commodities, FX / Gold, Crypto—just tweak parameters to match any market rhythm.
🧠 Ideal For
✅ Traders who need quick structural insights from complex charts
✅ Trend followers, swing traders, range breakout players
✅ Multi-timeframe aficionados and order-flow researchers
✅ Quant teams & strategy developers requiring reliable signals
🔒 How to Use
Licensed version only—contact me for trial or purchase. Once activated, your account is bound, settings are saved forever—no reconfiguring.
🛠️ Exclusive Support For Licensees
• Parameter optimization per asset class
• Strategy updates & alerts
• Access to VIP strategy research group
📩 Contact now to start your quantitative trading journey!
Send a DM or comment on TradingView for license details.
🇨🇳 中文
🚀 多周期共振识别系统 —— 强势震荡与拐点,一目了然!
✨ 授权专用 · 唯一正版 · 支持长期订阅 / 授权分发
📌 核心优势 Highlights
🔹 多周期共振识别
同时分析多个周期,智能标注趋势方向与震荡区间,帮你迅速判断进退时机,支持识别 M 顶 / W 底 / 震荡拐点 / 多空趋势切换。
🔹 震荡 / 趋势 一目了然
自动高亮“趋势推进期”与“震荡盘整区”,绿色代表底部,多头关注;红色代表顶部,空头防守。
🔹 适用于所有金融产品
股票 / ETF、期货 / 商品、外汇 / 黄金、加密货币(Crypto),微调参数即可适配各市场“节奏感”。
🧠 适用人群
✅ 需要速辨图表结构的交易者
✅ 擅长趋势跟随、波段捕捉、震荡套利的投资者
✅ 多周期分析爱好者、主力行为研究者
✅ 需要稳定策略输出的量化团队 / 策略研发者
🔒 使用方式
本指标为受控授权版本,先联系作者获取试用 / 购买权限。绑定账号后,无需重复设置,永久保存参数。
🛠️ 授权用户专享支持
• 参数优化建议(针对不同市场)
• 策略更新同步推送
• VIP 策略研究交流群
📩 立即联系作者,开启量化交易新维度!
在 TradingView 上私信或留言,获取授权与使用说明。
🇯🇵 日本語
🚀 マルチタイムフレーム共振システム ― トレンド&レンジを一目で把握!
✨ ライセンス制・公式正規版・長期購読/ライセンス配布対応
📌 特徴
🔹 マルチタイムフレーム共振検出
複数の時間軸を同時分析し、トレンドとレンジゾーンを自動マーキング。Mトップ/Wボトム/レンジブレイク/トレンド転換を即判断。
🔹 トレンドとレンジの視認性向上
トレンド加速期は緑、レンジは赤で強調表示。タイムフレームの切り替え不要。
🔹 すべての金融商品に対応
株/ETF、先物/商品、FX/ゴールド、暗号資産(Crypto)に対応し、市場ごとの「リズム」に合わせた微調整のみで利用可能。
🧠 こんな方におすすめ
✅ 複雑なチャートから構造を素早く把握したいトレーダー
✅ トレンドフォロー、スイング、レンジブレイク手法採用者
✅ マルチタイムフレーム分析やオーダーフローに関心のある方
✅ 安定信号を求めるクオンツチーム/戦略開発者
🔒 利用方法
ライセンス制のみ:試用/購入は作者に直接お問い合わせください。認証アカウントには永続的にパラメータが保存されます。
🛠️ ライセンス者限定サポート
• 資産別パラメーター最適化アドバイス
• 継続的な戦略アップデート配信
• VIP研究グループ参加権
📩 今すぐ連絡して、量的トレードの新次元へ!
TradingViewでDMまたはコメントを送信して下さい。
🇫🇷 Français

[sunkasco] 뚬치딱치In true TradingView spirit, the author has published this Pine code as an open-source library so that other Pine programmers from our community can reuse it. Cheers to the author! You may use this library privately or in other open-source publications, but reuse of this code in publications is governed by House Rules.

SignalScope PROOverview: (Nothing mentioned here is financial advice)
What is the difference between the free Signal Scope and the Pro Version? Answer- Signal Scope Pro includes live divergences that have been rigorously backtested with exceptional results.
Signal Scope Pro includes Divergences based off a proprietary oscillator. They are not based upon SMT or any other existing oscillator.
The Algorithm features candles we refer to as "Bullish" & "Bearish" imbalance candles.
Bullish Imbalance candle= Fully colored Blue and Green Candles
Bearish Imbalance candle= Fully colored Red and Purple Candles
Stats On Bullish Imbalance candles:
Daily Chart- Since 2021 there have been 9 bullish imbalance candles. 8/9 on the daily time frame for continued upside after a Bullish Imbalance Candle populates. This gives us a 88.8% chance of near term upside in the following days after these candles show on the chart.
Since January 1st 2025, there have been 27, 30 minute bullish imbalance candles. 21 have resulted in Short Term Upside, 6 failed and went to the downside. This gives us a 77.78% odds that a bullish imbalance candle will result in short term upside with a look-back period over the last 5 months.
Since January 1st 2025, there have been 95, 15 minute bullish imbalance candles. 69 have resulted in Short Term Upside, 26 failed and went to the downside. This gives us a 72.63% odds that a bullish imbalance candle will result in short term upside with a look-back period over the last 5 months.
Since January 1st 2025, there have been 193 5 minute bullish imbalance candles. 135 have resulted in Short Term Upside, 58 failed and went to the downside. This gives us a 69.95% odds that a bullish imbalance candle will result in short term upside with a look-back period over the last 5 months.
What can we take from the data above? The higher the time frame, the more favorable the results become.
BUY/ SELL SIGNALS (green triangles=buy, red triangles=sell)
The highlight of the algo is the bull/ bear imbalance candles along with the live divergences.

Babanov_DOTUSDT V2🧪 Deep Backtest Results (DOT 5-Min Strategy)
Backtest conducted on DOTUSDT.P (Bybit) using a 5-minute chart timeframe over several weeks of data.
! imgur.com
⚠️ Важно: Инструкции за правилна употреба на скрипта!
Ако искате да използвате този скрипт с webhook alerts за автоматична търговия, моля, обърнете внимание на следните стъпки:
✅ 1. Активирайте "Live Trading Mode"
Преди да създадете какъвто и да е alert, отидете в таба "Inputs" и задължително активирайте опцията "Live Trading Mode". Без нея скриптът няма да изпраща правилни сигнали.
✅ 2. Въведете търговската сума в USD
В таба "Properties", въведете сумата в USD, която ботът ще използва за търговия с DOT.
- Препоръчително е сумата да бъде такава, която може да бъде разделена на 50 (например 50, 100, 150, 200 и т.н.), за да се гарантира коректно управление на позициите и обемите при търговия.
✅ 3. Препоръчителна платформа: Bybit - BYBIT:DOTUSDT.P
Скриптът е оптимизиран и тестван за търговия на Bybit. Използването му на други платформи може да доведе до различни резултати, тъй като графиките и ценовите движения може да се различават.
-----------------------------------------------------------------------------------------------
⚠️ Important: Instructions for Proper Use of This Script
If you want to use this script with webhook alerts for automated trading, please follow the steps below carefully:
✅ 1. Enable "Live Trading Mode"
Before creating any alerts, go to the "Inputs" tab and make sure to enable the "Live Trading Mode" option.
Without it, the script will not generate correct trading signals.
✅ 2. Enter Your Trading Amount in USD
In the "Properties" tab, enter the amount in USD that the bot will use for DOT trading.
It is strongly recommended to enter an amount that can be divided by 50 (e.g., 50, 100, 150, 200, etc.) to ensure proper position sizing and trade management.
✅ 3. Recommended Exchange: Bybit - BYBIT:DOTUSDT.P
The script is optimized and tested specifically for Bybit.
Using it on other exchanges may result in different outcomes due to variations in chart data and price movements.

Babanov_XRPUSDT V2🧪 Deep Backtest Results (XRP 5-Min Strategy)
Backtest conducted on XRPUSDT.P (Bybit) using a 5-minute chart timeframe over several weeks of data.
! imgur.com
⚠️ Важно: Инструкции за правилна употреба на скрипта!
Ако искате да използвате този скрипт с webhook alerts за автоматична търговия, моля, обърнете внимание на следните стъпки:
✅ 1. Активирайте "Live Trading Mode"
Преди да създадете какъвто и да е alert, отидете в таба "Inputs" и задължително активирайте опцията "Live Trading Mode". Без нея скриптът няма да изпраща правилни сигнали.
✅ 2. Въведете търговската сума в USD
В таба "Properties", въведете сумата в USD, която ботът ще използва за търговия с XRP.
- Препоръчително е сумата да бъде такава, която може да бъде разделена на 50 (например 50, 100, 150, 200 и т.н.), за да се гарантира коректно управление на позициите и обемите при търговия.
✅ 3. Препоръчителна платформа: Bybit - BYBIT:XRPUSDT.P
Скриптът е оптимизиран и тестван за търговия на Bybit. Използването му на други платформи може да доведе до различни резултати, тъй като графиките и ценовите движения може да се различават.
-----------------------------------------------------------------------------------------------
⚠️ Important: Instructions for Proper Use of This Script
If you want to use this script with webhook alerts for automated trading, please follow the steps below carefully:
✅ 1. Enable "Live Trading Mode"
Before creating any alerts, go to the "Inputs" tab and make sure to enable the "Live Trading Mode" option.
Without it, the script will not generate correct trading signals.
✅ 2. Enter Your Trading Amount in USD
In the "Properties" tab, enter the amount in USD that the bot will use for XRP trading.
It is strongly recommended to enter an amount that can be divided by 50 (e.g., 50, 100, 150, 200, etc.) to ensure proper position sizing and trade management.
✅ 3. Recommended Exchange: Bybit - BYBIT:XRPUSDT.P
The script is optimized and tested specifically for Bybit.
Using it on other exchanges may result in different outcomes due to variations in chart data and price movements.

Short ChecklistHave created my personal checklist for short setups. This helps me avoid reversals and enter POC correctly on support and ressistance levels. Mostly, I use daily bars.

PD RTH Range+ [JJumbo]PD RTH Range+
The PD RTH Range+ indicator is a powerful tool designed to visualize and track Regular Trading Hours (RTH) ranges for financial markets. This indicator identifies and plots key price levels established during standard US trading hours (9:30 AM - 4:15 PM ET), helping traders identify important key levels and fair value zones.
Key Features:
- Marks RTH high and low boundaries with customizable lines
- Calculates and displays the equilibrium (EQ) level between RTH high and low
- Identifies the first Fair Value Gap (FVG) that forms during the session
- Projects potential extensions of the daily range
- Visually distinguishes RTH candles from overnight price action
- Offers extensive customization options for colors, line styles, and label sizes
- Dynamic Premium&Discount box
- custom/Fixed Projection modes
This indicator is particularly valuable for traders who focus on institutional activity during regular market hours, helping them identify key reference points for potential reversals, continuations, By tracking these critical levels, traders can make more informed decisions about entry and exit points while maintaining awareness of important price structures from the previous session.

SDRange+ [JJumbo]Dynamic SDRange+
versatile and highly customizable tool crafted for traders who rely on precise price levels and Time-based analysis, with a special focus on the Overnight Session (ONS) range.
This indicator defaults to capturing the critical 6:00 AM to 9:00 AM Eastern Time (America/New_York timezone) ONS window—a period often pivotal for setting the day's momentum and key price zones before regular trading hours (RTH) commence. However, its standout feature is the ability to define a custom session window, allowing traders to adapt the range to any preferred time period, making it suitable for various trading styles and market conditions beyond the standard ONS.
At its core, the indicator plots the high, low, and equilibrium (EQ) levels of the selected session, with the default 6:00-9:00 AM range highlighted by solid high/low lines, a distinct EQ, and optional quadrant lines at 25% and 75%. This provides a clear snapshot of the session’s structure. Traders can further enhance their analysis with customizable projections and mean reversion levels, extending above and below the range to pinpoint potential reversal or continuation zones. The custom session selection empowers users to shift focus—whether to an earlier overnight window, a midday consolidation period, or any other timeframe—offering unparalleled flexibility.
In addition to its adaptable range functionality, SDRange+ offers a suite of optional features:
- Pivot Sessions: Two configurable pivot windows to track supplementary overnight liquidity levels.
- Projections: Extensions and mean reversion zones, adjustable for upper, lower, or both directions.
- Visual Customization: Options to display open/close lines, tweak line styles, colors, and label sizes, and toggle a table showing the range size.
- RTH Candle Coloring: Distinguishes overnight from regular session candles for improved visual clarity.
Designed for traders who demand precision and adaptability, SDRange+ excels in strategies leveraging pre-market or custom session price action, such as range breakouts, reversals, or trend continuations. Whether you’re analyzing the default 6:00-9:00 AM ONS range for early momentum or tailoring the session to your unique trading approach, this indicator delivers a robust and dynamic framework for technical analysis across any market.

Relative Performance Trend ReversalYour Edge in Pair Trading & Trend Reversals
Stop guessing market direction. The RPT Reversal Indicator for TradingView identifies high-probability trend reversals and arbitrage opportunities by analyzing the relative performance between any two assets. Trade with a quantifiable edge.
Core Features
*Dynamic Trend Analysis: Automatically paints your chart background green for outperformance and red for underperformance.
*High-Conviction Reversal Signals: Precise, non-repainting arrows give you clear entry signals for pair trades.
*Built-in Visual Backtesting: Instantly see the historical Pair Performance % and Max Drawdown for every signal, providing full transparency.
*Smart Symbol Selection: Automatically suggests a relevant benchmark (like SPY or DXY) but gives you full flexibility to compare any two assets.
Proven Performance: A Case Study
Results matter. Here's a performance breakdown of the indicator on Bitcoin CME Futures (BTC1!) from Sep 2023 to Jul 2025 (trading the pair vs CME_MINI:ES1! equal weight).
*Win Rate
57.14%
*Average Return
+8.64%
*Sharpe Ratio
1.22
Who Is This For?
The RPT Reversal Indicator is built for systematic traders focused on:
*Pair Trading: Execute long/short strategies in stocks, forex, crypto, and commodities.
*Arbitrage: Exploit short-term pricing inefficiencies between correlated assets.
*Quantitative Modeling: Enhance your models with a powerful new data source.
Unlock Your Access Today
Gain immediate access to the RPT Reversal Indicator and start trading with a proven edge.
Ready to transform your trading?
Best of luck!
Cheers,
Ivan Labrie.

OS + Stairstep 5m5 min os plus stairstep
i need to add more to this section so I am going to type nonsense until its long enough tath i can publish it

korean Trading master binIt is a trading indicator that gives a buy signal at low points and a sell signal at high points.
저점에서 매수 시그널 고점에서 매도 시그널이 나타나는 지표입니다.
돈 많이 버세요.
If you don't find a way to make money while you sleep, you will work until you die.
Warren Buffett.

9 EMA Angle Color Indicator//@version=5
indicator("9 EMA Angle Color Indicator", overlay=true)
// === INPUTS ===
emaLength = input.int(9, title="EMA Length")
angleThreshold = input.float(20.0, title="Angle Threshold (Degrees)", minval=0.1)
lookbackBars = input.int(5, title="Bars to Calculate Angle", minval=1)
// === EMA CALCULATION ===
emaValue = ta.ema(close, emaLength)
// === ANGLE CALCULATION (in degrees) ===
// Use simple slope * 100 and arc tangent conversion to degrees
slope = (emaValue - emaValue ) / lookbackBars
angle = math.atan(slope) * (180 / math.pi)
// === COLOR LOGIC ===
var color emaColor = color.black
// Initial color: black when angle is within range
emaColor := color.black
// Price and angle-based color change
if angle > angleThreshold and close > emaValue
emaColor := color.green
else if angle < -angleThreshold and close < emaValue
emaColor := color.red
else
emaColor := color.black
// === PLOT EMA ===
plot(emaValue, color=emaColor, linewidth=2, title="9 EMA Colored")

SuperPerformance_V1.2📊 SUPER PERFORMANCE INDICATOR
A comprehensive performance analysis tool that compares your stock against selected indices and tracks sector performance across multiple timeframes.
🎯 MAIN FEATURES
✅ Stock Performance Table
• Compares stock vs index performance across 1D, 5D, 10D, 20D, 50D, 200D periods
• Shows ✓/✗ indicators for outperformance tracking
• Displays percentage gains/losses with color coding (green=positive, red=negative)
• Calculates conviction score based on outperformance across timeframes
• Provides performance difference between stock and index
✅ Sector Performance Table
• Ranks top 5 performing sectors across different timeframes
• Shows real-time sector performance with percentage changes
• Tracks 19 major Indian market sectors
• Customizable time periods (1D, 5D, 10D, 20D, 60D)
✅ Sector Display Box
• Shows current stock's sector classification
• Customizable positioning and styling
• Optional sector abbreviations
🔧 CUSTOMIZATION OPTIONS
📋 Display Settings
• Dark/Light mode toggle
• Show/hide individual tables
• Mini mode for compact view
• Index selection (default: NIFTYMIDSML400)
📊 Table Controls
• Enable/disable specific columns and rows
• Adjustable table size (tiny/small/normal/large)
• 9 positioning options for each table
• Color customization for backgrounds and text
🎨 Advanced Features
• Conviction scoring system (Perfect/Solid/Good/Ok/Weak/Poor)
• Real-time performance tracking
• Multi-timeframe analysis
• Sector rotation insights
📈 CONVICTION LEVELS
• Perfect: Outperforms in all periods
• Solid: Outperforms in 67%+ periods
• Good: Outperforms in 50%+ periods
• Ok: Outperforms in 33%+ periods
• Weak: Outperforms in some periods
• Poor: Underperforms in all periods
⚙️ HOW TO USE
1. Add indicator to your chart
2. Select comparison index in Display Settings
3. Customize visible columns/rows as needed
4. Position tables on screen
5. Analyze green ✓ (outperforming) vs red ✗ (underperforming)
6. Use conviction score for overall performance assessment
🎯 IDEAL FOR
• Relative strength analysis
• Sector rotation strategies
• Performance benchmarking
• Indian equity markets
Note: Designed specifically for NSE/Indian market analysis with pre-configured sector indices.

Super PerformanceWhat It Does
The Super Performance indicator displays two performance tables that help you analyze stock and sector performance relative to a chosen index.
Main Features
1. Stock Performance Table:
Compares your stock vs index across multiple time periods (1D, 5D, 10D, 20D, 50D, 200D)
Shows ✓ or ✗ to indicate if stock is outperforming the index
Displays conviction score (how many periods stock is beating index)
Color-coded performance (green = positive, red = negative)
Shows percentage difference between stock and index
2. Sector Performance Table
Ranks top 5 performing sectors across different timeframes
Shows sector names with their performance percentages
Helps identify which sectors are currently strongest
3. Sector Display
Shows the current stock's sector in a separate display box
Customizable position and styling
Key Settings
Display Settings
Dark/Light Mode: Toggle color themes
Show/Hide Tables: Control which tables to display
Mini Mode: Compact view with just essential info
Index Selection: Choose comparison index (default: NIFTYMIDSML400)
Column Controls
Stock Table: Period, Stock %, Index %, Outperform (✓/✗), Difference
Sector Table: Rank, 1D, 5D, 10D, 20D, 60D performance
Row Controls
Stock Table: Enable/disable specific time periods
Sector Table: Show top 1-5 sectors
Table Customization
Size: Tiny, Small, Normal, Large
Position: 9 different screen positions
Colors: Background, text, and performance colors
How to Use
Add indicator to your chart
Choose your index for comparison (in Display Settings)
Customize columns/rows you want to see
Position tables where you prefer on screen
Analyze performance:
Green ✓ = Stock outperforming index
Red ✗ = Stock underperforming index
Conviction score shows overall strength
Conviction Levels
Perfect: Outperforms in all selected periods
Solid: Outperforms in 67%+ of periods
Good: Outperforms in 50%+ of periods
Ok: Outperforms in 33%+ of periods
Weak: Outperforms in some periods
Poor: Underperforms in all periods
This indicator is ideal for relative performance analysis and sector rotation strategies in Indian markets.

The Essa System V1.5The Essa System V1.5
Overview
The Essa System is a comprehensive trading strategy and backtesting tool designed for traders who use market structure and Fibonacci retracements. It automatically identifies significant trading ranges, calculates key retracement levels, and then backtests a complete trading strategy based on entries at these levels.
This is more than just an indicator; it's a full suite of analytical tools designed to help you develop, test, and analyze a complete trading plan directly on your chart.
How It Works
The system's logic is based on a classic price action concept:
Range Detection: First, it automatically identifies a significant trading range by finding the highest high and lowest low based on pivot points over a user-defined lookback period.
Fibonacci Analysis: Once the range direction (bullish or bearish) is established, the script calculates and displays key Fibonacci retracement levels (50%, 61.8%, 70.5%, and 78.6%).
Trade Execution: The system then looks for historical and live trading opportunities, entering a trade when the price pulls back to one of the enabled Fibonacci levels. All trades are managed with a predefined Stop Loss and Take Profit in pips.
Key Features
Automatic Range & Fibonacci Analysis: Automatically draws the primary trading range and key Fib levels, updating as market structure evolves.
Historical Backtesting: Plots all historical trade entries based on the strategy rules, allowing for a complete performance review over the chosen chart history.
Detailed Trade Visuals: Displays active trades on the chart with clear lines and boxes for entry, stop loss, and take profit zones.
Advanced Session Filtering: Allows you to isolate trades to specific market sessions (London, New York, Asia) with timezone support and daily trade limits.
Built-in Risk Management: A cornerstone of the system. It automatically calculates the required position size for each trade based on your specified Account Size, Risk Percentage, and Stop Loss.
Comprehensive Performance Tables: The script includes two powerful analytical tables:
Trade Helper Table: Shows the status of live or potential upcoming trades, including entry/SL/TP prices and the calculated position size.
History Table: Logs all recent trades and calculates key statistics like Profit Factor, Win Rate, and the overall PnL impact on your account balance.
Customizable Strategy: Fine-tune every aspect of the strategy with inputs for the lookback period, SL/TP in pips, which Fib levels are tradable, and a cooldown timer to prevent over-trading.
How to Use
Add the indicator to your chart.
Navigate to the settings and, under "Account Settings," configure your Account Size and Risk Per Trade (%). This is essential for the PnL and position sizing calculations to be meaningful.
Under "Session Filter Settings," adjust the sessions you wish to trade.
Analyze the historical trades and the performance tables to understand the strategy's behaviour on your chosen asset and timeframe.
Disclaimer: This is a tool for strategy analysis and backtesting. It is not financial advice. Past performance is not indicative of future results. Always use proper risk management.

Mean Reversion Trading With IV Metrics (By MC) - Mobile FriendlyThis is a comprehensive mobile-optimized, multi-function trading indicator designed to assess mean reversion probabilities, pair correlations , and implied volatility metrics for single and paired securities. It includes a dynamic table and alert system for active trade decision support.
🔍 Key Features
📈 Mean Reversion % Probability
Calculates reversion probability based on historical deviation from mean price.
Supports both current chart timeframe and daily timeframe.
Plots signals for:
Strong Reversion (e.g., >75% probability)
Moderate Reversion
User-configurable thresholds and plot styles (line/histogram).
🔗 Pair Correlation Engine
Compares any two user-selected tickers (e.g., SPY/TLT).
Computes z-score of their price ratio.
Displays correlation coefficient and color-coded strength.
📊 Volatility Metrics & IV Analysis
Calculates:
Current IV
IV Percentile Rank (IVR)
Fair IV using 3 methods:
Market-relative (IV vs. SPX HV)
SMA of HV
SMA of VIX
Implied Move over a forecast period (e.g., user-defined number of days)
Shows IV boundaries:
IV0, IV10, IV90, IV100
User-defined percentile bounds
⚠️ Alerts & Trade Signals
Reversion-based alerts (Strong/Moderate).
IV vs. Fair IV alerts.
"Trade Quality" label rating (Very Low → High).
📋 Detailed Table Dashboard
Customizable view: Compact or Full.
Mobile-optimized layout with adjustable text size and placement.
Includes:
Mean reversion % (chart + daily)
Pair correlation stats
IV, IVR, Fair IV
Net Implied Move range (upper/lower bounds)
Trade quality, IV boundaries
Correlation to SPY
Today's % move
Historical green/red day %s
Avg % up/down moves
🌐 Market Volatility Overview
Live readings of:
VIX, VIX1D, VVIX
MOVE (bond vol)
GVZ (gold vol)
OVX (oil vol)
Includes % changes and color-coded risk interpretation.
📉 VIX-Based Expected Move Zones
Optional display of 1σ / 2σ / 3σ bounds based on VIX-derived expected moves.
Plots and labels price bands around mean using √12 scaling for monthly estimation.
🛠️ Customization Options
Fully configurable via inputs:
Lookback periods
Z-score thresholds
Volatility calculation method
Text/table layout, compact/full mode
Alert toggles and thresholds
This indicator is ideal for:
Mean reversion traders
Options volatility analysis
Correlation-based pair trading
Volatility environment tracking

Babanov_SOLUSDT V2🧪 Deep Backtest Results (SOL 5-Min Strategy)
Backtest conducted on SOLUSDT.P (Bybit) using a 5-minute chart timeframe over several weeks of data.
! imgur.com
⚠️ Важно: Инструкции за правилна употреба на скрипта!
Ако искате да използвате този скрипт с webhook alerts за автоматична търговия, моля, обърнете внимание на следните стъпки:
✅ 1. Активирайте "Live Trading Mode"
Преди да създадете какъвто и да е alert, отидете в таба "Inputs" и задължително активирайте опцията "Live Trading Mode". Без нея скриптът няма да изпраща правилни сигнали.
✅ 2. Въведете търговската сума в USD
В таба "Properties", въведете сумата в USD, която ботът ще използва за търговия с SOL.
- Препоръчително е сумата да бъде такава, която може да бъде разделена на 50 (например 50, 100, 150, 200 и т.н.), за да се гарантира коректно управление на позициите и обемите при търговия.
✅ 3. Препоръчителна платформа: Bybit - BYBIT:SOLUSDT.P
Скриптът е оптимизиран и тестван за търговия на Bybit. Използването му на други платформи може да доведе до различни резултати, тъй като графиките и ценовите движения може да се различават.
-----------------------------------------------------------------------------------------------
⚠️ Important: Instructions for Proper Use of This Script
If you want to use this script with webhook alerts for automated trading, please follow the steps below carefully:
✅ 1. Enable "Live Trading Mode"
Before creating any alerts, go to the "Inputs" tab and make sure to enable the "Live Trading Mode" option.
Without it, the script will not generate correct trading signals.
✅ 2. Enter Your Trading Amount in USD
In the "Properties" tab, enter the amount in USD that the bot will use for SOL trading.
It is strongly recommended to enter an amount that can be divided by 50 (e.g., 50, 100, 150, 200, etc.) to ensure proper position sizing and trade management.
✅ 3. Recommended Exchange: Bybit - BYBIT:SOLUSDT.P
The script is optimized and tested specifically for Bybit.
Using it on other exchanges may result in different outcomes due to variations in chart data and price movements.

Byquan ADX RSI EMA9 Cross AlertThis indicator is used when the ADX exceeds the 40 threshold to look for potential reversals, confirmed by the crossover between the RSI and the RSI-based moving average, as well as the EMA 9.

Byquan ADX‑RSI Cross AlertThis indicator is used when the ADX exceeds the 40 threshold to look for potential reversals, confirmed by the crossover between the RSI and the RSI-based moving average, as well as the EMA 9.
