Momentum Shift [Bigbeluga]
This indicator identifies momentum shifts using a smoothed momentum calculation. It plots dynamic shift zones consisting of five levels that expand or contract based on price action. When momentum rises, the indicator creates an upward shift zone, and when momentum falls, it generates a downward shift zone. The shift zones dynamically react to price, stopping extension when a level is crossed.
🔵Key Features:
Smoothed Momentum Calculation:
➣ Utilizes a Hull Moving Average (HMA) to smooth momentum and reduce noise.
➣ Identifies momentum shifts with crossovers between the current momentum value and its previous state.
➣ Uses a gradient color scheme to highlight momentum strength.
Dynamic Shift Zones:
➣ When momentum rises, the indicator plots an upper shift zone with five incremental levels.
➣ When momentum falls, a lower shift zone is formed with five descending levels.
➣ Each level within the shift zone represents a progressively stronger momentum shift.
Level Extension Control:
➣ Shift zones stop extending once a level is crossed by price.
➣ Levels closer to price act as key momentum resistance or support zones.
➣ If price retraces after a shift, the remaining levels stay intact for further reference.
Momentum Direction Indications:
➣ Labels (▲ and ▼) appear at momentum shift points to indicate rising or falling momentum.
🔵Usage:
Momentum-Based Entries: Identify momentum shifts early by using shift zones as confirmation for trade entries.
Trend Continuation & Exhaustion: Observe which shift levels price respects—if momentum shift zones hold, the trend may continue; if they break, momentum may reverse.
Dynamic Support & Resistance: Use the five-level shift zones as temporary support and resistance areas that adapt to momentum shifts.
Momentum Strength Analysis: If price moves through multiple shift levels in one direction, it signals strong momentum in that direction.
Momentum Shift is a powerful tool for traders looking to analyze momentum shifts with structured visual zones. By combining smoothed momentum calculations with dynamic shift zones, this indicator provides a clear view of market momentum and helps traders navigate price action effectively.
Indicators and strategies

Linear Regression Volume Profile [ChartPrime]LR VolumeProfile
This indicator combines a Linear Regression channel with a dynamic volume profile, giving traders a powerful way to visualize both directional price movement and volume concentration along the trend.
⯁ KEY FEATURES
Linear Regression Channel: Draws a statistically fitted channel to track the market trend over a defined period.
Volume Profile Overlay: Splits the channel into multiple horizontal levels and calculates volume traded within each level.
Percentage-Based Labels: Displays each level's share of total volume as a percentage, offering a clean way to see high and low volume zones.
Gradient Bars: Profile bars are colored using a gradient scale from yellow (low volume) to red (high volume), making it easy to identify key interest areas.
Adjustable Profile Width and Resolution: Users can change the width of profile bars and spacing between levels.
Channel Direction Indicator: An arrow inside a floating label shows the direction (up or down) of the current linear regression slope.
Level Style Customization: Choose from solid, dashed, or dotted lines for visual preference.
⯁ HOW TO USE
Use the Linear Regression channel to determine the dominant price trend direction.
Analyze the volume bars to spot key levels where the majority of volume was traded—these act as potential support/resistance zones.
Pay attention to the largest profile bars—these often mark zones of institutional interest or price consolidation.
The arrow label helps quickly assess whether the trend is upward or downward.
Combine this tool with price action or momentum indicators to build high-confidence trading setups.
⯁ CONCLUSION
LR Volume Profile is a precision tool for traders who want to merge trend analysis with volume insight. By integrating linear regression trendlines with a clean and readable volume distribution, this indicator helps traders find price levels that matter the most—backed by volume, trend, and structure. Whether you're spotting high-volume nodes or gauging directional flow, this toolkit elevates your decision-making process with clarity and depth.


MACD STRATEJİ esat6606A sophisticated MACD (Moving Average Convergence Divergence) indicator with advanced signal generation and protection mechanisms. Built with proprietary algorithms for enhanced accuracy and security.
. Visual Indicators
• White line: Primary MACD line
• Yellow line: Signal line
• Histogram: Trend strength visualization
• Green/Red coloring: Trend direction
• Triangle markers: Confirmed signals
• Green Triangle: Bullish signal confirmation
• Color Changes: Trend strength and direction
• Histogram: Momentum visualization

RSI3M3+ v.1.8RSI3M3+ v.1.8 Indicator
This script is an advanced trading indicator based on Walter J. Bressert's cycle analysis methodology, combined with an RSI (Relative Strength Index) variation. Let me break it down and explain how it works.
Core Concepts
The RSI3M3+ indicator combines:
A short-term RSI (3-period)
A 3-period moving average to smooth the RSI
Bressert's cycle analysis principles to identify optimal trading points
RSI3M3+ Indicator VisualizationImage Walter J. Bressert's Cycle Analysis Concepts
Walter Bressert was a pioneer in cycle analysis trading who believed markets move in cyclical patterns that can be measured and predicted. His key principles integrated into this indicator include:
Trading Cycles: Markets move in cycles with measurable time spans from low to low
Timing Bands: Projected periods when the next cyclical low or high is anticipated
Oscillator Use: Using oscillators like RSI to confirm cycle position
Entry/Exit Rules: Specific rules for trade entry and exit based on cycle position
Key Parameters in the Script
Basic RSI Parameters
Required bars: Minimum number of bars needed (default: 20)
Overbought region: RSI level considered overbought (default: 70)
Oversold region: RSI level considered oversold (default: 30)
Bressert-Specific Parameters
Cycle Detection Length: Lookback period for cycle identification (default: 30)
Minimum/Maximum Cycle Length: Expected cycle duration in days (default: 15-30)
Buy Line: Lower threshold for buy signals (default: 40)
Sell Line: Upper threshold for sell signals (default: 60)
How the Indicator Works
RSI3M3 Calculation:
Calculates a 3-period RSI (sRSI)
Smooths it with a 3-period moving average (sMA)
Cycle Detection:
Identifies bottoms: When the RSI is below the buy line (40) and starting to turn up
Identifies tops: When the RSI is above the sell line (60) and starting to turn down
Records these points to calculate cycle lengths
Timing Bands:
Projects when the next cycle bottom or top should occur
Creates visual bands on the chart showing these expected time windows
Signal Generation:
Buy signals occur when the RSI turns up from below the oversold level (30)
Sell signals occur when the RSI turns down from above the overbought level (70)
Enhanced by Bressert's specific timing rules
Bressert's Five Trading Rules (Implemented in the Script)
Cycle Timing: The low must be 15-30 market days from the previous Trading Cycle bottom
Prior Top Validation: A Trading Cycle high must have occurred with the oscillator above 60
Oscillator Behavior: The oscillator must drop below 40 and turn up
Entry Trigger: Entry is triggered by a rise above the price high of the upturn day
Protective Stop: Place stop slightly below the Trading Cycle low (implemented as 99% of bottom price)
How to Use the Indicator
Reading the Chart
Main Plot Area:
Green line: 3-period RSI
Red line: 3-period moving average of the RSI
Horizontal bands: Oversold (30) and Overbought (70) regions
Dotted lines: Buy line (40) and Sell line (60)
Yellow vertical bands: Projected timing windows for next cycle bottom
Signals:
Green up arrows: Buy signals
Red down arrows: Sell signals
Trading Strategy
For Buy Signals:
Wait for the RSI to drop below the buy line (40)
Look for an upturn in the RSI from below this level
Enter the trade when price rises above the high of the upturn day
Place a protective stop at 99% of the Trading Cycle low
For Sell Signals:
Wait for the RSI to rise above the sell line (60)
Look for a downturn in the RSI from above this level
Consider exiting or taking profits when a sell signal appears
Alternative exit: When price moves below the low of the downturn day
Cycle Timing Enhancement:
Pay attention to the yellow timing bands
Signals occurring within these bands have higher probability of success
Signals outside these bands may be less reliable
Practical Tips for Using RSI3M3+
Timeframe Selection:
The indicator works best on daily charts for intermediate-term trading
Can be used on weekly charts for longer-term position trading
On intraday charts, adjust cycle lengths accordingly
Market Applicability:
Works well in trending markets with clear cyclical behavior
Less effective in choppy, non-trending markets
Consider additional indicators for trend confirmation
Parameter Adjustment:
Different markets may have different natural cycle lengths
You may need to adjust the min/max cycle length parameters
Higher volatility markets may need wider overbought/oversold levels
Trade Management:
Enter trades when all Bressert's conditions are met
Use the protective stop as defined (99% of cycle low)
Consider taking partial profits at the projected cycle high timing
Advanced Techniques
Multiple Timeframe Analysis:
Confirm signals with the same indicator on higher timeframes
Enter in the direction of the larger cycle when smaller and larger cycles align
Divergence Detection:
Look for price making new lows while RSI makes higher lows (bullish)
Look for price making new highs while RSI makes lower highs (bearish)
Confluence with Price Action:
Combine with support/resistance levels
Use with candlestick patterns for confirmation
Consider volume confirmation of cycle turns
This RSI3M3+ indicator combines the responsiveness of a short-term RSI with the predictive power of Bressert's cycle analysis, offering traders a sophisticated tool for identifying high-probability trading opportunities based on market cycles and momentum shifts.
THANK YOU FOR PREVIOUS CODER THAT EFFORT TO CREATE THE EARLIER VERSION THAT MAKE WALTER J BRESSERT CONCEPT IN TRADINGVIEW @ADutchTourist

Mickey's BBMickey's BB – Smart Reversal Detector with SL Tracking 🔁
This indicator combines the power of Bollinger Bands with engulfing candle patterns to identify high-probability reversal points.
✅ Buy Signal: Triggered when a red candle touches the lower Bollinger Band and is engulfed by a green candle within the next few candles.
✅ Sell Signal: Triggered when a green candle touches the upper Bollinger Band and is engulfed by a red candle within the next few candles.
✅ Smart Lookahead: Scans up to X candles ahead (user-defined) to confirm engulfing reversals — reducing noise in sideways markets.
✅ Dynamic Stop-Loss & Target: Automatically plots SL/TP levels based on user-defined % thresholds.
✅ SL HIT Labels: Highlights exactly when a stop-loss is breached, giving clear visual feedback on trade failures.
✅ Adaptive Market Filter: Signals are only shown when Bollinger Band width exceeds a minimum threshold — filtering out weak/noise signals in low volatility.
🔍 Ideal for reversal traders, scalpers, and those who love combining price action with volatility-based setups.
🛠️ Customizable Parameters:
SMA Period & Std Dev Multiplier (for BB)
SL/Target % levels
Engulf Lookahead range
Minimum BB width to filter signals
🎯 Build it into your strategy, set alerts, or just use it visually to time your entries and exits with clarity.

Supply & Demand Zones
_____________________________________________________________________
Supply and Demand Zones
This indicator displays valid Supply and Demand zones on any chart and timeframe, using dynamically updating visuals. Users can see the moment that zones become validated, used, and then invalidated during live sessions. It is sleek, lightweight, and offers a feature-rich settings panel that allows customization of how each element appears and functions. Zones can enhance the probability of successful trades by locating areas that are most likely to contain resting orders of Supply or Demand, which are needed for price reversals.
Disclaimer
____________________
Like all indicators, this can be a valuable tool when incorporated into a comprehensive, risk-based trading system.
Supply and Demand is not the same thing as Support and Resistance.
Trading based on price hitting a zone without understanding which zones are of higher quality and which are of lower quality (only discernible with a trained human eye) will yield poor results.
Supply and Demand works well as a system and even better when added to an existing one. However, like all effective trading techniques, it requires diligent study, practice, and repetition to become proficient. This is an indicator for use with Supply and Demand concepts, not a replacement for learning them.
Features
____________________
Once a valid candle sequence is confirmed, a box will appear that displays the zone over the precise zone range. At 50% zone penetration, a zone becomes used , and at 100% it becomes invalidated . Each of these zone classifications changes the behavior of the zone on the chart immediately. The settings panel offers custom colors for Supply , Demand , Used , and Invalidated zone types.
Borders : The subtle border colors can be changed or hidden.
Boxes or Bases : Advanced users can opt to hide zone boxes and instead display small, subtle tags over base candle groups. This allows for more customizable selection over what is displayed and how.
Max Zones and Hide Invalidated :
There are limitations on how many objects TradingView allows at once. Because of this, once zones go from used to invalidated , they are hidden (deleted) by default. This allows the zones index to be allocated to display more valid , usable zones instead. If a user prefers to keep invalidated zones visible, they can be enabled; however, this will result in showing more recent zones for fewer historical zones.
All zones share one pool, so if you allow fifty max zones, forty-five might be supply while five might be demand on a big sell-off trend. You will always see the most recent zones, regardless of type or status.
It’s up to you how much clutter you want on your screen and how much improved load time you want - but once loaded, zone creation and function are always instantaneous.
Load Time
____________________
Load time refers to the time it takes from when you switch tickers or timeframes before the zones are displayed initially. There is zero lag in the dynamic function and minimal load time, regardless of settings. However, if you are a fine-tuner or multi-screener, the number of Max Zones displayed is the only major variable affecting load time.
I run everything at Max when I develop. When I trade, I run mine at 25 max zones because I change timeframes often and want a very quick display of zones when I do. I have invalidated hidden, and simply enable it if I want to check an old zone. This gives me more zones than I need and reduces the load time to right where I like it.
Thresholds
____________________
It is recommended to leave these as the default.
Base Body Threshold : Determines the maximum ratio of a candle’s body to wick before invalidation. Default (50% or 0.5). A higher number loosens thresholds, resulting in more zones being displayed.
Unrequire 2nd FT if LO is Strong & Strength Multiplier :
The standard logic sequence requires two Follow-Through candles. Under some strong price movement, Leg-Out candles can make an explosive directional move from a base, making a convincing argument for supply and demand perfectly at work, if not for a single Follow-Through candle instead of two.
By enabling this feature, you can tell the script to ignore second Follow-Through candles, if and only if, the Leg-Out candle's range is (Strength) X the base range. exceeds the range of the Base by a factor of X (Strength). ie: At 5x, this would require a Leg-Out range to be 500% the range of the Base.
If enabled and the Leg-Out is not strong enough, the default logic kicks in, and a second follow-through candle will validate the zone as per usual. This loosens thresholds overall and should result in more zones.
Recommended Usage
____________________
Form a thesis using your primary trend trading system (eg: Elliott Wave, Structure Reversal, TheStrat, et al) to identify locations of a pullback for a long or short entry.
Identify a pullback area using your system, then use this indicator to find a high-quality zone on your chosen timeframe.
Once located, draw your own channel over the indicator's zone box. Start on 1m, check for zones, 2m, 3m, and so on. When you see a zone you like, recreate it; thus, when finished, you can see every timeframe’s highest-quality zones that you created, regardless of what timeframe you switch to. Tip: Be selective
To make the process faster, save a channel design in settings for “Demand” and one for “Supply”, then you can quickly get through this process in less than a minute with practice.
Optional: Use additional methods (eg: Fibonacci retracements, Elliott Wave Theory, Anchored VWAPs) to find congruent confirmation.
Version 1.0
____________________
No known bugs remain from the closed beta.
In Development
____________________
Powerful combination zones occur when standard zone sequences are extended with additional levels of demand or supply by adding more conditionals to the state machine logic. Got this mostly working in a dev version and it adds minimal extra resources. Set aside to polish a clean standard 1.0 for release first, but now displaying these extended zones is my top priority for next version.
MTF support is essentially working in a dev copy, but adds resources. Not sure if it is in the spirit of price action being the primary focus of a chart for serious traders, rather than indicators. If there is demand for it, I'll consider it.
Additional Threshold Settings
Thanks!
____________________
Thank you for your interest in my work. This was a personal passion project of mine, and I was delighted it turned out better than I hoped, so I decided to share it. If you have any comments, bugs, or suggestions, please leave them here, or you can find me on Twitter or Discord.
@ ContrarianIRL
Open-source developer for over 25 years

ICT FVG & Swing Detector Basic by Trader RiazICT FVG & Swing Detector Basic by Trader Riaz
Unlock Precision Trading with the Ultimate Fair Value Gap (FVG) and Swing Detection Tool!
Developed by Trader Riaz , the ICT FVG and Swing Detector Basic is a powerful Pine Script indicator designed to help traders identify key market structures with ease. Whether you're a day trader, swing trader, or scalper, this indicator provides actionable insights by detecting Bullish and Bearish Fair Value Gaps (FVGs) and Swing Highs/Lows on any timeframe. Perfect for trading forex, stocks, crypto, and more on TradingView!
Key Features:
1: Bullish and Bearish FVG Detection
- Automatically identifies Bullish FVGs (highlighted in green) and Bearish FVGs (highlighted in red) to spot potential reversal or continuation zones.
- Displays FVGs as shaded boxes with a dashed midline at 70% opacity, making it easy to see the midpoint of the gap for precise entries and exits.
- Labels are placed inside the FVG boxes at the extreme right for clear visibility.
2: Customizable FVG Display
- Control the number of Bullish and Bearish FVGs displayed on the chart with user-defined inputs (fvg_bull_count and fvg_bear_count).
- Toggle the visibility of Bullish and Bearish FVGs with simple checkboxes (show_bull_fvg and show_bear_fvg) to declutter your chart.
3: Swing High and Swing Low Detection
- Detects Swing Highs (blue lines) and Swing Lows (red lines) to identify key market turning points.
- Labels are positioned at the extreme right edge of the lines for better readability and alignment.
- Customize the number of Swing Highs and Lows displayed (swing_high_count and swing_low_count) to focus on the most recent market structures.
4: Fully Customizable Display
- Toggle visibility for Swing Highs and Lows (show_swing_high and show_swing_low) to suit your trading style.
- Adjust the colors of Swing High and Low lines (swing_high_color and swing_low_color) to match your chart preferences.
5: Clean and Efficient Design
- Built with Pine Script v6 for optimal performance on TradingView.
- Automatically removes older FVGs and Swing points when the user-defined count is exceeded, keeping your chart clean and focused.
- Labels are strategically placed to avoid clutter while providing clear information.
Why Use This Indicator?
Precision Trading: Identify high-probability setups with FVGs and Swing points, commonly used in Smart Money Concepts (SMC) and Institutional Trading strategies.
User-Friendly: Easy-to-use inputs allow traders of all levels to customize the indicator to their needs.
Versatile: Works on any market (Forex, Stocks, Crypto, Commodities) and timeframe (1M, 5M, 1H, 4H, Daily, etc.).
Developed by Trader Riaz: Backed by the expertise of Trader Riaz, a seasoned trader dedicated to creating tools that empower the TradingView community.
How to Use:
- Add the Custom FVG and Swing Detector to your chart on TradingView.
- Adjust the input settings to control the number of FVGs and Swing points displayed.
- Toggle visibility for Bullish/Bearish FVGs and Swing Highs/Lows as needed.
- Use the identified FVGs and Swing points to plan your trades, set stop-losses, and target key levels.
Ideal For:
- Traders using Smart Money Concepts (SMC), Price Action, or Market Structure strategies.
- Those looking to identify liquidity grabs, imbalances, and trend reversals.
- Beginners and advanced traders seeking a reliable tool to enhance their technical analysis.
Happy trading!

TREND FINDER BY MRS (SSL Hybrid + Delta Candles)Perfect for identifying trend direction, continuation signals, and exit points while visualizing real-time buying/selling pressure.
A sophisticated multi-timeframe trading system combining:
SSL Hybrid Trend Analysis (HMA/JMA/EMA baseline)
Volume Delta Visualization (colored candles)
ATR Volatility Bands (optional)
Key Features:
1. Smart Trend Detection
Custom Baseline MA: Choose between HMA, JMA (Jurik), or EMA with adjustable length
Trend-Colored Baseline:
🟢 Green = Uptrend (price above & baseline rising)
🔴 Red = Downtrend (price below & baseline falling)
🟠 Orange = Neutral/Transition phase
2. Volume Delta Candles
Colors candles based on lower timeframe volume imbalance:
🟢 Dark Green: Strong buying pressure (delta > 20%)
🌱 Light Green: Moderate buying (delta 5-20%)
🔴 Dark Red: Strong selling pressure (delta < -20%)
🌸 Light Red: Moderate selling (delta -5% to -20%)
⚪ Gray: Balanced volume
3. Professional Tools
ATR Bands: Visualize volatility with adjustable multiplier
Multi-Timeframe Analysis: Delta calculated from lower timeframe (default: 1min)
Alerts: Baseline crosses and extreme delta conditions
Recommended Settings:
Chart Type: Daily (for NNFX method)
Baseline: HMA/JMA (60 periods)
Delta TF: 1-5min for intraday volume accuracy
How Traders Use It:
Trend Traders: Follow colored baseline for direction
Swing Traders: Use delta extremes for reversals
Breakout Traders: Watch ATR band expansions
Published Notes:
TREND FINDER BY MRS (SSL Hybrid with Delta Candles)
By: Rajasekhar Muvvala
*"See the trend, read the volume, trade with confidence"*
Installation:
1. Add to TradingView via Pine Editor
2. Customize colors/thresholds in settings
3. Apply to daily charts for best results
Pro Tip:
Combine with:
- 200EMA for long-term bias
- Horizontal S/R levels
- Price action confirmation
This description highlights the indicator's unique value while making it accessible for both beginners and advanced traders. The markdown formatting ensures clean presentation when published on trading forums or journals. Would you like me to adjust any technical aspects or emphasize different features?

Price action plus//The system combines the divergence of A/D and OBV with identifying reversal points using Japanese candlestick patterns, creating an enhanced version of price action. This helps investors more easily and accurately recognize reversal patterns in technical analysis.
Divergence of A/D vs. OBV includes:
Positive divergence: Identifies smart money leaving the market.
Negative divergence: Identifies smart money entering the market.
Reversal candlestick patterns include:
Buy signals: Morning Star, Bullish Engulfing, Hammer.
Strong Buy signals: Buy signals + Negative divergence
Sell signals: Evening Star, Bearish Engulfing, Shooting Star.
Strong Sell signals : Sell signals + Positive divergence
//Hope this system will be helpful for you!

Support Resistance + TrendlinesThe indicator combines two powerful technical analysis concepts:
Dynamic Trendlines - Automatically draws trendlines based on pivot highs and lows, detecting when price crosses these lines.
Support and Resistance Levels - Identifies horizontal S/R zones based on pivot points that occur in channels of similar price levels.
This creates a comprehensive view of market structure that can be leveraged for trading decisions.
Strategy Overview
I've developed a trading strategy that capitalizes on the signals generated by both trendline breakouts and support/resistance level violations. The strategy includes:
Signal Generation
Trendline Breakouts
Long signals when price crosses above a downtrend line
Short signals when price crosses below an uptrend line
Support/Resistance Breakouts
Long signals when price breaks above a resistance level
Short signals when price breaks below a support level
Risk Management Features
ATR-Based Stop Loss and Take Profit
Dynamic SL/TP levels that adjust to market volatility
Customizable ATR multipliers for both TP and SL
Signal Filters
Confirmation Period
Requires signals to remain valid for a configurable number of candles
Reduces false breakouts by waiting for confirmation
Volume Filter
Ensures breakouts are accompanied by above-average volume
Volume threshold is adjustable
RSI Filter
Prevents buying in overbought conditions
Prevents shorting in oversold conditions
Visual Feedback
Dashboard showing current market conditions
Clear entry signals with shapes
SL/TP levels displayed on chart for active positions
How the Strategy Works
Signal Detection
The strategy monitors for trendline crossovers and S/R level breaks
When detected, it starts a confirmation countdown
Confirmation Process
Instead of entering immediately, it waits for the specified number of confirmation candles
This helps filter out false breakouts
Filter Application
Before entry, it checks if volume and RSI conditions are satisfied
You can enable/disable these filters based on your trading preferences
Entry and Exit Management
Once all conditions are met, the strategy enters a position
Simultaneously sets take profit and stop loss orders based on ATR

Croak Indicator Trend Filtered🐸 Croak Indicator – Trend-Filtered Market Structure Visualizer
🔍 Overview
The Croak Indicator is a visual market structure tool designed to highlight potential reversal zones by identifying key swing highs and lows. It uses price action and trend context to help traders understand possible turning points in the market.
This version introduces a trend filter using Exponential Moving Averages (EMA), so:
🐸 Frogs (bottom signals) only appear in uptrends
🦊 Foxes (top signals) only appear in downtrends
This helps reduce noise and keeps the indicator aligned with the prevailing trend.
🧠 How It Works
Detects significant swing points based on local highs/lows over a lookback period (Pattern Length).
Adds a trend filter using EMA 21 and EMA 50 to improve signal quality.
A structure score (Frog Jump Score) optionally appears in the corner to show how symmetrical the recent market swings have been.
The script uses bar-based historical analysis and repaints past signals as more candles form.
⚠️ Important Note on Repainting
This is a repainting indicator, meaning it uses future price action to confirm swing points. Signals may change or disappear as new bars form. It is not intended for real-time signal execution, but rather as a visual aid for understanding market structure in hindsight.
⚙️ Key Features
✅ Plots intuitive frog and fox icons for bullish/bearish swing points.
✅ Includes a trend filter using EMA crossover logic.
✅ Optional scoring table for structure geometry confidence.
✅ Useful for swing traders, market structure learners, and chart artists.
⚠️ Disclaimer
This script is provided for educational and informational purposes only. It does not constitute financial advice. Always do your own analysis and apply risk management when trading.

JPMorgan Collar LevelsJPMorgan Collar Levels – SPX/SPY Auto-Responsive (Quarterly Logic)
This script tracks the JPMorgan Hedged Equity Fund collar strategy, one of the most watched institutional positioning tools on SPX/SPY. The strategy rolls quarterly and often acts as a magnet or resistance/support zone for price.
✅ Key Features
🔄 Auto-switch by asset → Detects if you’re on SPX or SPY and adjusts the scale accordingly.
🧠 Quarterly logic → Detects the current calendar quarter (Q1–Q4) and auto-selects the corresponding PUT & CALL strike levels.
🟧 Dynamic collar zone shading → Visually highlights when price is inside the collar.
🏷 Edge-aligned labels → "JPM Collar CALL" and "PUT" dynamically positioned at the right edge of the chart.
📋 Quarter info label → Displays current quarter and active PUT/CALL levels in real-time.
🔧 Editable inputs → Define the four quarterly strike levels at the beginning of the year without needing to touch the code again.
📌 Use Case
Identify key price zones influenced by JPMorgan's institutional hedging flow.
Use collar levels as targets, barriers, or mean reversion zones.
Combine with options flows (OPEX) or macro events for confluence-based trading.
⚙️ Inputs
Q1–Q4 strike levels for SPX can be edited from the input panel.
SPY levels are automatically derived by dividing SPX values by 10.
Optional: Enable/disable zone shading.
⚠️ Disclaimer
This script does not fetch real-time collar data from external APIs.
You must manually update the Q1–Q4 strike levels based on quarterly rollover announcements (typically mid-month during March, June, September, December).
Reliable sources for updates:
www.tier1alpha.com
www.spotgamma.com

RSI STRATEGY WITH TRENDLINE & BUY SELL SIGNALSCore Concepts:
* Relative Strength Index (RSI):
* The RSI is a momentum oscillator that measures the speed and change of price movements.
* It oscillates between 0 and 100.
* Typically, RSI values above 70 are considered overbought, and values below 30 are considered oversold.
* We use the RSI to identify potential reversals and overbought/oversold conditions.
* Trendlines:
* Trendlines are lines drawn on a chart to connect a series of price highs (downtrend) or lows (uptrend).
* They help identify the prevailing trend's direction and potential support/resistance levels.
* Trendlines are used to confirm the signals generated by the RSI.
RSI Strategy with Trendline Confirmation:
This strategy aims to combine the momentum insights of the RSI with the trend confirmation provided by trendlines.
Buy Signal:
* RSI Oversold: The RSI dips below a specified oversold level (e.g., 30).
* Uptrend Confirmation:
* An uptrend line is drawn connecting a series of rising lows.
* The price breaks above the uptrend line, or the price bounces from the uptrend line.
* RSI Crossover: The RSI crosses back above the oversold level, indicating a potential upward momentum shift.
* Buy Entry: Enter a long position when all three conditions are met.
Sell Signal:
* RSI Overbought: The RSI rises above a specified overbought level (e.g., 70).
* Downtrend Confirmation:
* A downtrend line is drawn connecting a series of falling highs.
* The price breaks below the downtrend line, or the price bounces from the downtrend line.
* RSI Crossover: The RSI crosses back below the overbought level, indicating a potential downward momentum shift.
* Sell Entry: Enter a short position when all three conditions are met.
TradingView Indicator

Quantum Price SignalQuantum Price Signal
This indicator combines square root price analysis with advanced technical filters to identify high-probability trading opportunities. Designed for practical use in real market conditions, it provides both visual signals and a comprehensive dashboard to enhance trading decisions.
Core Technology:
The Quantum Price Signal uses mathematical relationships based on square root price levels to identify key zones where price tends to react. These levels have proven to be powerful areas for reversals and continuations across multiple timeframes.
Detailed Usage Guide:
Signal Interpretation:
Green Triangle (Buy): Appears below candles at potential support levels. Look for these at market bottoms and pullbacks in uptrends
Red Triangle (Sell): Appears above candles at potential resistance levels. Most effective at market tops and rallies in downtrends
Dashboard Elements:
Buy/Sell Signal Quality: Shows relative strength of potential setups
Higher values indicate stronger signals with better probability
Use as comparative measure between different signals
Market Noise: Indicates market choppiness/volatility
Lower readings suggest cleaner price action and more reliable signals
Higher readings indicate choppy conditions requiring wider stops
Trend Direction: Overall market bias
Align trades with this direction for highest probability
Counter-trend trades require stronger signal quality
Near Square Root Level: Confirms price at significant mathematical level
"Yes" reading significantly strengthens any signal
These mathematical levels often act as strong support/resistance
Current Signal: Active trading recommendation
Shows most recent valid signal type
Use to quickly identify the indicator's bias
Practical Trading Applications:
Swing Trading Strategy:
Look for signals at key support/resistance levels
Confirm with trend direction on dashboard
Enter on close of signal candle
Place stops beyond recent swing points
Target next significant level or 1:2 risk-reward
Trend-Following Method:
Only take signals in direction of "Trend Direction"
Wait for pullbacks to Square Root levels
Require "Yes" for Near Square Root Level reading
Enter when signal appears at these levels
Trail stops using prior swing points
Reversal Detection:
Watch for signals against prevailing trend
Must have "Near Square Root Level" showing "Yes"
Confirm with pattern like engulfing or hammer
Look for divergence in momentum indicators
Use tighter stops as these are higher risk trades
Multiple Timeframe Approach:
Identify trend on higher timeframe
Look for signals on lower timeframe
Only take signals that align with higher timeframe trend
Add to position on additional signals in same direction
Exit when signal appears in opposite direction
Volume Confirmation Enhancement:
Check volume on signal candles
Stronger signals should have above-average volume
Low volume signals have higher failure rate
Volume increase on breakouts confirms strength
Volume decline near levels suggests potential failure
This indicator works best when combined with proper risk management and sound technical analysis principles. Use it as a decision support tool rather than an automated system, and always consider the broader market context when making trading decisions.RetryClaude can make mistakes. Please double-check responses.

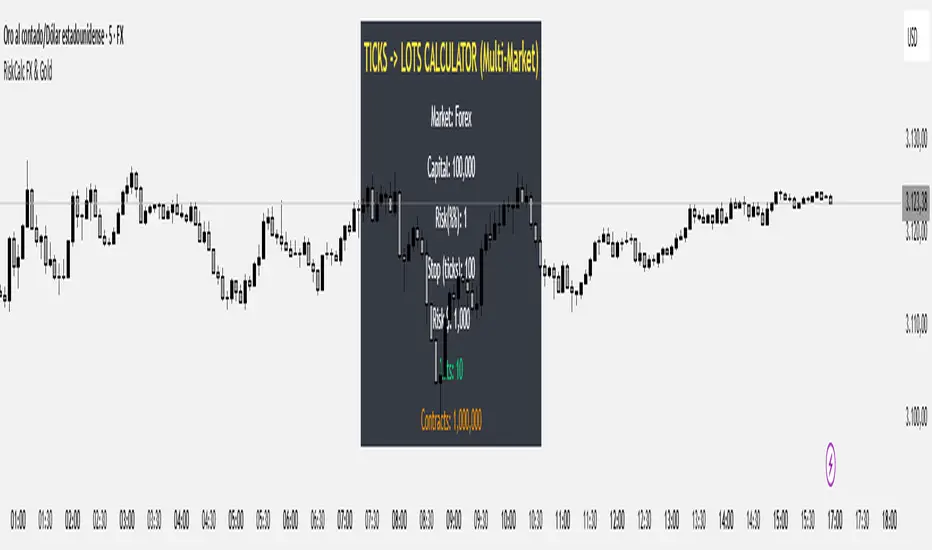
RiskCalc FX & GoldRiskCalc FX & Gold is a multi-market position sizing tool designed to help you manage risk quickly and accurately. With this script, simply enter your account capital, the percentage of risk you wish to take, and your stop in ticks. Depending on the selected market—Forex or XAUUSD—the script automatically adjusts its calculations:
Forex: Assumes 1 lot equals 100,000 units.
XAUUSD: Assumes 1 lot equals 100 ounces.
The script calculates your risk in dollars and, using a fixed value of 1 USD per tick per lot, determines the ideal position size in both lots and total contracts. Results are displayed in a clear, centralized table at the top of the chart for real-time decision-making.
Perfect for traders operating across multiple markets who need an automated and consistent approach to risk management.
Bi Trend signalauto bot MT5 for XAU, BTC ETH, liên hệ tôi để biết thêm chi tiết cho các hạng mục coppy trade

Hypersonic MAIN Intersection IndicatorIndicator that shows the intersection point of two Items of Interest. Backtesting showed the best was Candle/EMA 9.
1. I added 2 auxiliary EMA's that you can view or hide becuase I know some people like to see the EMA 200
2. You select the First and Second Item of Interest and it'll plot it in the background. First EMA and Second EMA correspond to whether you select them or not. The BWMA stuff is near the bottom. And in the middle is how you can show/hide the data table in the top-right.
3. you can show/hide different lines in the Style section
4. on the Style tab of Settings, you can turn off the whole table as well as the Trades, just the signal of the trade, or just the quantity of the trade

Combined SR, HEMA, and PivotsHelps to draw dynamic Support and resistance along with pivot points high / low

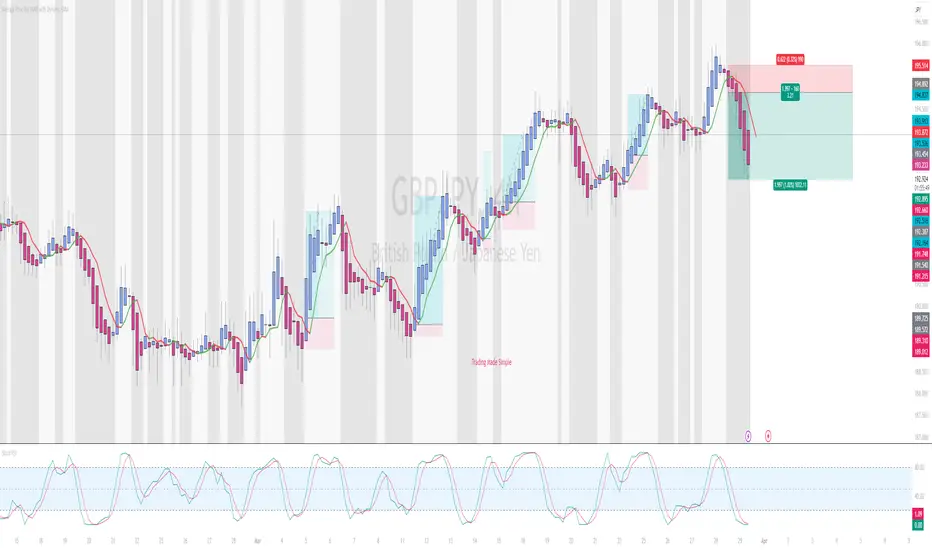
Average Price Bar (APB) with Dynamic EMATrading Made Simple: APB + Dynamic EMA with Stochastic (8,3,3) Strategy
Introduction
The "Trading Made Simple" strategy, originally developed by BigE on ForexFactory in 2011, is a powerful yet straightforward approach to trading that combines price action, moving averages, and momentum indicators to identify high-probability setups. This enhanced version integrates:
Average Price Bar (APB) – A smoothed candlestick representation that filters market noise.
Dynamic EMA (5-period, HLC3-based) – Acts as a trend filter, changing color based on its position relative to price.
Stochastic (8,3,3) – A fast momentum oscillator to confirm overbought/oversold conditions.
Core Trading Rules (BigE's Original Concept)
Trend Direction: The EMA defines the trend (bullish if price is above, bearish if below).
Stochastic Confirmation:
Long Trades: Look for Stochastic crossing up from oversold (<20) while price is above the EMA.
Short Trades: Look for Stochastic crossing down from overbought (>80) while price is below the EMA.
APB as Entry Confirmation:
A bullish APB close above the EMA strengthens long signals.
A bearish APB close below the EMA strengthens short signals.
Why This Combination Works
APB + EMA provides a clean trend bias, reducing false signals.
Stochastic (8,3,3) adds momentum confirmation, ensuring entries are timed well.
The background color shift (green/red) makes trend reversals visually intuitive.
This system is ideal for swing traders and day traders looking for a rule-based, discretionary approach that removes emotional decision-making while keeping trading simple and effective.
Wick Reversal Detector ProTime is Money. As Supply & Demand Wick Trader we cannot sit in front of the computer the whole day and wait for the magic to happen. I wrote this script to detects equal highs and equal lows with an adjustable wick size and alert function. Use LuxAlgo Swing Failure Pattern and my VIX-RSI Wick Hunt to identify Supply & Demand Zone Reversals.

HTF Candle with interval Separator (Murshid FX)// ========== KEY FEATURES ========== //
// 1. Higher Timeframe (HTF) Candles Visualization
// 2. Automatic Interval Separation line & Boxes
// 3. Customizable HTF Periods (1-6 timeframes)
// 4. Clean Price Action Organization
// 5. Symbol Info & Time Display
// 6. Professional Watermark
// ================================== //

Global Foreigners SMA, WMA IndicatorThis Indicator is a custom technical analysis tool designed to overlay multiple moving averages on a price chart, helping traders analyze price trends and potential trading opportunities.
It features both a Simple Moving Average (SMA) and Weighted Moving Averages (WMAs) with different period settings.
Key Features:
1. SMA and WMA Calculations:
- SMA 1: A simple moving average (SMA) calculated over a user-defined period (default: 1).
- WMA 1 - WMA 5: Five weighted moving averages (WMA) with different periods (5, 10, 20, 30, 40). WMAs give more importance to recent price movements, helping to identify short-term trends.
2. Customizable Periods:
- The indicator allows users to adjust the lookback period for each moving average via input settings.
3. Color-Coded Moving Averages:
- Each moving average is assigned a unique color for easy differentiation:
- SMA 1 → Black
- WMA 1 (5-period) → Blue
- WMA 2 (10-period) → Peach
- WMA 3 (20-period) → Orange
- WMA 4 (30-period) → Lavender
- WMA 5 (40-period) → Purple
4. Line Thickness:
- Each moving average is plotted with a line width of 2, making them clearly visible on the chart.
How This Indicator is Used:
Trend Analysis:
The alignment of the WMA sequence (e.g., WMA 5 > WMA 4 > WMA 3 > WMA 2 > WMA 1) can
indicate a bullish trend.
The opposite alignment suggests a bearish trend.
Dynamic Support & Resistance:
Shorter-period WMAs (5 & 10) react faster to price changes and can be used as dynamic
support or resistance levels for short-term trades.
Longer-period WMAs (20, 30, 40) smooth out price fluctuations and are useful for detecting
long-term trends.
Signal Confirmation:
The SMA 1 acts as a quick price reference, and traders can look for crossovers between the
WMA lines to confirm trend changes.
Who Can Use This Indicator?
Scalpers & Day Traders:
The faster WMAs (5 & 10) can be used to catch quick price reversals.
Swing Traders & Position Traders:
The combination of short-term and long-term moving averages helps identify key trend
shifts.
Algorithmic Traders:
Can be used alongside other indicators for automated signal generation.
This indicator is not a buy/sell signal generator but rather a trend-following tool that helps traders visually interpret market movements using moving averages. It works well when combined with momentum indicators (e.g., MACD, RSI) to confirm entry and exit points.

RSI Intraday High AccuracyThis is a high-accuracy RSI-based intraday trading indicator written in TradingView Pine Script. It identifies overbought and oversold zones to generate buy/sell signals while also providing EMA confirmation to enhance signal accuracy.
