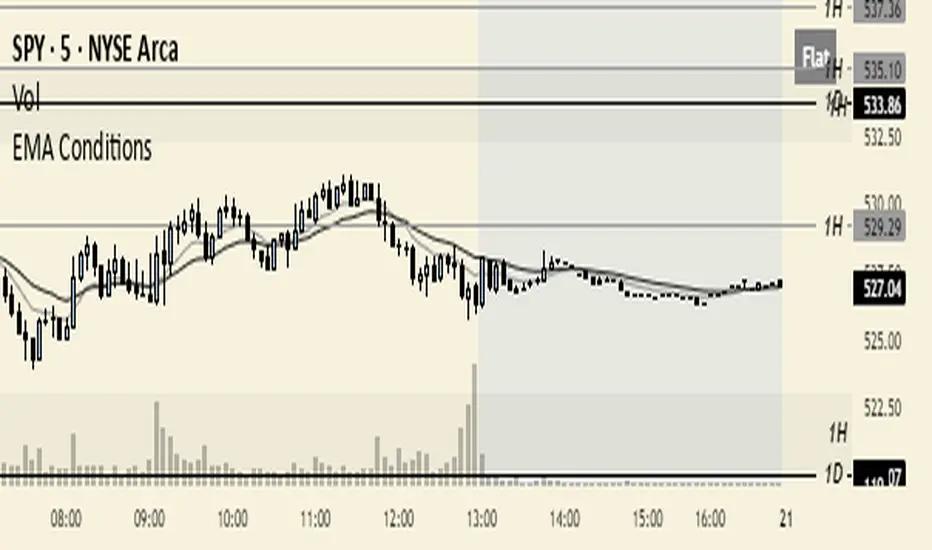
EMA ConditionsThis indicator was developed with the intention to display current market conditions according to the EMAs. There's a little box in the top right to display the conditions. I wanted to design something that shows already established market conditions, which is why I chose to use EMAs and candle closes as the source for identifying market conditions.
Personally, I scalp momentum in trending market conditions, so having an already established trend lets me know when it's appropriate for me to apply my edge on my lower time frame. I use a 5m time frame for my setups and this is where I apply this indicator. I designed the indicator to function off any time frame, so you can use this indicator with whatever time frame you want.
There are 5 conditions that I've set in place for this indicator, they're as follows:
1. Bullish conditions are met when price has closed 3+ consecutive candles over both EMAs (9 and 20 EMAs by default, but you can also choose what EMAs you want).
2. Bearish conditions are met when price has closed 3+ consecutive candles below both EMAs.
3. Reversal conditions are met when EMAs have crossed, and it will show those reversal conditions for the following 4 bars after the EMA cross over has taken place. Once there have been 4 bars closed, it will then show whatever condition is currently present.
4. Wait conditions are met when price is above/below (depending on direction of trend) the 9 ema.
- So in a bull trend, if price is below the 9 ema, it'll show "Wait"
5. Flat conditions are met when both EMAs are showing minimal changes in value over a specified number of candles. This indicates that EMAs are moving sideways and volatility is low. Likely in range bound or chop environments.
- The Flat threshold is adjustable. I have it set to 0.03% with a candle look back of 2 bars. This works the best for my edge, but you can set them to what you want.
The Flat and Wait conditions will override all other conditions. The Reversal conditions will override both Bullish and Bearish conditions. This way, when the indicator is showing Bullish or Bearish conditions, you'll know that nothing else is present.
Since I only trade in trending market conditions, I only trade when Bullish or Bearish conditions are met. If anything else is there then I'm not looking for my setups at that time. But you can use this however you'd like. If you like trading ranges, then trade when EMAs show flat. If you want to fade reversals and trade mean reversion, wait for a reversal condition to show and then look to fade that move. Get creative with it and with your edge. Don't put yourself in a box.
This indicator was made using Grok AI since I have no clue how to write code. I'll make the script available for everyone, so you can make adjustments yourself and do your own thing with it if you want.
If you have any questions or suggestions on how to improve the indicator, feel free to contact me on X: x.com
Trend Analysis
Moving Average Trend ToolsI. How M.A.T.T. Adds Value to the TradingView Community:
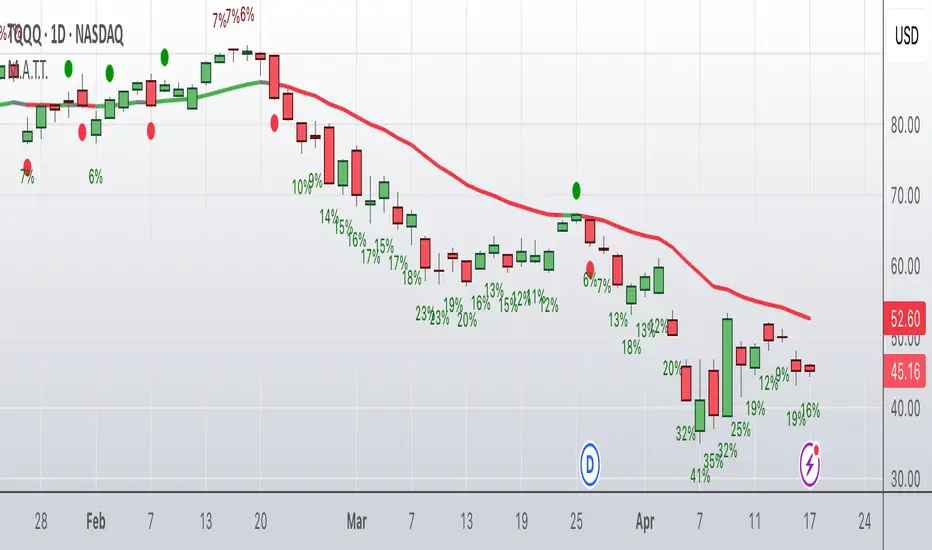
The "Moving Average Trend Tools" (M.A.T.T.) is a versatile Pine Script v6 indicator that empowers traders with clear trend analysis, reliable trade signals, and real-time insights. Its intuitive design and robust features make it a valuable addition to the TradingView Community Scripts by catering to traders of all levels. Here’s why it stands out:
Clear Trend Visualization: M.A.T.T. plots a moving average (MA) with dynamic coloring—green for rising, red for falling, and gray for flat—based on a user-defined lookback period. This simplifies trend interpretation, helping traders quickly assess market momentum.
Reliable Trade Signals : The script identifies price crossovers above or below the MA, plotting green circles for bullish crosses and red for bearish, confirmed on closed bars to prevent repainting. These signals guide entry and exit points for trend-following or reversal strategies.
Real-Time Extension Detection : M.A.T.T. calculates percentage price deviations from the MA, displaying real-time labels when thresholds (e.g., 6%) are exceeded. This highlights overextended moves, ideal for spotting reversals or pullbacks, with alerts to keep traders informed.
Extensive Customization : Traders can tailor the MA type (SMA, EMA, WMA, HMA), length, colors, line width, and label sizes. This flexibility supports diverse strategies across markets like stocks, forex, and crypto, from scalping to swing trading.
Automated Alerts : Alert conditions for crossovers and extensions integrate seamlessly with TradingView’s system, enabling traders to stay updated without constant chart monitoring.
M.A.T.T. combines trend analysis, signal generation, and overextension detection into a single, user-friendly tool. Its accessibility, reliability, and educational value for Pine Script learners make it a compelling contribution to the community.
II. What M.A.T.T. Does, How It Works, and Its Originality:
What It Does :
M.A.T.T. enhances trend analysis and trade decision-making through three core features:
Dynamic MA Visualization: Plots a customizable MA (SMA, EMA, WMA, or HMA) with trend-based coloring to reflect rising, falling, or flat market conditions.
Price Crossover Signals : Marks bullish (green circles) and bearish (red circles) crossovers, confirmed on closed bars, with alerts for trade opportunities.
Price Extension Labels : Displays real-time percentage deviations of price from the MA, with alerts when user-defined thresholds are breached, signaling potential reversals.
How It Works :
M.A.T.T. leverages Pine Script v6 for precise calculations and user-friendly outputs:
Inputs: Users select MA type, length, lookback period, colors, and thresholds for extensions, plus label styles and sizes for customization.
MA Calculation : A switch function computes the chosen MA (e.g., ta.ema(close, 21) for EMA). Trend direction is determined using ta.rising or ta.falling over the lookback period, coloring the MA accordingly.
Crossover Logic : Bullish crossovers (close > ma and close < ma ) and bearish crossovers (close < ma and close > ma ) are plotted as circles on confirmed bars (barstate.isconfirmed) to ensure reliability. Alerts trigger only on the first bar of a crossover.
Extension Logic : Percentage deviations are calculated as ((price - ma) / ma) * 100, using the high for above-MA extensions and low for below. Labels appear in real-time when thresholds are exceeded, with alerts on transitions to avoid noise.
Why It’s Original
M.A.T.T. distinguishes itself through a unique blend of features and thoughtful design:
All-in-One Design : It integrates dynamic MA coloring, non-repainting crossover signals, and real-time extension detection, addressing trend identification, trade signals, and overextension warnings in one tool—unlike most MA indicators that focus on a single aspect.
Real-Time Extension Labels : Displaying percentage deviations with customizable thresholds is a rare feature, ideal for volatile markets and not commonly found in standard scripts.
Non-Repainting Signals : Confirmed crossover signals enhance reliability for live trading, setting M.A.T.T. apart from less rigorous indicators.
Optimized Alert Condtions : Alerts trigger only on transitions (e.g., first bar of a crossover or extension), reducing noise and improving usability.
Visual and Functional Flexibility : Support for four MA types, extensive customization, and a clean interface (dynamic colors, tiny circles, clear labels) make it adaptable and user-friendly.
While MA plotting or crossovers exist elsewhere, M.A.T.T.’s seamless integration, real-time extension detection, alert conditions, and focus on reliability and customization create a distinctive, practical tool. Its balance of simplicity and sophistication makes it a unique asset for the TradingView community.
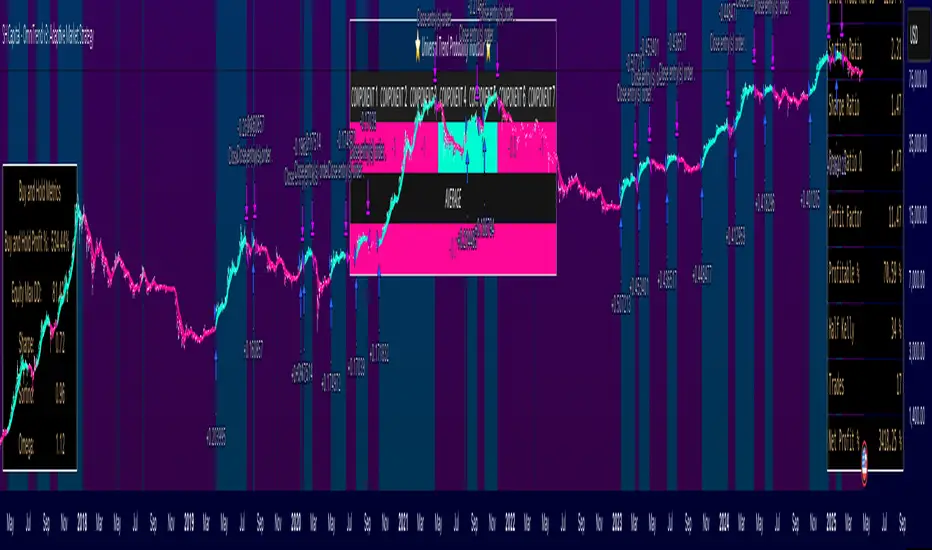
AlphaTrend (PRO)AlphaTrend is an advanced trading indicator that leverages proprietary tools, real-time data, and custom metrics to give traders a competitive edge. Designed for all experience levels, it works instantly—no advanced charting skills required.
🔍 How It Works
At the core of AlphaTrend is Dynamic Reversion Bands (not shown) — a sophisticated real-time system that adapts to price action by automatically adjusting to evolving market conditions.
These bands act like a roadmap, helping traders identify:
Mean reversion trade opportunities
Trend strength
Emotion-driven market conditions (like FOMO)
The system is rooted in Mean Reversion Theory:
If an asset's price deviates significantly from its historical average, it tends to “revert” back to that average over time. Traders can use this behavior to spot potential buying or selling opportunities:
Overbought Conditions: If the price moves too far above the mean, it may signal a pullback—traders might sell or short.
Oversold Conditions: If the price drops well below the mean, it may be undervalued—traders might buy in anticipation of a bounce.
🟡⚪🔴🟡⚪ Dynamic DOTS
AlphaTrend visualizes market overextension through dynamic DOTS:
White DOTS = Mild conditions
Yellow DOTS = Moderate conditions
Red DOTS = Extreme conditions
These DOTS update in real time as the candle is forming—appearing, disappearing, and shifting color based on current intensity levels. Once the candle closes, however, the DOTS do not repaint. This ensures clarity and confidence in every signal.
This is crucial, as many indicators repaint and revise data after the fact, undermining traders’ trust. With AlphaTrend, once a candle closes, the data remains permanently fixed.
📊 Adaptability and Market Insight
AlphaTrend adapts to any timeframe, but performs best on longer-duration candles, where signals are fewer but more reliable. Multi-interval displays (e.g., 1hr, 4hr, Daily) are highly recommended.
The tool also integrates several intuitive market overlays:
Auto-generated support and resistance levels
Real-time supply and demand zones
Money flow tracking from institutions and banks
⚠️ FOMO Candles
FOMO stands for Fear of Missing Out—a key emotional driver in volatile markets. AlphaTrend identifies FOMO candles, which change color (customizable by the user) to indicate potential emotionally irrational buying or selling activity.
Although these conditions can persist short-term due to macroeconomic or geopolitical catalysts, they often lack sustainability. FOMO candles serve as an early warning system, signaling caution and highlighting potential trend reversals.
💰 Institutional Money Flow
AlphaTrend tracks the flow of money from major institutions and banks, highlighting when significant capital enters or exits the market. These flows appear as blue and yellow plots in the lower panel of the chart and help traders distinguish between moves driven by retail traders and those driven by “smart money.”
🔑 Key Features
✅ Dynamic Reversion Bands – Proprietary, real-time indicators that adapt to price behavior and highlight overbought/oversold conditions.
✅ Dynamic DOTS – Real-time visual indicators that shift based on buying/selling intensity. DOTS do not repaint after a candle closes.
✅ Multi-Timeframe Adaptability – Works across all timeframes. Longer durations provide more accurate, reliable signals. Multi-interval chart setups are recommended.
✅ Support & Resistance Mapping – Automatically identifies critical price levels (works with 5m, 15m, 30m, 1H, 4H, and custom intervals).
✅ FOMO Candles – Highlight emotionally driven price moves that often precede reversals.
✅ Supply & Demand Zones – Auto-populated zones that reinforce support and resistance areas.
✅ Institutional Money Flow Plots – Reveal whether major financial players are entering or exiting a trade.
✅ Universal Compatibility – Supports stocks, crypto, forex, and commodities.
✅ User-Friendly & Customizable – Plug-and-play design with extensive customization options.
🚀 How to Gain Access
📩 Reach Out to the Author: Visit our profile and send a direct message.
💳 Purchase & Unlock: After payment, DM the author your TradingView username + payment email. Access will be granted within 48 hours. Add to favorites and search for it in the invite-only section.
📈 Start Trading: Add AlphaTrend to your charts and you're ready to go!
Trade smarter, not harder — let AlphaTrend’s intelligent design give you the edge you need.
>>>>>>>>>>>>>>>>>
⚖️ Legal Disclaimer
By accessing or using the AlphaTrend stock indicator (“the Software”), you (“the User”) agree to the following terms:
Authorized Use:
The AlphaTrend indicator is intended for personal use only, specifically for trading stocks, commodities, or other financial instruments.
Restrictions on Use:
You may not reproduce, redistribute, sublicense, sell, or otherwise distribute the AlphaTrend indicator, its source code, or any derivative in any format or method—electronic, mechanical, or otherwise.
Legal Enforcement:
Unauthorized use or distribution constitutes a violation of intellectual property rights and is subject to civil and/or criminal penalties. The AlphaTrend creator reserves all legal rights and remedies.
By using the software, you affirm that you have read, understood, and agree to these terms.
📌 Risk Disclosure
Past performance is not indicative of future results. All investments involve risk, and there is no guarantee any strategy or indicator mentioned will be suitable or profitable.
Changing market conditions may render parts of this content outdated. This indicator is not a substitute for personalized financial advice. Please consult a qualified professional before making investment decisions.

TTM Squeeze with SignalsTTM Squeeze by TheNewGuy
What It Does
The TTM Squeeze indicator is designed to detect when a market is "squeezing" (low volatility, like a coiled spring) and then "fires" (volatility increases, signaling a potential breakout). The script:
Shows when a squeeze is happening.
Displays a momentum histogram to gauge the strength and direction of price movement.
Plots buy and sell arrows on the price chart when conditions align for a trade.
Includes a 20-period Exponential Moving Average (EMA) for trend context.
Key Components
Squeeze Detection:
The script uses Bollinger Bands (based on a 20-period Simple Moving Average and 2 standard deviations) and Keltner Channels (based on a 20-period EMA and 1.5 times the Average True Range).
A "squeeze" happens when the Bollinger Bands move inside the Keltner Channels, indicating low volatility (the market is quiet and may be preparing for a big move).
When the squeeze ends (Bollinger Bands break out of the Keltner Channels), it’s called a "squeeze fire," signaling a potential breakout.
Momentum Histogram:
A histogram (bar chart) is shown in a separate panel below the price chart.
It measures momentum by comparing the current price to the midpoint of the highest and lowest prices over the past 20 periods.
Blue bars (above zero) indicate bullish momentum (price is strong).
Red bars (below zero) indicate bearish momentum (price is weak).
Buy and Sell Signals:
The script generates buy and sell signals when multiple conditions align, ensuring higher-confidence trades:
A squeeze must "fire" (transition from squeeze on to off).
Momentum must be in the right direction (positive for buy, negative for sell).
The price must be above the 20-period EMA for a buy (or below for a sell).
The Relative Strength Index (RSI, 14-period) must be above 50 for a buy (or below 50 for a sell).
The MACD (Moving Average Convergence Divergence) must show a bullish crossover for a buy (or bearish for a sell).
Buy signals appear as green upward triangles below the price bars, labeled "Buy."
Sell signals appear as red downward triangles above the price bars, labeled "Sell."
Visual Elements:
A blue 20-period EMA is plotted on the price chart to show the trend.
In the histogram panel:
A gray zero line helps you see whether momentum is positive or negative.
Red circles at the zero line indicate when a squeeze is active.
The histogram bars (blue or red) show momentum strength.
How to Use It
Look for Squeezes: Check the histogram panel for red circles, which show when the market is in a squeeze (low volatility). This is a heads-up that a big move might be coming.
Wait for a Squeeze Fire: When the red circles disappear, the squeeze has ended, and the market may be ready to breakout.
Check Momentum: Look at the histogram. Blue bars suggest a potential upward move, while red bars suggest a downward move.
Trade on Signals: Only act when a green "Buy" or red "Sell" arrow appears on the price chart. These signals combine the squeeze fire, momentum, trend (EMA), RSI, and MACD to confirm a trade.
Use the EMA for Context: If the price is above the blue EMA, the trend is bullish (favor buys). If below, it’s bearish (favor sells).
Why It’s Useful
The TTM Squeeze with Signals simplifies trading by:
Highlighting moments when the market is primed for a breakout.
Filtering trades with multiple indicators (momentum, RSI, MACD, and EMA) to reduce false signals.
Providing clear visual cues (arrows, histogram, and EMA) so you don’t need to calculate anything manually.
This script is great for traders who want to catch big price moves while avoiding choppy, indecisive markets. It works best on daily, hourly, or other timeframes where volatility patterns are clear.
Note: No indicator guarantees profits, so always use proper risk management and consider combining this with other analysis or strategies.

Supertrend 1H with Buy/Sell Labels, Shading & Trend Tablemodified supertrend multiple frames
day
4 hours
1 hour

📈 MACD Histogram + Momentum Signal@name 📈 MACD Histogram + Momentum Signal
* @version 1.0
* @author YourNameHere
* @description
* This indicator visualizes momentum using the MACD oscillator. It shows:
* - MACD line
* - Signal line (EMA of MACD)
* - MACD Histogram (MACD - Signal)
*
* The histogram bars are color-coded:
* - Green: Momentum increasing
* - Red: Momentum decreasing
*
* ──────────────
* 🔍 Features:
* - Standard MACD calculation (12/26/9 by default)
* - Momentum visualization through histogram
* - Zero line crossover alerts (bullish/bearish momentum shifts)
* - Clean color-coded layout
*
* ──────────────
* ⚙️ Inputs:
* - Fast EMA Length (default: 12)
* - Slow EMA Length (default: 26)
* - Signal EMA Length (default: 9)
* - Source (default: close)
*
* ──────────────
* 📈 How It Works:
* 1. MACD = EMA(fast) - EMA(slow)
* 2. Signal = EMA of MACD
* 3. Histogram = MACD - Signal
* 4. Histogram color changes depending on momentum change
* 5. Alerts fire when histogram crosses the zero line
*
* ──────────────
* 🚨 Alerts:
* - Histogram crossing above zero → Bullish momentum shift
* - Histogram crossing below zero → Bearish momentum shift
*
* ──────────────
* ⚠️ Notes:
* - MACD is a lagging indicator; best used with trend confirmation tools.
* - This version focuses on histogram-based momentum signals.
* - Works best in trending markets; can give false signals in choppy conditions.
*
* Default Settings:
* - Fast EMA: 12
* - Slow EMA: 26
* - Signal EMA: 9
* - Source: Close

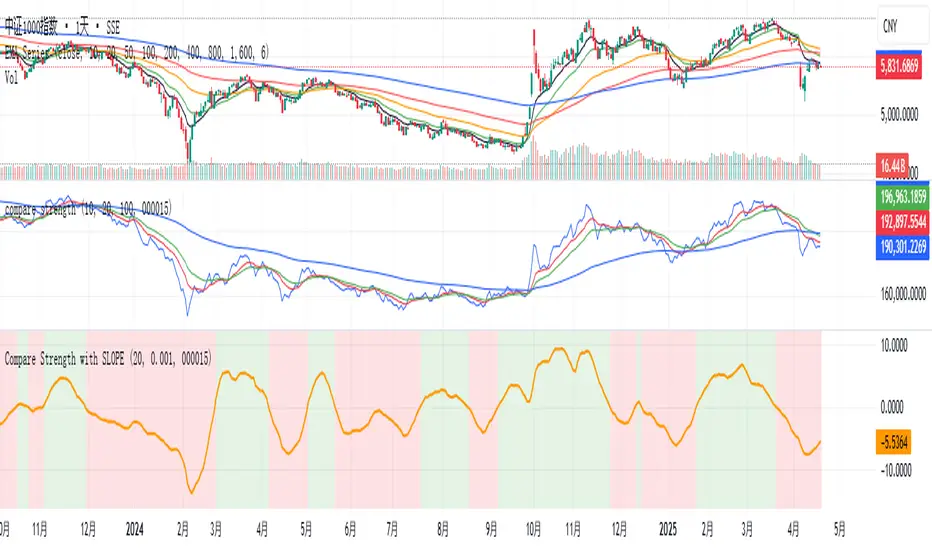
Compare Strength with SLOPE Description
This indicator compares the relative strength between the current asset and a benchmark (e.g., BTC vs. ETH or AAPL vs. SPY) using a linear regression slope of their ratio over time.
The ratio is calculated as: close / benchmark
A linear regression slope is computed over a user-defined window
The slope represents trend strength: if it’s rising, the current asset is outperforming the benchmark
Plots
Gray Line: The raw ratio between the asset and benchmark
Orange Line: The slope of the ratio (shows momentum)
Background Color :
Green: The asset is significantly stronger than the benchmark
Red: The asset is significantly weaker than the benchmark
No color: No clear trend
Settings
Slope Window Length: Number of candles used in the regression (default = 10)
Slope Threshold: Sensitivity of trend detection. Smaller values detect weaker trends.
Example Use Cases
Style Rotation Strategy: Use the slope to determine whether "Growth" or "Value" style is leading.
Pair Trading / Relative Performance: Track which asset is leading in a pair (e.g., BTC vs ETH).
Factor Timing: Serve as a timing model to allocate between different sectors or factors.
Happy trading!
📊 Trend Strength Meter@name 📊 Trend Strength Meter
* @version 1.0
* @author YourNameHere
* @description
* This indicator measures the strength of the market trend using an ADX-like method.
* It calculates the directional movement (DM) and the Average Directional Index (ADX)
* to provide a numeric and visual representation of trend strength.
*
* ──────────────
* 🔍 Features:
* - Plots ADX (trend strength) as a line and optional histogram
* - Color-coded bars for strong vs weak trend
* - Configurable threshold (default: 20)
* - Live label showing current trend strength
* - Alert conditions for strong/weak trend detection
*
* ──────────────
* ⚙️ Inputs:
* - Trend Period: Number of bars used for ADX calculation (default: 14)
* - Source: Price source for calculation (default: close)
* - Strength Threshold: Minimum ADX value to define strong trend (default: 20)
* - Show Histogram: Toggles the background histogram plot
* - Color by Strength: Changes color based on ADX value
*
* ──────────────
* 📈 How It Works:
* 1. Calculates the True Range (TR), Positive DM (+DM), and Negative DM (-DM)
* 2. Smooths these values using RMA (Wilder’s smoothing)
* 3. Derives +DI and -DI from smoothed values
* 4. Computes DX and smooths it to get ADX
* 5. Displays trend strength on chart
* ⚠️ Notes:
* - ADX only shows strength, not direction.
* - ADX > 20 generally means a trending market.
* - Works best as a trend filter or strength confirmation tool.
*
* Default Settings:
* - Length: 14
* - Threshold: 20
* - Source: Close

Strategic Dip AccumulatorDon't run out of cash while accumulating – with this indicator you will not buy every dip. You will buy just a few at a higher price, but many others will be bought at a lower price. This approach helps you conserve capital while positioning yourself to benefit from deeper market corrections.
Overview
This indicator is designed to help traders manage their entry points in volatile markets. By combining technical signals with dynamic take-profit levels that adjust to market volatility, it ensures your buying power is used efficiently without overcommitting on every minor dip. The oversold and overbought levels are derived using a blend of momentum indicators and pivot-based price levels, giving you a reliable view of potential support and resistance zones.
How It Works
The tool blends several components:
Timing and Range: You can set a specific backtest period to focus on the market conditions that matter most to your strategy.
Overbought/Oversold: Overbought signals are marked on the chart with red downward‑pointing triangles, while oversold signals are highlighted with green upward‑pointing triangles—making it easy to spot when the market is overextended in either direction.
Signal Lines: Visual cues on the chart mark key zones. The indicator identifies oversold conditions when momentum signals and price pivots indicate the market has dipped too far, and overbought conditions when these metrics suggest a potential reversal. Blue lines indicate buying opportunities, and red lines denote selling zones.
Dynamic Take Profit Levels: Profit targets adjust based on market volatility. In calm conditions, wider targets can capture larger moves; in volatile periods, tighter targets help secure gains more quickly.
Risk Management: The system limits exposure by triggering safety orders only when specific conditions are met, ensuring you maintain sufficient cash reserves.
Trading Tips
I discovered that using the indicator on the 1-hour chart could be more profitable, as it offers more frequent and timely signals without the noise of lower timeframes. This allows for better fine-tuning of entries and exits in fast-moving markets.
For crypto pairs that have outperformed Bitcoin during backtests, I've found promising results with assets like CRYPTOCAP:ADA , CRYPTOCAP:DOT , CRYPTOCAP:PEPE , CRYPTOCAP:SUI , GETTEX:TAO , CRYPTOCAP:XRP , and $ZRX. These pairs often exhibit stronger trends or more robust recoveries, which can enhance the performance of a dip-buying strategy. Feel free to share any other pairs you discover that outperform Bitcoin—collective insights can help everyone refine their strategies.
Conclusion
The Strategic Dip Accumulator offers a disciplined method for buying dips without depleting your cash reserves. By combining dynamic profit targets, clear entry signals, and robust risk management, this tool empowers you to make strategic decisions even in volatile markets. Use it on the 1-hour chart for more responsive signals, and consider pairing it with cryptocurrencies that have demonstrated strong performance compared to Bitcoin in your backtests for a more robust trading strategy.

Range Breakout Strategy (AM/PM)Range breakout for back-testing on any asset pair for a give time range, for mechanical trading.

M2 Global Liquidity (FX-Neutral)This indicator visualizes the global M2 money supply across major economies (China, USA, Eurozone, Japan, UK), converted into a common USD basis using fixed exchange rates as of January 31, 2020.
By applying constant FX rates, the indicator eliminates the influence of currency fluctuations, providing a "foreign exchange-neutral" view of global liquidity trends.

Anchored VWAPAnchored VWAP (AVWAP) by Quantica Trading is a multi-instance volume-weighted average price indicator that anchors to dynamic swing points (highest high / lowest low) within user-defined lookback windows.
Each AVWAP line is calculated using cumulative volume and price, producing a precise representation of market bias and positioning pressure. The script supports up to 4 independent AVWAP tracks, allowing for layered volume-based S/R analysis. Visibility conditions prevent overlap between AVWAP levels, preserving clarity across all timeframes.
🔧 Features:
4 independent AVWAP instances with configurable lengths
Anchors to ta.highestbars() and ta.lowestbars() dynamically
Uses plot.style_linebr for clean, non-continuous display
Color-coded by layer and visibility-aware logic
Ideal for trend confirmation, pullback validation, and volume-based S/R zones
Engineered for clarity and flexibility by Quantica Trading
🌐 www.quanticatrading.it

BotBeans Optimizer - MA CrosserBotBeans Optimizer - MA Crosser
This script allows you to:
1. Select up to 12 types of Moving Averages (MA)
2. Backtest 7 combinations of MA crossover strategy at a time with key metrics such as Net Profit%, Profit Factor, Win Rate%, Total Trades and Maximum Drowdown (Max DD)
3. Easy to define slow MA length by using SlowMultiplier. Slow MA length is calculated by fast MA length multiplied by SlowMultipleir.
4. Ability to plot MA lines, trading signals, slop loss and take profit levels for clarification
5. Risk Management is implemented. By default, risk only 2% for each trade.
6. The script uses 14 Average True Range (ATR) multiplied by ATRMultiplier to determine stop loss level
7. Take profit level is calculated by stop loss level multiplied by RiskRewardRatio.
8. Implemented with trading fee for more accurate backtest result

Tokyo Session by MarterMindZeroThis Script is about the Tokyo session, i use it befor to trade in London Session , it s focus only on Tokyo session.

MTFThis is a variation of the denosied MFI ma cross script that allows for reductionist trend following memeing, but taking it to the next level. This combines multiple ma's and finds local bottoms and tops to find the optimum trend to catch and ride along. PM for access.

Pinnacle Momentum Algo - OptimizedPinnacle Momentum Algo – Optimized
The Pinnacle Momentum Algo is a fully automated trend-following and momentum-based strategy, designed for high-accuracy entries and real-time execution on fast-moving markets like crypto, forex, and indices.
This version includes adaptive filters, dynamic volume confirmation, and non-repainting logic to reduce noise and false signals while preserving precision and profitability.
📊 Core Logic and How It Works
This strategy combines multiple indicators into one cohesive system, ensuring each entry is supported by trend, momentum, volume, and price action structure filters. Here's how the components work together:
1. 📈 Trend Detection (ZLEMA + Gradient Filter)
A Zero-Lag Exponential Moving Average (ZLEMA) is used as the baseline to determine trend direction.
A gradient-based slope check (using atan of ZLEMA delta) ensures the trend is not only present but accelerating.
The script colors bars green or red depending on the trend direction, giving traders visual feedback.
2. 💥 Momentum Filter (Smoothed CCI)
A ZLEMA-smoothed Commodity Channel Index (CCI) confirms bullish or bearish momentum.
Multi-bar momentum stacking (3-bar sequence) is required to avoid weak or choppy signals.
3. 📊 Volume Spike Confirmation
A dynamic volume spike filter uses median volume multiplied by a user-defined factor to confirm that the move is supported by above-average participation.
This reduces entries during manipulated or thin-volume moves.
4. 🧭 Vortex Trend Strength Filter
A modified Vortex Indicator confirms whether buyers or sellers dominate the trend.
The difference between VI+ and VI- must exceed a set threshold to allow entries, ensuring trend strength.
5. ⚠️ Wick Trap Avoidance
A wick trap detection filter blocks entries that follow long wicks in the opposite direction — this avoids fakeouts and liquidity sweeps.
🎯 Entry Conditions
A long or short trade is triggered only when all of the following align:
Trend is active and accelerating (ZLEMA + gradient).
Momentum confirms direction (CCI).
Volume spike confirms participation.
Vortex filter confirms strength.
No wick trap in the opposite direction.
Each trade is confirmed with a limit-based dual take profit system:
TP1: Partial profit (50%) at user-defined level.
TP2: Full close (100%) at extended target.
🔁 Exit Conditions
Take Profits: Two staged TP levels (TP1 = 50%, TP2 = 100%).
Weak Trend Exit: If the trend starts weakening (ZLEMA slope flip), any open trade is closed proactively.
No Same-Bar Entry/Exit: To ensure backtest reliability, trades cannot open and close on the same candle.
📌 Risk Management Features
process_orders_on_close = true prevents same-bar entry/exit errors.
Reentry after TP2 or trend exit is delayed by 1 full bar, preventing instant flip trades.
No stop loss is used — exits are controlled entirely via take-profits and trend filters.
Ideal for use on the 1-hour timeframe or higher.
📋 Dashboard
The built-in dashboard displays:
Current position (Long/Short/Flat)
Entry price
TP1 / TP2 status (Yes/No)
Bars since entry
Live win rate and profit factor
This enables fast and intuitive decision-making at a glance.
⚠️ Disclaimer
This script is for educational and informational purposes only. It is not financial advice or a recommendation to buy or sell any financial instrument. Use at your own risk. Trading involves substantial risk and is not suitable for every investor. Always do your own research and consult with a licensed financial advisor before making any trading decisions. Past performance is not indicative of future results.

Ezlin-Tabish-Trading-Codes-ALL-IndicatorALpha-1For education and Learnings only, no real trading, its a concept only

XAUUSD MTF Profit Hack (RR Enhanced)Profit Hack is a high-performance trading tool optimized for XAUUSD on the 5-minute timeframe, built to deliver clear entries, dynamic risk-to-reward visualization, and multi-timeframe trend filtering to eliminate noise and false signals.
💡 Key Features
✅ Smart Entry Logic – Signals are generated after crossover with ATR trailing stop, confirmed by MTF trend direction.
✅ Dynamic SL & TP System – SL is auto-placed below/above swing structure with customizable buffer. TP1, TP2, TP3 calculated at 2x, 3x, and 5x R:R levels.
✅ Trailing Stop (Optional) – Automatically updates SL to lock in profits as price moves in your favor.
✅ Risk-to-Reward Label – Real-time R:R stats for every setup.
✅ EMA 200 & RSI Dashboard – Visual guidance for trend strength and reversal zones.
✅ Multi-Timeframe Trend Filter – Aligns lower timeframe signals with higher timeframe direction (e.g., 1H EMA200).

SH Capital - OmniTrend v3: Adaptive Market StrategyOmniTrend Strategy v3 — Multi-Asset Adaptive Trend System
Overview
The OmniTrend Strategy is a multi-layered trend-following system designed to dynamically adapt to changing market conditions across cryptocurrencies, stocks, and traditional finance (TradFi) assets. It uses a blend of custom filtering mechanisms and dynamic trend logic to allocate positions only during favorable environments, while actively managing downside risk.
This script is intended for traders looking for a rules-based, momentum-driven approach that has been backtested across various asset classes and timeframes. It can be used for swing trading, position trading, or longer-term investing depending on the user’s timeframe selection.
Core Concepts & How It Works
OmniTrend incorporates several proprietary filters to determine both trend strength and risk conditions:
1. Trend Detection Layer
The system evaluates both long-term and medium-term directional bias using a custom trend detection logic inspired by moving average envelopes, price slope analysis, and filtered volatility signals.
This helps the system remain active during clean uptrends and avoid false signals during sideways or whipsaw conditions.
2. Equity Curve Risk Management
The system features an internal equity curve monitor that acts as a meta-filter. If recent performance trends lower (e.g., equity drawdown or stagnation), the strategy can de-risk by exiting open positions or reducing exposure.
3. Market Condition Awareness
A volatility regime filter is built in to avoid signal generation during choppy, low-volatility periods. This reduces overtrading and preserves capital.
Asset & Timeframe Flexibility
Default Assets: BTC, ETH, SOL
Compatible With: Cryptocurrencies, stocks, commodities, indices, and forex
Timeframes: Designed for daily use but also adaptable to 4H, 1W, and others depending on the trading horizon
All parameters—including the asset list, risk filters, scoring mechanics, and timeframe inputs—are fully adjustable by the user, enabling customization to individual strategies and risk profiles.
Performance Evaluation Tools
This strategy includes built-in visual and statistical tools to evaluate its performance over time:
Equity Curve Overlay
Maximum Drawdown Tracking
Risk-Adjusted Return Metrics (e.g., Sharpe and Sortino approximations)
Buy-and-Hold vs. Strategy Comparison Line
Disclaimer
This script is intended for educational and informational purposes only. It uses historical and real-time data to generate logic-based suggestions, but it does not guarantee future results. All trading involves risk, and users should always perform their own due diligence, use proper risk management, and consult a qualified advisor before making financial decisions. This is not financial advice.
SH Capital - OmniTrend v2: Adaptive Market StrategyOmniTrend Strategy v2 — Multi-Asset Adaptive Trend System
Overview
The OmniTrend Strategy is a multi-layered trend-following system designed to dynamically adapt to changing market conditions across cryptocurrencies, stocks, and traditional finance (TradFi) assets. It uses a blend of custom filtering mechanisms and dynamic trend logic to allocate positions only during favorable environments, while actively managing downside risk.
This script is intended for traders looking for a rules-based, momentum-driven approach that has been backtested across various asset classes and timeframes. It can be used for swing trading, position trading, or longer-term investing depending on the user’s timeframe selection.
Core Concepts & How It Works
OmniTrend incorporates several proprietary filters to determine both trend strength and risk conditions:
1. Trend Detection Layer
The system evaluates both long-term and medium-term directional bias using a custom trend detection logic inspired by moving average envelopes, price slope analysis, and filtered volatility signals.
This helps the system remain active during clean uptrends and avoid false signals during sideways or whipsaw conditions.
2. Equity Curve Risk Management
The system features an internal equity curve monitor that acts as a meta-filter. If recent performance trends lower (e.g., equity drawdown or stagnation), the strategy can de-risk by exiting open positions or reducing exposure.
3. Market Condition Awareness
A volatility regime filter is built in to avoid signal generation during choppy, low-volatility periods. This reduces overtrading and preserves capital.
Asset & Timeframe Flexibility
Default Assets: BTC, ETH, SOL
Compatible With: Cryptocurrencies, stocks, commodities, indices, and forex
Timeframes: Designed for daily use but also adaptable to 4H, 1W, and others depending on the trading horizon
All parameters—including the asset list, risk filters, scoring mechanics, and timeframe inputs—are fully adjustable by the user, enabling customization to individual strategies and risk profiles.
Performance Evaluation Tools
This strategy includes built-in visual and statistical tools to evaluate its performance over time:
Equity Curve Overlay
Maximum Drawdown Tracking
Risk-Adjusted Return Metrics (e.g., Sharpe and Sortino approximations)
Buy-and-Hold vs. Strategy Comparison Line
Disclaimer
This script is intended for educational and informational purposes only. It uses historical and real-time data to generate logic-based suggestions, but it does not guarantee future results. All trading involves risk, and users should always perform their own due diligence, use proper risk management, and consult a qualified advisor before making financial decisions. This is not financial advice.

Apex Predator Algo🔷 Apex Predator Algo – Trend, Volume, and Momentum Fusion Strategy
🔔 Supports WonderTrading, 3Commas, Binance Alerts – with Multi-Exchange Compatibility
📌 Overview
Apex Predator Algo is an advanced trend-following and momentum-based trading strategy designed specifically for crypto markets. It fuses multiple non-repainting components to form a precision trading system with real-time alerts and dashboard analytics.
This script is not just a mashup, but a carefully optimized integration of:
🔹 TEMA (Triple EMA) for adaptive trend filtering
🔹 RMI (Relative Momentum Index) for directional trend confirmation
🔹 Vortex Indicator with dynamic strength & threshold filtering
🔹 ROC + CCI for real-time momentum alignment
🔹 Volume Spike Detection using SMA-based volatility confirmation
🔹 TP1/TP2 take-profit logic
🔹 Trend Weakness Detection for early exits
🔹 Integrated Bot-Ready Multi-Exchange Alerting System
🔹 Fully responsive performance dashboard (TP Hits, Win Rate, PnL Metrics)
⚙️ Core Components Explained
1. Trend Engine (TEMA + RMI Combo)
TEMA (Triple EMA) is used to identify fast-reacting trend direction.
RMI, a momentum-weighted version of RSI, provides confirmation of trend continuation vs. reversal, ensuring entries are taken with trend.
2. Momentum & Strength Filters
Rate of Change (ROC) and CCI validate trade timing.
This ensures entries only occur when momentum is increasing in the direction of the trend.
3. Vortex Trend Strength + Slope
The Vortex system detects trend strength by comparing +VI and -VI flows.
A threshold ensures only meaningful breakouts trigger trades.
(Optional: Can include Vortex slope filter for even more precision.)
4. Volume Spike Confirmation
Prevents false breakouts by ensuring volume is above a dynamically adjusted SMA average.
Acts as a real-time volatility gate to reduce drawdowns.
5. Take-Profit System (TP1/TP2)
TP1 closes 50% of position.
TP2 closes 100% – fully exits the trade.
Avoids dependency on stop-losses, while allowing scaling out profitably.
6. Early Exit Logic
Exits trades on trend weakening before reversal – reducing drawdowns.
Ensures all entries/exits are clean: no same-bar reversal allowed.
📊 Real-Time Dashboard
The script includes a customizable floating dashboard showing:
Current position (Long, Short, Flat)
Entry price
TP1 and TP2 status
Bars held since entry
Live win rate (%)
Profit Factor
Dashboard can be:
Toggled on/off
Repositioned (Top Right, Bottom Left, etc.)
Resized (Tiny to Huge text)
🔔 Alert System (Bot Ready)
Alerts fire once per bar close, and include:
ENTER-LONG
ENTER-SHORT
EXIT-LONG
EXIT-SHORT
All alert messages are editable for use with:
✅ WonderTrading
✅ 3Commas
✅ Binance Auto-trading bots
✅ Any webhook-supported trading platform
✅ 📣 How to Use
Apply to any 1H crypto chart (AVAX/USDT, BTC/USDT, etc.)
Enable alerts using the provided alert() messages
Monitor the real-time dashboard to track performance
Customize dashboard, thresholds, and TP levels as needed
⚠️ TradingView Publishing Disclaimer
Disclaimer: This strategy is for educational purposes only and does not constitute financial advice. Trading involves substantial risk and is not suitable for every investor. Past performance is not indicative of future results. Use at your own risk.
✅ Originality Justification (for PineCoders)
The script combines non-repainting versions of TEMA, RMI, CCI, Vortex, and Volume filters.
Each component plays a distinct role in trend validation, entry precision, and exit optimization.
It integrates a multi-level profit-taking system, an adaptive exit engine, and a bot-compatible alert structure, which makes this more than a mashup — it's a complete system designed for real-time crypto automation.
The inclusion of a fully featured dashboard adds transparency and real-time trade statistics, making this highly useful for live trading and backtesting performance optimization.

Binary Auction P&L - 3-6-9 Rule with 1-2-4-8-7-5 Sequence I made this for my own personal use based on 3-6-9 rule , auction theory and 1-2-4-8-7-5 sequence.
feel free to provide feedback ...good luck.... and remember boys and girls.... "If you don't belong....don't be long"
****not trading advice, not professional advice, not advisory in any manner whatsoever.****

20 & 50 EMA + ATR, TR & DATRIndicator Name: 20 & 50 EMA + ATR, TR & DATR
This custom indicator combines trend and volatility analysis into a single tool, helping you make smarter trading decisions with fewer indicators on your chart.
---
1. 20 & 50 Exponential Moving Averages (EMAs)
EMA 20 (Blue Line): A short-term trend indicator that reacts quickly to price changes.
EMA 50 (Orange Line): A medium-term trend indicator that smooths out more of the noise.
How to Use:
Bullish signal: EMA 20 crosses above EMA 50
Bearish signal: EMA 20 crosses below EMA 50
Use crossovers or distance between EMAs to confirm trends or potential reversals
---
2. True Range (TR)
Definition: The greatest of the following:
High - Low
High - Previous Close
Previous Close - Low
Use: Shows how much the asset moved during the candle. Useful for understanding raw price movement.
---
3. Average True Range (ATR)
Definition: The average of the True Range over a 14-bar period
Line color: Red (shown in the status line above your chart)
How to Use:
High ATR = High volatility
Low ATR = Low volatility
Use ATR to help determine stop-loss and take-profit levels, or to avoid low-volatility periods
---
4. Daily ATR (DATR)
Definition: ATR calculated from the daily timeframe, regardless of the chart's current timeframe
Line color: Green (also shown in the status line)
How to Use:
Know how much the asset typically moves in a full day
Helps intraday traders set realistic targets or detect when the market is unusually quiet or active

Multi-Token Analysis TableIntroduction
The "Multi-Token Analysis Table" is an advanced TradingView indicator designed for cryptocurrency traders managing multiple tokens simultaneously. It dynamically analyzes up to 39 cryptocurrencies, evaluating their performance across various metrics to identify the best trading opportunities. The indicator presents a comprehensive ranking system in a clean, organized table format, allowing traders to make data-driven decisions based on market conditions, trend strength, and relative performance.
Key Features
Multi-Token Analysis: Simultaneously analyzes up to 39 different cryptocurrencies, with customizable token selection.
Dynamic Scoring System: Evaluates tokens across multiple performance metrics and assigns weighted scores to determine the best opportunities.
Market Regime Detection: Identifies whether tokens are in trending or mean-reverting states to optimize strategy selection.
Adaptive Recommendation Engine: Provides clear "best token" recommendations based on overall scores and trending conditions.
Score Threshold Filter: Allows setting minimum score requirements for recommendations, defaulting to cash positions when criteria aren't met.
Previous Signal Tracking: Displays the previous bar's recommendation to help track changes in market conditions.
Visual Performance Indicators: Uses color-coding to instantly identify relative strength and weakness among tokens.
Customizable Weighting: Fine-tune the importance of different metrics to match your trading strategy.
How It Works
The indicator employs a sophisticated analysis methodology across multiple dimensions:
Token Selection: Up to 39 tokens can be monitored simultaneously, organized in four separate groups for easier management. Each token is automatically assigned a color for visual distinction.
Metric Calculation: For each selected token, the indicator calculates several key metrics:
Market Regime: Determines if a token is in a trending or mean-reverting state using specialized market regime algorithms.
Performance Metrics: Calculates momentum, volatility, relative strength, and other custom metrics.
Composite Scoring: Combines individual metrics weighted according to user preferences to generate a total score for each token.
Recommendation Engine:
The highest-scoring token is identified as the "best token" candidate.
If trending filters are enabled, the system prioritizes tokens in trending regimes.
When no tokens meet the score threshold, a "Cash" recommendation is generated.
Previous recommendations are tracked and displayed for comparison.
Table Display:
Token Table: Lists all selected tokens with their individual metric scores and total scores.
Summary Table: Provides an overview with the current best token recommendation, previous signal, and critical performance data.
Ratio Analysis: Shows comparative performance between tokens for deeper market insights.
Backtest Summary: Tracks hypothetical performance based on the recommendations.
Signal Logic: When a bar is confirmed, the system stores the current recommendation to be displayed as the previous signal on the next bar, ensuring accurate tracking of changing market conditions.
Conclusion
The "Multi-Token Analysis Table" is an essential tool for cryptocurrency traders managing diverse portfolios. By quantifying and ranking multiple tokens simultaneously, it eliminates guesswork and brings data-driven clarity to the decision-making process. The indicator is particularly valuable during volatile market conditions, helping traders identify which tokens are showing relative strength and are best positioned for potential gains. Its flexible configuration makes it suitable for various trading styles, from day trading to longer-term position management.
Disclaimer
This indicator is provided for informational and educational purposes only and does not constitute financial advice. Trading cryptocurrencies involves substantial risk, and users should perform their own analysis before making trading decisions. The creator is not liable for any financial outcomes resulting from its use.
