Weekly Analysis of the S&P 500 (ES) - Sep 22 - 26 - Fundamental Bias
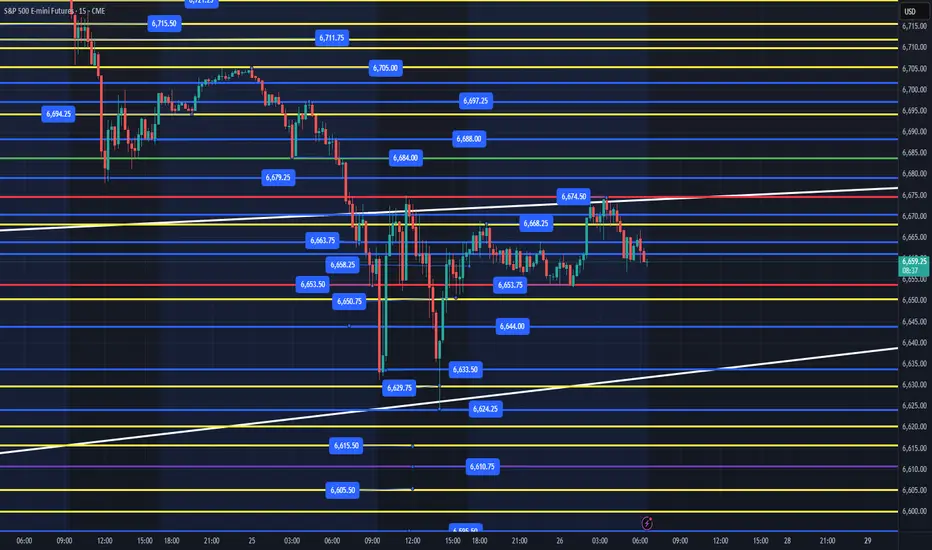
So, here's the deal: we're still on an upward trend, but price is pushing against a "ceiling cluster" just above us. Expect a slow climb for now until something changes.
As long as we stay above 6,700–6,705, dip buyers will probably step in and try to push things back up to the 6,73x/6,75x r
Related futures

Day 35 — Trading Only S&P Futures | SPX Hits RecordDay 35 of Trading Only S&P Futures is complete!
Today was one of the smoother days. We opened with a bullish structure signal and a clean backtest near the MOB. From there, the market ripped higher. I didn’t catch the full move but I did nail the initial push, which gave me space to step away for m

Day 36 — Trading Only S&P Futures | -$1175 LossDay 36 of Trading Only S&P Futures is in the books — and it wasn’t pretty.
I started the session well, up about +$100, but got greedy and overleveraged at 6728 thinking Powell’s comments would flip the market bullish. I was wrong. That single forced trade cost me the day, dropping -$1175.
To make

ES (E-mini S&P 500) — Plan for Wed Sep 24Fundamentals (tomorrow, ET)
04:00 Germany IFO Business Climate (often moves European risk tone during London).
10:00 U.S. New Home Sales (Aug) — official Census schedule lists New Residential Sales at 10:00 a.m..
10:30 EIA Weekly Petroleum Status Report (standard time each Wed).
13:00 U.S. 5-Year No

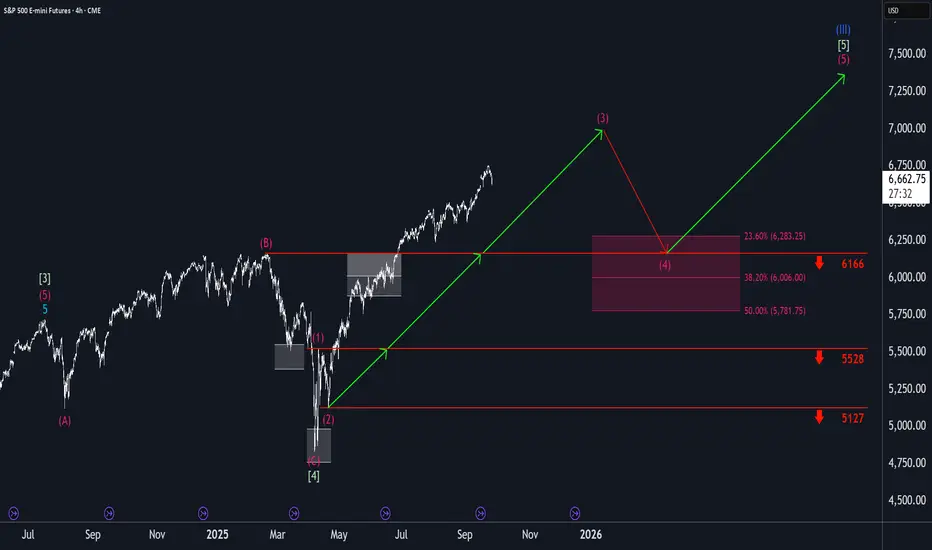
S&P 500: Rally Stalls, but Further Upside LikelyMidweek, the S&P 500 struggled to find the momentum needed to extend its climb within the magenta wave (3). However, our primary outlook still calls for this wave to reach a somewhat higher high. Afterward, wave (4) of the same color is expected to take over, guiding the index into the magenta Targe
What is Gamma?🔎 What is Gamma?
Gamma Exposure (GEX) measures how much and how fast an option’s Delta changes as the underlying moves.
Why does this matter? Because when options shift, market makers must hedge, and their hedging can move markets.
Gamma = the “acceleration” of Delta.
Large gamma zones = areas wher

ES - Sand ThemeThis is the ES chart with a custom color theme. Orange for down candles and Dark Blue for up candles. With a dark text.

ES - September 26th - Daily Trade PlanSeptember 26th - 6:30am EST
*Before reading this trade plan, IF, you did not read yesterdays, or the weekly trade plan take the time to read it first! (You can see both posts in the related publication section) *
If my posts provide quality information that has helped you with your trading journey
S&P 500 (ES1!): Bullish! Buy The Dip! Keep It Simple!Welcome back to the Weekly Forex Forecast for the week of Sept 22 - 26th.
In this video, we will analyze the following FX market: S&P 500 (ES1!)
The S&P500 is still bullish, and there is no reason to short it.
Wait for price to pullback to a +FVG, and then look for valid buy setups on your ent

Day 37 — Trading Only S&P Futures | +$1,559 Bearish BreakdownDay 37 of Trading Only S&P Futures is wrapped up with a strong green day — finishing +$1,559.
The session didn’t start smooth. Running on 4 hours of sleep, I accidentally put in a buy order instead of a sell order at the 1-min MOB level. That mistake cost me some early profits, but once I flipped s

See all ideas
Summarizing what the indicators are suggesting.
Neutral
SellBuy
Strong sellStrong buy
Strong sellSellNeutralBuyStrong buy
Neutral
SellBuy
Strong sellStrong buy
Strong sellSellNeutralBuyStrong buy
Neutral
SellBuy
Strong sellStrong buy
Strong sellSellNeutralBuyStrong buy
A representation of what an asset is worth today and what the market thinks it will be worth in the future.
Displays a symbol's price movements over previous years to identify recurring trends.
Frequently Asked Questions
The current price of Micro E-mini S&P 500 Index Futures is 6,696.50 USD — it has risen 0.55% in the past 24 hours. Watch Micro E-mini S&P 500 Index Futures price in more detail on the chart.
The volume of Micro E-mini S&P 500 Index Futures is 1.08 M. Track more important stats on the Micro E-mini S&P 500 Index Futures chart.
Open interest is the number of contracts held by traders in active positions — they're not closed or expired. For Micro E-mini S&P 500 Index Futures this number is 128.93 K. You can use it to track a prevailing market trend and adjust your own strategy: declining open interest for Micro E-mini S&P 500 Index Futures shows that traders are closing their positions, which means a weakening trend.
Buying or selling futures contracts depends on many factors: season, underlying commodity, your own trading strategy. So mostly it's up to you, but if you look for some certain calculations to take into account, you can study technical analysis for Micro E-mini S&P 500 Index Futures. Today its technical rating is strong buy, but remember that market conditions change all the time, so it's always crucial to do your own research. See more of Micro E-mini S&P 500 Index Futures technicals for a more comprehensive analysis.