S&P 500 Outlook for next weekSo we are in a wild time going into next month. There could be some wild movements the first Quarter. We have been flying high for a while & there could be a possible major correction coming. Let's keep an eye on the charts see how this plays out.
Micro E-mini S&P 500 Index Futures
6,013.75USDD
−35.75−0.59%
As of today at 17:21 GMT
USD
No trades
MES1! trade ideas


es1! retests 5kes1! appears poised for a larger move down, based on the smaller timeframe count .
this leads me to believe that es1! has entered a larger fourth wave. historically, these waves take an average of 2 months to play out and typically result in a 12% decrease from the high before completing.
wave 4's often retrace back into the territory of the prior degree's wave 4, and i expect this one to follow suit.
pay attention to the green trendline i've drawn on the chart,,, it serves as a solid guide for where i anticipate es1! to find a bottom. dipping below the trendline is acceptable, provided we don't see any weekly candle closes beneath it. even if a weekly candle does close below, a strong recovery the following week, such as a gap-up scenario , could invalidate the breakdown.
there’s not much else to add here, as the chart is fairly straightforward. keep an eye on the trendline and monitor weekly closes for confirmation.
💸


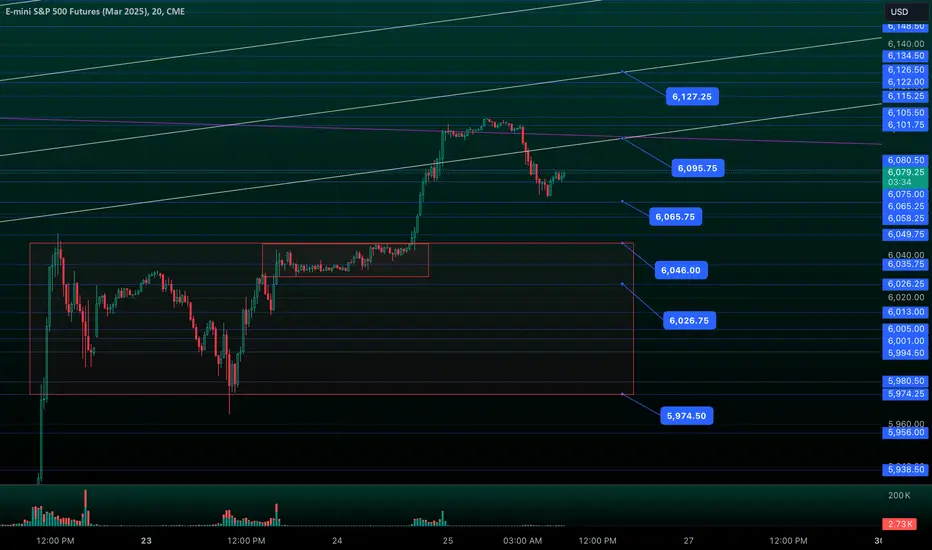
ES/SPX Morning Update Dec 27thThis week has been about one level in ES: 6097-6100. It’s been my target since last Friday and remains a major resistance. Bulls control above it, while bears dominate below, aligned with the FOMC resistance. Yesterday, we hit the level and sold off.
As of now:
• 6060-6066 = support.
• Bulls must reclaim 6078 to rally to 6087, then 6097-6100.
• 6060 fails, and we dip to 6043-46.


SPX ETF TRADING CHART 2025Happy New Year! Here' is the chart I will be swing trading SPX ETFs showing with TV scripts so you don't have to code. I use the DAILY MES1! price chart and position in the aftermarket or premarket with an SPX ETF. Here is what I do. After the close --- 1. Golden Cross (50SMAX200SMA) shows the "trend". Only trade with the "trend" (only long since April 2023!). 2. Use Accurate Swing ("7") to enter the trade. 3. Exit the Trade when MES price CLOSES below HMA ("16")

ES/SPX Morning Update Dec 26thLevels are acting very precise in ES. Since Monday’s failed breakdown at 5980, the sole target for this rally was 6100 (FOMC backtest), hit to the tick at close Tuesday and followed by a solid short since
As of now:
• 6066 is weak support.
• Bulls need to reclaim 6078-80 to rally toward 6095+.
• If 6066 fails, selling could resume back down to backtest where we took off from Tuesday at 9am
S&P500 ES ready to enter the buy zone based on my new indicatorTL:DR I created a new price + volume based indicator that sold BEFORE the most recent crash, and bought BEFORE the most recent rise. If this indicator is any indication of the near future, then it's showing a near future rise in S&P500 since there is an active BUY signal. Below is a more detailed description of the indicator I created which is typically based on simple price and volume action.
I designed a new indicator that I dub the "Money Flow by NHBprod" indicator. It helps to EASILY identify potential trade opportunities without over complicating the process. In short, MFI typically uses volume and pricing data in its calculations which are 2 important keys to consider when trading. However, the actual indicator typically lags behind actual trade opportunities. I heavily modified the standard MFI so that this new indicator can be used to easily see where to buy and where to sell. It also has built in alerts which can be used to automate trading.
How It Works
The indicator calculates the Money Flow Index (MFI), but is heavily modified both in terms of calculations, performance, and output. The indicator computes the MFI using the closing price and a user-defined length. A linear regression moving average is applied to the MFI, smoothing out fluctuations to provide clear signals. Then we have Buy & Sell Zones which are Customizable thresholds that are used to determine when to buy and when to sell. When the moving average crosses into the buy zone, green highlights appear on the chart; similarly, red highlights appear when it enters the sell zone.
Alerts: Integrated alert conditions notify traders when the moving average enters either zone, ensuring they never miss a trade opportunity.
Simplifies Analysis: By focusing on the MFI's moving average and clearly marking significant zones, the indicator eliminates noise and simplifies market analysis.
Enhanced Visualization: The green and red highlighted zones on the pricing chart offer an intuitive, at-a-glance understanding of market conditions.

ES / MES Daily Dec 25For Thursday's session, spike rules should be applied. Above 6099.50 we can see 6118.75 the top of the above remaining open single print followed by the daily expected high 6125 and FOMC high 6137.5. Below the spike base, 6090, we can see the two new single prints created on Tuesday 6070.75-6075 and 6060-6068.50. Tuesday's VAL is 6062 with the daily expected low at 6071. 6070-72 will be an important area to hold tomorrow as weakness can push it down to Monday's spike top at 6043.
Holding below Tuesday's spike top could try shorts down to 91 and 80.

Decoding the BTC-ES Correlation During FOMC Meetings1. Introduction
The Federal Open Market Committee (FOMC) meetings are pivotal events that significantly impact global financial markets. Traders across asset classes closely monitor these meetings for insights into the Federal Reserve’s stance on monetary policy, interest rates, and economic outlook.
In this article, we delve into the correlation between Bitcoin futures (BTC) and E-mini S&P 500 futures (ES) during FOMC meetings. Focusing on the window from one day prior to one day after each meeting, our findings reveal that BTC and ES exhibit a positive correlation 63% of the time. This relationship offers valuable insights for traders navigating these volatile periods.
2. The Significance of Correlations in Market Analysis
Correlation is a vital tool in market analysis, representing the relationship between two assets. A positive correlation indicates that two assets move in the same direction, while a negative correlation implies they move in opposite directions.
BTC and ES are particularly intriguing to study due to their distinct market segments—cryptocurrency and traditional equities. Observing how these two assets interact during FOMC meetings provides a window into macroeconomic forces that affect both markets.
The key finding: BTC and ES are positively correlated 63% of the time around FOMC meetings. This suggests that, despite their differences, both markets often react similarly to macroeconomic developments during these critical periods.
3. Methodology and Data Overview
To analyze the BTC-ES correlation, we focused on a specific timeframe: one day before to one day after each FOMC meeting. Daily closing prices for both assets were used to calculate correlations, providing a clear view of their relationship during these events.
The analysis includes data from multiple FOMC meetings spanning several years. The accompanying charts—such as the correlation heatmap, table of BTC-ES correlations, and line chart—help visualize these findings, highlighting the periods of positive and negative correlation.
Contract Specifications:
o E-mini S&P 500 Futures (ES):
Contract Size: $50 x S&P 500 Index.
Minimum Tick: 0.25 points, equivalent to $12.50.
Initial Margin Requirement: Approximately $15,500 (subject to change).
o Bitcoin Futures (BTC):
Contract Size: 5 Bitcoin.
Minimum Tick: $5 per Bitcoin, equivalent to $25 per tick.
Initial Margin Requirement: Approximately $112,000 (subject to change).
These specifications highlight the differences in notional value and margin requirements, underscoring the distinct characteristics of each contract.
4. Findings: BTC and ES Correlations During FOMC Meetings
The analysis reveals several noteworthy trends:
Positive Correlations (63% of the time): During these periods, BTC and ES tend to move in the same direction, reflecting shared sensitivity to macroeconomic themes such as interest rate adjustments or economic projections.
Negative Correlations: These occur sporadically, suggesting that, in certain scenarios, BTC and ES respond differently to FOMC announcements.
5. Interpretation: Why Do BTC and ES Correlate?
The observed correlation between Bitcoin futures (BTC) and E-mini S&P 500 futures (ES) around FOMC meetings can be attributed to several factors:
Macro Sensitivity: Both BTC and ES are heavily influenced by macroeconomic variables such as interest rate decisions, inflation expectations, and liquidity changes. The FOMC meetings, being central to these narratives, often create synchronized market reactions.
Institutional Adoption: The increasing participation of institutional investors in Bitcoin trading aligns its performance more closely with traditional risk assets like equities. This is evident during FOMC events, where institutional sentiment towards risk assets tends to align.
Market Liquidity: FOMC meetings often drive liquidity shifts across asset classes. This can lead to aligned movement in BTC and ES as traders adjust their portfolios in response to policy announcements.
This correlation provides traders with actionable insights into how these assets might react during future FOMC windows.
6. Forward-Looking Implications
Understanding the historical correlation between BTC and ES during FOMC meetings offers a strategic edge for traders:
Hedging Opportunities: Traders can use the BTC-ES relationship to construct hedging strategies, such as using one asset to offset potential adverse moves in the other.
Volatility Exploitation: Positive correlation periods may signal opportunities for trend-following strategies, while negative correlation phases could favor pairs trading strategies.
Risk-On/Risk-Off Cues: The alignment or divergence of BTC and ES can act as a barometer for market-wide sentiment, aiding decision-making in other correlated assets.
Future FOMC events could present similar dynamics, and traders can leverage this data to refine their approach.
7. Risk Management Considerations
While correlations provide valuable insights, they are not guaranteed to persist. Effective risk management is crucial, particularly during volatile periods like FOMC meetings:
Stop-Loss Orders: Ensure every trade is equipped with a stop-loss to cap potential losses.
Position Sizing: Adjust position sizes based on volatility and margin requirements for BTC and ES.
Diversification: Avoid over-concentration in highly correlated assets to reduce portfolio risk.
Monitoring Correlations: Regularly assess whether the BTC-ES correlation holds true during future events, as changing market conditions could alter these relationships.
A disciplined approach to risk management enhances the probability of navigating FOMC volatility successfully.
8. Conclusion
The correlation between Bitcoin futures (BTC) and E-mini S&P 500 futures (ES) around FOMC meetings highlights the interconnected nature of modern financial markets. With 63% of these events showing positive correlation, traders can glean actionable insights into how these assets react to macroeconomic shifts.
While the relationship between BTC and ES may fluctuate, understanding its drivers and implications equips traders with tools to navigate market volatility effectively. By combining historical analysis with proactive risk management, traders can make informed decisions during future FOMC windows.
When charting futures, the data provided could be delayed. Traders working with the ticker symbols discussed in this idea may prefer to use CME Group real-time data plan on TradingView: www.tradingview.com - This consideration is particularly important for shorter-term traders, whereas it may be less critical for those focused on longer-term trading strategies.
General Disclaimer:
The trade ideas presented herein are solely for illustrative purposes forming a part of a case study intended to demonstrate key principles in risk management within the context of the specific market scenarios discussed. These ideas are not to be interpreted as investment recommendations or financial advice. They do not endorse or promote any specific trading strategies, financial products, or services. The information provided is based on data believed to be reliable; however, its accuracy or completeness cannot be guaranteed. Trading in financial markets involves risks, including the potential loss of principal. Each individual should conduct their own research and consult with professional financial advisors before making any investment decisions. The author or publisher of this content bears no responsibility for any actions taken based on the information provided or for any resultant financial or other losses.


2024-12-23 - priceactiontds - daily update - sp500Good Evening and I hope you are well.
tl;dr
sp500 e-mini futures - Neutral. We stayed below Friday’s high but bulls had a really bullish close. Until they get a strong move above 6050, I lean neutral. Above 6050 there is no more resistance until 6100. Bears something below 5965 but for now they could be very happy with any daily close below 6000.
current market cycle: trading range
key levels: 5950 - 6050
bull case: Very strong close by the bulls. Year end rally is on if they get follow through above 6050 tomorrow. A measured move up from Friday’s rally would bring us 6230+. For now we have a clear bull wedge which leads perfectly to 6100 tomorrow.
Invalidation is below 5800.
bear case: Bears did ok until the breakout above 6030. Now they have a do or die moment again to keep the market below 6050 or they need to cover because market could go all the way up to 6200 or higher.
Invalidation is above 6050.
short term: Neutral. Very bullish close but bulls need follow through above 6050 tomorrow. If they get it, we probably won’t stop until 6100 or higher. Market is in balance around 6000.
medium-long term - Update from 2024-12-22: Ultimately 5200-5300 in 2025. Again, rough guess as of now and since we have not seen a strong first bear leg, these targets are the lowest I am willing to give an honest outlook about. If bears surprise and we see a huge leg down to 5500, we will go much lower for the second and third leg.
current swing trade: Nope
trade of the day: Selling 6030 before EU open and buying 5985 because of the head & shoulders bottom (head was the low 5965) after US open on the 5m tf.

ES/MES Weekend Prep Dec 22Last week saw major liquidation with late longs going into FOMC. Thursday was an inside day followed by weakness in the overnight session going to into PCE Friday morning.
Going into this week, I will use Friday's range as a guide. Friday's low during RTH 5898.50 as the halfback of the PCE data release candle, Election Day RTH low and November VAL, including the after hours wick on FOMC. Friday's high is at a LVN from last week and #2 and #3 single prints that were formed from the FOMC sell.
If we trade lower first, focus should be placed around 5966, and 5945-5931. 5966 as last week's VAL and 45-31 as Thursday's Spike Down. Buyers will want to defend this or risk Friday's low. A look below and fail of the spike bottom 5931.75 and Friday's low should be considered for new longs.
Further weakness will see London's low from Friday morning followed by the election gap fill at 5813.25. This would also align with Friday's range 50% extension. If we trade down here, buyers most likely will appear at or near the gap fill. So shorts should be mostly covered by then.
If we trade higher first, buyer will need to build support above Friday's high and target the single prints above 6091.50-6118.50. 6079.25 is the FOMC event candle low. Acceptance above opens FOMC high at 6137.25. Further acceptance opens 6186 - the back-adjusted ATH.
I would be cautious of a look above and fail of Friday's high triggering shorts. If so, shorts will need back below 6000 and 5982 to pick up steam.
FOMC Vwap: 5981.25
FOMC Event Candle: 6079.25-6137.25
Spike 12/19 - Base: 5945.5, bottom: 5931.75
Weekly Expected Move: 90pts - 5907 / 6086
Dec 23 Expected Move: 47pts - 5949 / 6044
Expected moves are based on what the options market has priced in as implied risk for that period. There is a 68% chance price remains within that range by the following close. If price moves outside the range, it is common to revert and close back within.
