BankNifty _ Bearish HarmonicBearish Bat harmonic pattern is visible on the short-term chart. The break above 50,000 will negate the pattern while 48888-48500 can be on cards in the expiry week.
Market indices

Spx500/USD , analysis on multi timeframe Hello traders,
It's my opinion on the S&P 500 across multiple timeframes. After analyzing the daily chart, I have observed that the price is currently in a strong bullish trend. However, based on candle formations, I believe that the price is likely to complete a pullback and reach the Daily Order Block zone at 5200.
Considering the dominant trend in the daily timeframe, i see this as a good opportunity to sell in the lower timeframes. It's important to emphasize the importance of implementing effective money management strategies to manage risk.
Remember that trading the S&P 500 or any other financial instrument involves risks, and it's important to make informed decisions based on thorough research, risk assessment, and your own risk tolerance.
If you have any further questions or need clarification, feel free to ask.

S&P 500 Now S&P 500 is going higher and higher because to many technology companies are growing up now day .

S&P 500 Now S&P 500 is going higher and higher because to many technology companies are growing up now day .

BNF - 1 hr Bullish Chart View!Good rebound indication given by the market today.
Entered into the stream!

[Early Warning] Dow Jones showing weakness, will dip furtherTVC:DJI has formed 5 waves down in daily timeframe. Unless this 5 wave structure turn into a 7 or 11 wave (counter-trend) formation, this is likely a beginning of short term down-trend.
Now, this down trend could play out in different ways, 2 of the most likely options are highlighted in the chart. This 5 wave decline could be a larger ABC (or WXY/WXYXZ) which is highlighted in red color. Or worse, this could be beginning on a larger trend down and this is just minor wave i of larger 1. This is highlighted in blue color.
Both of these alternatives are bearish in nature. We can expect a bounce which might go around 61.8% (~39,500) though it doesn't need to be that much.
Just remember that for this scenario to play out, this 5 wave structure shouldn't change into a 7 or 11 wave structure as mentioned above.

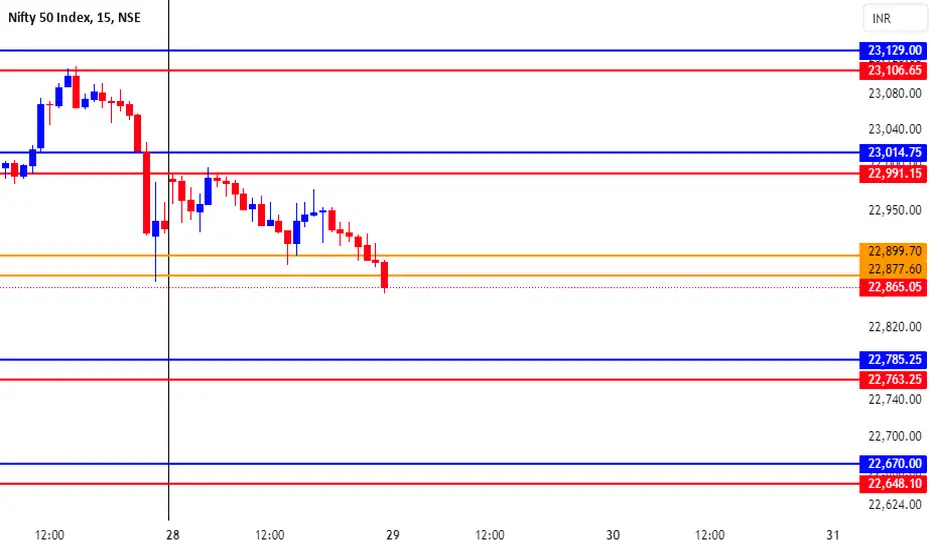
NIFTY TRADING LEVELS FOR 29-05-2024Explanation:
This is a very useful trading system. This means that you should not take a trade blindly, but rather that there is another confirmation to take the trade you can use this for perfect entry and perfect exit
This trading opportunity is based on volume, previous price, and price range , are included
Entry/Exit point's:
- It has very easy entry and exit points
- In this pair of lines with two colors are given (RED AND BLUE)
- In this the blue line is used to take long entry and the red line is used to take short entry (But it is all based on a more conformation from your trading plan)
Stop Loss/Take Profit:
Stop Loss
- According to this, if you take a long trade, its stop loss will be the red line just below ( A trade can exit either when the price crosses the red line or the 5 minute candlestick crosses the red line. (This can be done according to your preference) )
- A short entry should use the opposite rules to a long entry
Take Profit
-When you take a long entry according to the profit to be booked is on the next red line above. ( Or if there are other reasons, it can be a safe exit )
- Opposite rules for booking profit on long entry are to book profit on short trade. ( The blue line above is the stop loss of short entry )
Timeframe:
According to this, the time frame you should use while taking trades is 5 minutes time frames . (5 minute time frame works well in this)
Risk Disclaimer:
Trading carries significant risk and is not suitable for all traders. You may lose some or all of your capital in a matter of minutes or hours. Market conditions can change rapidly, and prices can move against you quickly. You may not always be able to exit at a favorable price, and you may be required to hold a position overnight, exposing yourself to additional risk. Day trading involves high risk, high leverage, and high stakes, and you should only trade with funds you can afford to lose. Please carefully consider your financial situation, risk tolerance, and trading objectives before engaging in day trading.
Engagement:
Share your insights, ask questions, and learn from others in the community. Whether you're a seasoned pro or just starting out, we're all in this together.
What's your take on the current market conditions? Which trading strategies are working for you? Let's discuss and help each other grow as traders!
Comment below and let's get the conversation started!
Original Content:
This trading setup is the result of my own innovation and expertise, and is not based on any publicly available information or third-party systems. It is a reflection of my dedication to developing a competitive edge in the markets.
BANK-NIFTY TRADING LEVELS FOR 29-05-2024Explanation:
This is a very useful trading system. This means that you should not take a trade blindly, but rather that there is another confirmation to take the trade you can use this for perfect entry and perfect exit
This trading opportunity is based on volume, previous price, and price range , are included
Entry/Exit point's:
- It has very easy entry and exit points
- In this pair of lines with two colors are given (RED AND BLUE)
- In this the blue line is used to take long entry and the red line is used to take short entry (But it is all based on a more conformation from your trading plan)
Stop Loss/Take Profit:
Stop Loss
- According to this, if you take a long trade, its stop loss will be the red line just below ( A trade can exit either when the price crosses the red line or the 5 minute candlestick crosses the red line. (This can be done according to your preference) )
- A short entry should use the opposite rules to a long entry
Take Profit
-When you take a long entry according to the profit to be booked is on the next red line above. ( Or if there are other reasons, it can be a safe exit )
- Opposite rules for booking profit on long entry are to book profit on short trade. ( The blue line above is the stop loss of short entry )
Timeframe:
According to this, the time frame you should use while taking trades is 5 minutes time frames . (5 minute time frame works well in this)
Risk Disclaimer:
Trading carries significant risk and is not suitable for all traders. You may lose some or all of your capital in a matter of minutes or hours. Market conditions can change rapidly, and prices can move against you quickly. You may not always be able to exit at a favorable price, and you may be required to hold a position overnight, exposing yourself to additional risk. Day trading involves high risk, high leverage, and high stakes, and you should only trade with funds you can afford to lose. Please carefully consider your financial situation, risk tolerance, and trading objectives before engaging in day trading.
Engagement:
Share your insights, ask questions, and learn from others in the community. Whether you're a seasoned pro or just starting out, we're all in this together.
What's your take on the current market conditions? Which trading strategies are working for you? Let's discuss and help each other grow as traders!
Comment below and let's get the conversation started!
Original Content:
This trading setup is the result of my own innovation and expertise, and is not based on any publicly available information or third-party systems. It is a reflection of my dedication to developing a competitive edge in the markets.

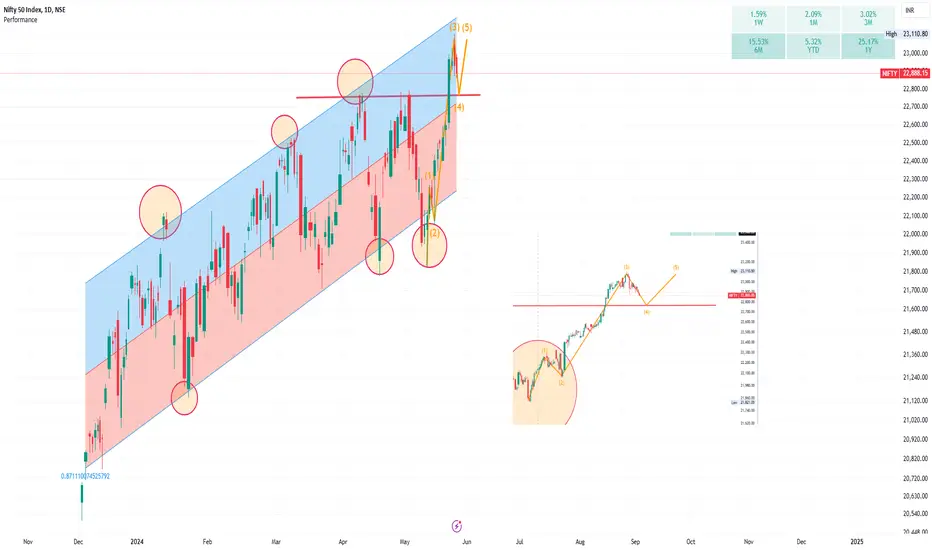
NIFTY - SHORT TERM AND LONG TERM WAVE COUNT AND TRENDNIFTY - SHORT TERM AND LONG TERM WAVE COUNT AND TREND
About short term trend and counts
Right now Nifty index is unfolding minor wave iv as i projected in my previous post
price can kiss 40HEMA or will take support at 38.2% of 50% of Fibonacci retracement level. and after general parliamentary election high probabilities of unfolding minor wave - v, kindly note here minor wave - v can be extended (guide line)
About long term trend and counts
After unfolding minor wave - v - corrective wave of primary cycle will start
after covid 19 wave - I of Cycle is extended in 13 primary wave and speedy - it means wave 3 will be slow and lethargic. after correction of wave IV of prime cycle - wave V of Cycle will start. and we can see top of wave V in 2027.
educational post
Regards

NIFTYBANK: Long on Confidence, Short on Hope!Well, the words could have been swapped, but the confidence took precedence.
The break of 48500-700 area, which now becomes the line in sand for the move, and also the make-or-break line.
Short term frames, have evening star, three-line bearish engulfing (almost near), broader markets looking weak, overseas cues negative, nothing going in favour.
The large bull candle that we printed, the current candle (one may be quick to point is grave stone doji), but would wait for the previous resistance, which is now supported to act.
Also, the RED horizontal line falls in between 0.5-0.618% of retracement of the entire fall, holds some importance.
The RBI dividend story, somewhat given the eroding knock, but don't think will vanish so quickly. It is rare to see NIFTY going down, when NIFTYBANK is not showing that much bearishness, and those occasions, the fall unfolds in metals, energy or some other sector in tandem, like IT.
While stand alone basis this looks much better than many sectors, the breadth has taken a knock. One has to wait and watch how the market unfolds.
Support 48850-48680-48550
Supply 49350-49650-49900

DXY - Dollar Setup for Huge TumbleA Wave 3 down is just starting now and can move the dollar index down to 90. Continue loading up on commodities.

NIFTY: Last Mile, Eroding Smile?Yesterday we cautioned the impending resistance line drawn from the candle tops, it has worked reasonably well.
The damage to the internals is larger than what the NIFTY50 is showing, there are near no liquid trades in the MIDCAP NIFTY beyond the near term and month end expiry, all volumes focussed on NIFTY and NIFTYBANK.
Clearly the unhedged mid and small caps is large and remains cause for worry. Many sectoral indexes have shown weakness emerging, it is very clear profit taking or sell the break mode is slowly unfolding, thus the eroding smile. This has nothing to do on the electoral outcomes yet.
The large Bull candle that broke the 22800, with NIFTYBANK posting 1000 points single day remains the lifeline.
This also now remains the midpoint of the regression line drawn while the R2 is not healthy, but that is what the best fit line as of now. Any tweaking moves much below the 87 plus.
A corrective fall towards the 22800 can do lots of good for bulls too, as the euphoria gets unwound and there is healthy base forming, also this forms part of the smaller degree wave 4 base.
How it unfolds post that is any one's guess. A close below 22730-780 brings the doubts in the recent up move.
German Inflation and Richman FED manufacturing are the data to watch. Markets slowly lost the rate cut hopes, focus on rate cut moves to Europe for now.
Supports 22818-22780-22738-22680
Supply 22920-22950-23000-23108
Huge rejection at 71%, Does signal bullish for DXy.Dxy, rejected 71% today. Dxy didnt break my trend line as well. Does this means dxy is now bullish. I will wait and see. Everything flipped today. This does signal dxy wants to go north. Let me know what you think in the comments.

Could US30 bounce from here?Price is falling towards a support level which is an overlap support that aligns with the 61.8% Fibonacci retracement and could bounce from this level to our take profit.
Entry: 38,606.09
Why we like it:
There is an overlap support level which lines up with the 61.8% Fibonacci retracement.
Stop loss: 38,120.14
Why we like it:
There is a pullback support level which is slightly below the 78.6% Fibonacci retracement.
Take profit: 39,072.18
Why we like it:
There is an overlap resistance level which aligns with the 23.6% Fibonacci retracement.
Please be advised that the information presented on TradingView is provided to Vantage (‘Vantage Global Limited’, ‘we’) by a third-party provider (‘Everest Fortune Group’). Please be reminded that you are solely responsible for the trading decisions on your account. There is a very high degree of risk involved in trading. Any information and/or content is intended entirely for research, educational and informational purposes only and does not constitute investment or consultation advice or investment strategy. The information is not tailored to the investment needs of any specific person and therefore does not involve a consideration of any of the investment objectives, financial situation or needs of any viewer that may receive it. Kindly also note that past performance is not a reliable indicator of future results. Actual results may differ materially from those anticipated in forward-looking or past performance statements. We assume no liability as to the accuracy or completeness of any of the information and/or content provided herein and the Company cannot be held responsible for any omission, mistake nor for any loss or damage including without limitation to any loss of profit which may arise from reliance on any information supplied by Everest Fortune Group.

NIFTY 2HRI Am Not SEBI Registered Analyst. All Post and Levels Posting is only for educational and knowledge purpose. I Am not responsible for your any kind of loss or profit.
No Claim, All Rights Reserved.‼️

NiKKEi the Empire who saw Tomorrow 100 years ago
the OG in quantitative zero cost coupons and negative rates
with subways in the 1930s
touchscreens ai robotics in the 70s
and rise of gaming in the 80s
still is a decade ahead among developed countries
and 100 years++ ahead the rest of the emerging economies

Falling towards 61.8% Fibonacci support?Dow Jones (US30) falling towards the pivot which is an overlap support and could potentially bounce to the 1st resistance.
Pivot: 38,561.70
1st Support: 38,394.17
1st Resistance: 39,041.44
Risk Warning:
Trading Forex and CFDs carries a high level of risk to your capital and you should only trade with money you can afford to lose. Trading Forex and CFDs may not be suitable for all investors, so please ensure that you fully understand the risks involved and seek independent advice if necessary.
Disclaimer:
The above opinions given constitute general market commentary, and do not constitute the opinion or advice of IC Markets or any form of personal or investment advice.
Any opinions, news, research, analyses, prices, other information, or links to third-party sites contained on this website are provided on an "as-is" basis, are intended only to be informative, is not an advice nor a recommendation, nor research, or a record of our trading prices, or an offer of, or solicitation for a transaction in any financial instrument and thus should not be treated as such. The information provided does not involve any specific investment objectives, financial situation and needs of any specific person who may receive it. Please be aware, that past performance is not a reliable indicator of future performance and/or results. Past Performance or Forward-looking scenarios based upon the reasonable beliefs of the third-party provider are not a guarantee of future performance. Actual results may differ materially from those anticipated in forward-looking or past performance statements. IC Markets makes no representation or warranty and assumes no liability as to the accuracy or completeness of the information provided, nor any loss arising from any investment based on a recommendation, forecast or any information supplied by any third-party.

US DOLLAR INDEX(DXY): Bearish Outlook The Dollar Index is currently experiencing a downward trend on a global scale. After reaching a new low earlier this month.
The market has begun a corrective movement within a bearish flag pattern. Yesterday, the price broke below its support and closed below it.
It is likely that the pair will continue to drop and reach a new low soon. The target range is between 104.33 and 104.07.

SPX Head and ShouldersPotential H&S pattern forming on the S&P 500. If we break below the neckline look out below! This is a contrary bear prediction to my other election cycle bull post.

CHART BREAKDOWN US30: Key Levels, Targets!Brief Description🖊️:
The chart provides insights into critical market levels, emphasizing an essential demand zone (low-risk buy zone) spanning from 18330 to 18315, respectively, are highlighted.
Things I Have Seen👀:
Important Demand Zone🟢: Identified between 18330 and 18315, serving as a low-risk buy.
Bullish Targets📈:
18400: Possible retracement area.
18500: Possible retracement area.
18580: Possible retracement area.
18670: Area with a lot of liquidity.
What's Important Now❗
Currently, the crucial approach is to wait and observe the price action at this level. We need to assess how the market reacts before considering any decisive moves. Stay observant and responsive to real-time developments in the market.

Nifty down side moveNifty is showing bearish singe of down fall the market is over bought so nifty can retest


