DAX-STRENGTH LEADERDax: Weekly clean 1-2 RTM , Our Bullish confirmation pattern, expecting extended Run
Previous daily high broken and expecting volume at US open
Note:Bullish
Market indices

US100 bias short Bearish indications:
Major resistance respected.
Double top formation.
Bearish divergence.
Bearish engulfer candle from resistance in 1 hr time frame.
Trade plan bias short @ 18804
SL:1885
TP1:18751
TP2:18706


S&P500 Buy opportunity on 4H.The S&P500 index is recovering from the last Higher Low at the bottom of the Channel Up, which even broke below the 4H MA50 (blue trend-line) last Thursday for the first time since May 02. The 4H MACD is forming the first Bullish Cross since that very same date, which was also a recovery sequence after a bottom on the Channel Up pattern.
Having also breached into the Ichimoku Cloud and rebounded, we expect a similar short-term rally towards the top (Higher Highs trend-line) of the Channel Up. That rally's first stop was on the 1.618 Fibonacci extension. As a result, our current Target is 5400 (marginally below the 1.618 Fib).
-------------------------------------------------------------------------------
** Please LIKE 👍, FOLLOW ✅, SHARE 🙌 and COMMENT ✍ if you enjoy this idea! Also share your ideas and charts in the comments section below! This is best way to keep it relevant, support us, keep the content here free and allow the idea to reach as many people as possible. **
-------------------------------------------------------------------------------
💸💸💸💸💸💸
👇 👇 👇 👇 👇 👇

US30 BUYBased on what price action is showing, the market is s currently showing a reversal chart pattern plus RSI divergence.
If the current 2hr candle closes bullish engulfing, I'll be taking a buy from the current price range.

BANK-NIFTY TRADING LEVELS FOR 27-05-2024Explanation:
This is a very useful trading system. This means that you should not take a trade blindly, but rather that there is another confirmation to take the trade you can use this for perfect entry and perfect exit
This trading opportunity is based on volume, previous price, and price range , are included
Entry/Exit point's:
- It has very easy entry and exit points
- In this pair of lines with two colors are given (RED AND BLUE)
- In this the blue line is used to take long entry and the red line is used to take short entry (But it is all based on a more conformation from your trading plan)
Stop Loss/Take Profit:
Stop Loss
- According to this, if you take a long trade, its stop loss will be the red line just below ( A trade can exit either when the price crosses the red line or the 5 minute candlestick crosses the red line. (This can be done according to your preference) )
- A short entry should use the opposite rules to a long entry
Take Profit
-When you take a long entry according to the profit to be booked is on the next red line above. ( Or if there are other reasons, it can be a safe exit )
- Opposite rules for booking profit on long entry are to book profit on short trade. ( The blue line above is the stop loss of short entry )
Timeframe:
According to this, the time frame you should use while taking trades is 5 minutes time frames . (5 minute time frame works well in this)
Risk Disclaimer:
Trading carries significant risk and is not suitable for all traders. You may lose some or all of your capital in a matter of minutes or hours. Market conditions can change rapidly, and prices can move against you quickly. You may not always be able to exit at a favorable price, and you may be required to hold a position overnight, exposing yourself to additional risk. Day trading involves high risk, high leverage, and high stakes, and you should only trade with funds you can afford to lose. Please carefully consider your financial situation, risk tolerance, and trading objectives before engaging in day trading.
Engagement:
Share your insights, ask questions, and learn from others in the community. Whether you're a seasoned pro or just starting out, we're all in this together.
What's your take on the current market conditions? Which trading strategies are working for you? Let's discuss and help each other grow as traders!
Comment below and let's get the conversation started!
Original Content:
This trading setup is the result of my own innovation and expertise, and is not based on any publicly available information or third-party systems. It is a reflection of my dedication to developing a competitive edge in the markets.

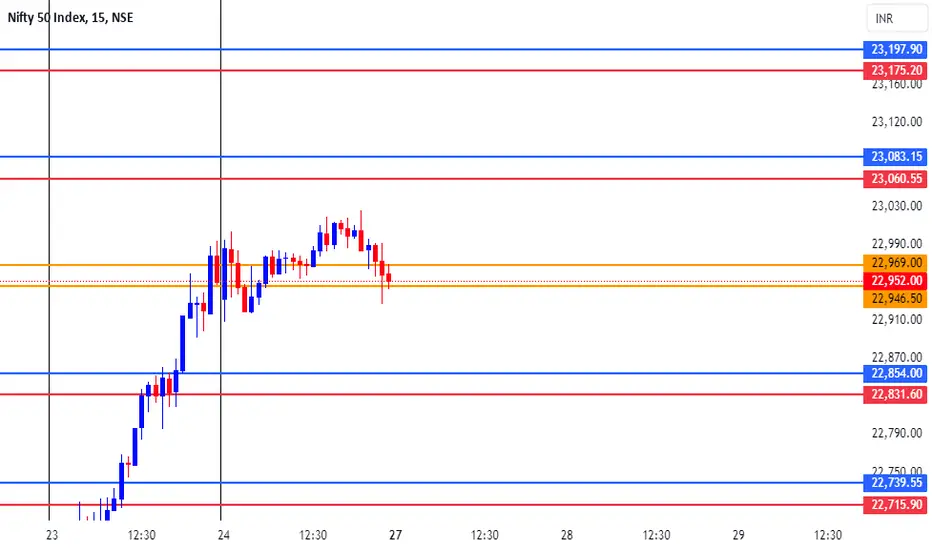
NIFTY TRADING LEVELS FOR 27-05-2024Explanation:
This is a very useful trading system. This means that you should not take a trade blindly, but rather that there is another confirmation to take the trade you can use this for perfect entry and perfect exit
This trading opportunity is based on volume, previous price, and price range , are included
Entry/Exit point's:
- It has very easy entry and exit points
- In this pair of lines with two colors are given (RED AND BLUE)
- In this the blue line is used to take long entry and the red line is used to take short entry (But it is all based on a more conformation from your trading plan)
Stop Loss/Take Profit:
Stop Loss
- According to this, if you take a long trade, its stop loss will be the red line just below ( A trade can exit either when the price crosses the red line or the 5 minute candlestick crosses the red line. (This can be done according to your preference) )
- A short entry should use the opposite rules to a long entry
Take Profit
-When you take a long entry according to the profit to be booked is on the next red line above. ( Or if there are other reasons, it can be a safe exit )
- Opposite rules for booking profit on long entry are to book profit on short trade. ( The blue line above is the stop loss of short entry )
Timeframe:
According to this, the time frame you should use while taking trades is 5 minutes time frames . (5 minute time frame works well in this)
Risk Disclaimer:
Trading carries significant risk and is not suitable for all traders. You may lose some or all of your capital in a matter of minutes or hours. Market conditions can change rapidly, and prices can move against you quickly. You may not always be able to exit at a favorable price, and you may be required to hold a position overnight, exposing yourself to additional risk. Day trading involves high risk, high leverage, and high stakes, and you should only trade with funds you can afford to lose. Please carefully consider your financial situation, risk tolerance, and trading objectives before engaging in day trading.
Engagement:
Share your insights, ask questions, and learn from others in the community. Whether you're a seasoned pro or just starting out, we're all in this together.
What's your take on the current market conditions? Which trading strategies are working for you? Let's discuss and help each other grow as traders!
Comment below and let's get the conversation started!
Original Content:
This trading setup is the result of my own innovation and expertise, and is not based on any publicly available information or third-party systems. It is a reflection of my dedication to developing a competitive edge in the markets.
SPX: PCE shaped sentimentDuring the week the S&P 500 experienced a mix of gains and losses, reflecting a generally volatile period. The index opened the week at 5.305 and closed it at 5.304. Highest weekly level reached was 5.335 in Thursday's trading session. Although the index gained only 0.03% for the week, still, Friday's trading session brought 0.7% in daily earnings, supported mostly by Nvidia. Namely the shares of this company surged 2.6% on Friday, as frenzy over AI and earnings of this company still holds investors sentiment.
Aside from confidence in AI, the market continues to be concerned over the next move of the Fed when interest rates are in question. This sentiment continues to bring volatility to the S&P 500 and will be a significant factor also in the future period. The CME FedWatch Tool is now showing that traders are currently pricing around 50% probability that the Fed will cut interest rates in September. In a week ahead, US PCE data for April will be posted, which might bring back some higher volatility on the market. Still, despite concerns over inflation, the S&P 500 remained relatively resilient in the past period, supported by the tech companies. There is a high probability that this will be the case also in the near future.

FOREX WEEKLY FORECASTWEEKLY FOREX FORECAST NEWS UPDATE
Introduction:
Welcome back to our Weekly Forex Forecast, where we delve into the intricacies of the currency markets to provide you with valuable insights and predictions for the week ahead. In this edition, we'll be closely examining the Dollar Index, GBPUSD, EURUSD, and USDJPY pairs, analyzing key technical and fundamental factors to help you navigate the turbulent waters of the forex market.
Dollar Index (DXY):The Dollar Index, which measures the value of the US dollar against a basket of major currencies, has been experiencing some fluctuations in recent weeks. The index's performance is influenced by various factors, including economic data, monetary policy decisions, and geopolitical events. As we head into the new week, investors will be closely watching for any developments on the inflation front, as well as any signals from the Federal Reserve regarding interest rate hikes. Although we have been constantly Bullish on this since the beginning of this year, on the Daily Time frame, the market has left us a chart pattern reversal, which is the inversted Head & Shoulders, which also do mean that we have once again, been convinced that the Bulls should keep this market going higher admidst the ups and downs in the market today.

Levels discussed on 27th May Livestream27th May
DXY: Consolidating along 104.70 level, could retrace to 104.90 (50% retracement level), looking to continue lower to support 104.50
NZDUSD: Buy 0.6150 SL 25 TP 65
AUDUSD: Buy 0.6666 SL 20 TP 60
USDJPY: Buy 157.30 SL 30 TP 65
GBPUSD: Break previous high, Buy 1.2765 SL 20 TP 50 or double top Sell 1.2745 SL 20 TP 60
EURUSD: Sell 1.0850 SL 15 TP 45
USDCHF: Sell 0.9125 SL 30 TP 50
USDCAD: Look for reaction at 1.3610
Gold: Wait for retracement to complete, Below 2325 could trade down to 2300

#SPX500
It is still in an upward trend, according to the moving guard, it is expected to touch the areas

DJI will go up after a short correction to 36,000During the pandemic the DJIA has a big fall from 29,687 to about 18,200.
The Dow just hit 39,000 which is a key Fibonacci level, ( it is 61% above 29,687 when measuring from 18,200).
At this point the Dow will correct to about 36,000. This is about 61% below the a wave from the b wave.
From there the dow will go to about 43,000, completing a 5 wave structure in the monthly chart and a set up for a possible major correction in the coming months.

US30 trade idea us30 has lost bearish momentum for the time being. I'd like to see the inefficiency/imbalance get filled in and around 38870. With the occurrence of such I will be targeting 39740 as there is some liquidity (equal highs) resting there. Then only will I be more comfortable selling this market again. Let me know your thoughts in the comments :)
Happy trading..

SP500. Weekly trading levels 27 - 31.05.2024During the week you can trade from these price levels. Finding the entry point into a transaction and its support is up to you, depending on your trading style and the development of the situation. Zones show preferred price ranges WHERE to look for an entry point into a trade.
If you expect any medium-term price movements, then most likely they will start from one of the zones.
Levels are valid for a week, the date is in the title. Next week I will adjust the levels based on new data and publish a new post.
! Please note that brokers have a difference in quotes, take this into account when trading.
The history of level development can be seen in my previous posts. They cannot be edited or deleted. Everything is fair. :)
----------------------------------------------
I don’t play guess the direction (that’s why there are no directional arrows), but zones (levels) are used for trading. We wait for the zone to approach, watch the reaction, and enter the trade.
Levels are drawn based on volumes and data from the CME. They are used as areas of interest for trading. Traded as classic support/resistance levels. We see the reaction to the rebound, we trade the rebound. We see a breakout and continue to trade on a rollback to the level. The worst option is if we revolve around the zone in a flat.
Do not reverse the market at every level; if there is a trend movement, consider it as an opportunity to continue the movement. Until the price has drawn a reversal pattern.
Don't forget to like Rocket and Subscribe!!! Feedback is very important to me!


correction It is expected that the continuation of the correction process will advance to the support ranges and specified time. Then it is expected that a trend change will take place and we will witness the beginning of an upward trend

A technical look at the stock index of Saudi companies, TASIThe TASI index is trading at high levels and is gradually approaching its historical peak.
The possibility of seeing a decrease in the price on the monthly frame exists, but it is not confirmed yet.
The daily frame indicates a close visit to the white lines, but the orange levels are also imp
ortant and must be visited. TADAWUL:TASI

KEEP SELLING US30!!!!!!!!!!US30 have completed over 4000pips move in our favor from our first entry now price just grabbed liquidity from the fvg zone and heading to create new lows am going in on a sell from this zone till my target is completed.........

Nifty approaching crusial area! 📍Nifty (TF : 4H)
Resilience from the bulls lift #nifty non stop from 21800 to 23050 📈
It's seems that market is working within channel formed on 4H TF. Break & sustain above marked area will lead to further upside towards 23600 - 23800
Any resistance may bring index towards 22750 / 22500

Will BANKNIFTY will hit 49000 ?BANKNIFTY broke the weekly resistance after a month and holding above indicates further upmove. holding above 47750 will lead further move upto 48300, 48570, 48730.
Reversal support 47050 - 47350

SMALLCAP INDEX - EXPECTED PATHLook at previous history, I believe there is still good amount of steam left in Smallcap Index stock. I think we will see ATH in September above 12000 and we can extend upto 12500 12600 zones and then sharp fall will be expected in October/November which can be good opportunity for last leg rally towards 15000 zones...
My advice for next 2 months will be to accumulate stocks for next big leg of upside...
My Top picks at current market price or in any dips:-
Strides Pharma: 414 - Expected Target 900
United Drilling Tools: 213 - Expected Target 450 540
EPL: 196 - Expected Target 290
Aegis Logistics: 355 (Holding period 3 years) - 900 plus irrespective of what market does
Vaibhav Global: 385

Heading into 61.8% Fibonacci resistance?DE40 is rising towards the pivot and could potentially reverse to the 1st support.
Pivot: 18,773.31
1st Support: 18,539.97
1st Resistance: 18,929.08
Risk Warning:
Trading Forex and CFDs carries a high level of risk to your capital and you should only trade with money you can afford to lose. Trading Forex and CFDs may not be suitable for all investors, so please ensure that you fully understand the risks involved and seek independent advice if necessary.
Disclaimer:
The above opinions given constitute general market commentary, and do not constitute the opinion or advice of IC Markets or any form of personal or investment advice.
Any opinions, news, research, analyses, prices, other information, or links to third-party sites contained on this website are provided on an "as-is" basis, are intended only to be informative, is not an advice nor a recommendation, nor research, or a record of our trading prices, or an offer of, or solicitation for a transaction in any financial instrument and thus should not be treated as such. The information provided does not involve any specific investment objectives, financial situation and needs of any specific person who may receive it. Please be aware, that past performance is not a reliable indicator of future performance and/or results. Past Performance or Forward-looking scenarios based upon the reasonable beliefs of the third-party provider are not a guarantee of future performance. Actual results may differ materially from those anticipated in forward-looking or past performance statements. IC Markets makes no representation or warranty and assumes no liability as to the accuracy or completeness of the information provided, nor any loss arising from any investment based on a recommendation, forecast or any information supplied by any third-party.

Falling towards 50% Fibonacci support?Dow Jones (US30) is falling towards the pivot which has been identified as a pullback support and could bounce to the 1st resistance which acts as an overlap resistance.
Pivot: 38,957.67
1st Support: 38,574.85
1st Resistance: 39,413.17
Risk Warning:
Trading Forex and CFDs carries a high level of risk to your capital and you should only trade with money you can afford to lose. Trading Forex and CFDs may not be suitable for all investors, so please ensure that you fully understand the risks involved and seek independent advice if necessary.
Disclaimer:
The above opinions given constitute general market commentary, and do not constitute the opinion or advice of IC Markets or any form of personal or investment advice.
Any opinions, news, research, analyses, prices, other information, or links to third-party sites contained on this website are provided on an "as-is" basis, are intended only to be informative, is not an advice nor a recommendation, nor research, or a record of our trading prices, or an offer of, or solicitation for a transaction in any financial instrument and thus should not be treated as such. The information provided does not involve any specific investment objectives, financial situation and needs of any specific person who may receive it. Please be aware, that past performance is not a reliable indicator of future performance and/or results. Past Performance or Forward-looking scenarios based upon the reasonable beliefs of the third-party provider are not a guarantee of future performance. Actual results may differ materially from those anticipated in forward-looking or past performance statements. IC Markets makes no representation or warranty and assumes no liability as to the accuracy or completeness of the information provided, nor any loss arising from any investment based on a recommendation, forecast or any information supplied by any third-party.
