Market indices

SPx (it looks bullish)SPX500 New Forecast
The price is expected to attempt to reach the resistance level at 5360. It may correct down to 5304 before resuming its bullish trend.
As long as the price remains above 5320 and 5304, the bullish trend is likely to continue towards 5360. If the price breaks through this level, it is anticipated to reach 5390 and potentially 5480.
Pivot Line: 5313
Resistance Levels: 5360, 5390, 5480
Support Levels: 5293, 5266, 5226
Today’s expected trading range is between the support 5281 and the resistance 5360.

DOW JONES ,US30 INDEXUa30 index formed a clear bearish divergence and break higher low
it seems downword trend we make an entry on break of lower low
it has a great potential

possibility of uptrend It is expected that the current correction process will end in the specified resistance ranges and we will see the beginning of the correction process.
If the index crosses the red resistance range, the start of an upward trend is likely

SET will down and up in Q2'24Hello all,
As you see in graph this time is the opportunity for collect!!!

possibility of correction It is expected that the index will enter the correction process and advance to the specified support range. Then, according to the behavior of the indicator in the support range, the continuation of the movement process will be according to the specified paths.

Why longer term charts are importantI took a look at the weekly gold/silver ratio and noticed a few significant patterns. For example, there was a notable acceleration downward following the break of a 3-year uptrend a couple of weeks ago. Additionally, there is support at the 74.65/63 level, which has been in place since January 2022.
This observation reminded me of the importance of examining long-term charts, regardless of your trading time frame. Longer-term charts provide essential context and clarity that short-term charts often lack.
Why everyone should be looking at longer term charts:
1. Identifying Trends
Long-term charts help in identifying significant trends that might not be visible in short-term data.
2. Smoothing Out Volatility
Short-term data is often noisy, with frequent fluctuations that can obscure the underlying pattern. Long-term charts smooth out this volatility, providing a clearer picture of the fundamental movement and reducing the influence of random, short-term events.
3. Contextualizing Current Movements
Long-term charts place current price or economic movements in a broader context. This helps investors and analysts understand whether a recent change is part of a larger trend or not.
4. Historical Comparisons
These charts allow for comparisons with past periods, making it possible to identify cycles, recurring patterns, and historical precedents. This historical perspective can be invaluable for forecasting future movements and making informed predictions.
5. Assessing Risk and Reward
By examining long-term performance, investors can better assess the potential risks and rewards of an investment. Understanding how an asset has performed over various market cycles helps in evaluating its stability and growth potential.
6. Avoiding Emotional Bias
Short-term market movements can evoke strong emotional responses, leading to impulsive decisions. Long-term charts provide a more detached view, helping investors stay focused on long-term objectives and avoid reacting to short-term market noise.
Conclusion
In summary, long-term charts offer a comprehensive view that is critical for understanding trends, reducing noise, contextualizing current events, making historical comparisons, assessing risk, avoiding emotional decisions, developing strategies, and analysing economic cycles. They are an indispensable tool for anyone involved in financial markets or economic analysis, providing the clarity and perspective necessary for informed decision-making.
Disclaimer:
The information posted on Trading View is for informative purposes and is not intended to constitute advice in any form, including but not limited to investment, accounting, tax, legal or regulatory advice. The information therefore has no regard to the specific investment objectives, financial situation or particular needs of any specific recipient. Opinions expressed are our current opinions as of the date appearing on Trading View only. All illustrations, forecasts or hypothetical data are for illustrative purposes only. The Society of Technical Analysts Ltd does not make representation that the information provided is appropriate for use in all jurisdictions or by all Investors or other potential Investors. Parties are therefore responsible for compliance with applicable local laws and regulations. The Society of Technical Analysts will not be held liable for any loss or damage resulting directly or indirectly from the use of any information on this site.


SPX SELLS @ 5321Heavy looking supply at this price. Looking for equities to have a drop and consolidation before moving higher once more.

Expectations for the US Dollar Market from May to August 2024Expectations for the US Dollar Market from May to August 2024
May to Early July 2024:
The US dollar is anticipated to remain strong, with the market reaching a high of 108.459 by July 1, 2024.
First Three Days of July 2024:
After peaking, the dollar is expected to decline, potentially dropping to 105.785 by July 25, 2024.
Stay updated with our forecasts to navigate the US dollar market effectively.
Keywords: US dollar forecast, USD market trends, dollar strength 2024, USD predictions, currency market analysis, USD outlook May to August 2024, forex trading, financial forecasts, USD high and low, July 2024 USD predictions.
Feel free to share your thoughts and join the conversation on the US dollar market outlook.

SPX STORYAs you can see, the S&P 500 index closed at a higher price on March 2nd, 2008 than it did on August 1st, 1996. However, it closed at a lower price on March 1st, 2000 than it did on March 2nd, 2008. This means that if you had bought the S&P 500 index on August 1st, 1996, you could have bought it again on March 2nd, 2008 for slightly cheaper. However, if you had bought it on March 1st, 2000, you would have had to wait until February 2013 to see a new market high.
The S&P 500 index has seen a strong upward price movement since breaking out of a 13-year consolidation period in February 2013. The index made a new post dot-com high in February 2013, and then went on to make an all-time high of 4818 in January 2022. As of June 2023, the index is trading at 4282.
I understand that many people believe the S&P 500 index is in a bubble and that we are just experiencing a bear market rally. However, it is important to consider all possibilities, as the market can be humbling. Investors not too long ago lived through a period of over a decade where they saw no new market highs, but were able to buy stocks at a lower price after 13 years.

Possible Weekly Trend Of VIX 🦋 Butterfly 🦋 the detail is shown in the above Idea.
I made this Idea based on Candlestick Analysis and Harmonic pattern using Fibonacci tools.
in beginning of year 2023
Butterfly of VIX Daily Trend Fall from 29 to 14 .
at last weeks of year 23
buyers crab rose to reach 23.
in year 2024
Butterfly of VIX Weekly Trend probably Will Fall from 19 to 7.

US30 SELL NOW!!!!!Am still having a sell bias on us30 we took out the sell side liquidity and a retest is made from the premium fvg am still going in on a sell right now till 37800 is completed
JOIN AND ENJOY

DXY IDEAThis is just simple trading idea draw into chart using labels and lines. Please use it as educational purpose and you are free to modify any

#Nazdaq #Nas US100 #StockmarketNASDAQ Analysis: Two Plans
Plan A:
For Plan A, I am waiting for the price to break down below $18,720. I need to see a 15-minute candle close below this level. After this breakdown, I will look for a pullback to the $18,726-$18,730 zone. At this point, I plan to open a short position, targeting the first support level at $18,680 and the next support level at $18,650. I expect a price correction to occur in this scenario.
Plan B:
In Plan B, if the price at $18,720 shows strong buyer support, I anticipate the start of an uptrend. The first target zone for this uptrend is $18,790-$18,800, and if momentum continues, the next targets are $19,000 and $19,050.
Additionally, within the next 9 hours, the FOMC meeting is scheduled, which could significantly impact the chart and cause high volatility. Traders should be cautious and prepared for increased market excitement.

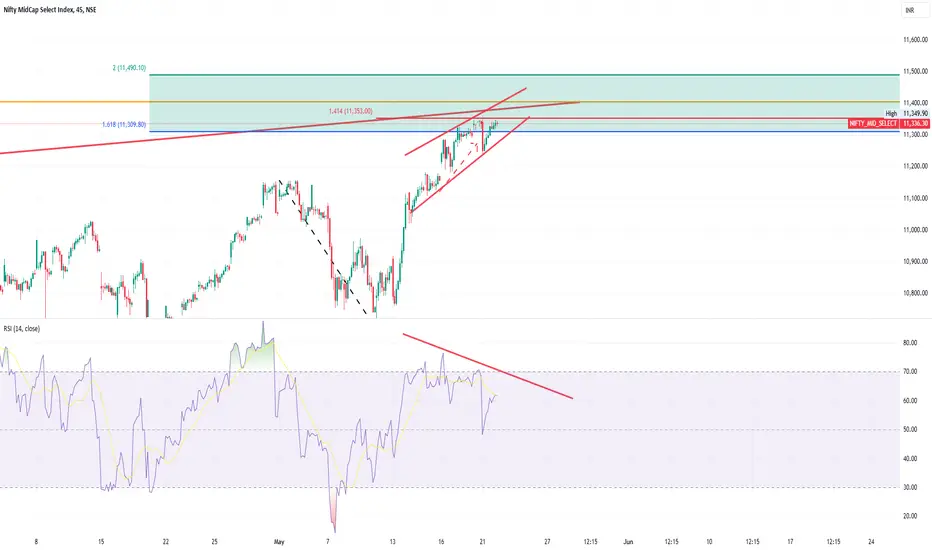
NIFTYSELECTMIDCAP: Warning or WarmingWe did post this elsewhere, cluster of moving averages, confronting the space.
The incremental negative divergence is the hurdle.
What is more important, occasional profit taking is far healthier than what is understood.
In that sense, we are due for one. Yesterday fall is it warming for bigger fall, or the rise post the fall warming for a rise.
One has to wait and see. Suffice to note, the confluence of the supply zone, the exponential moves in many of its components, negative divergence. Clearly for incremental moves this can unfold a challenging place.
That said market may stretch before the correction, that can be far severe and swift.
11200-11400 can suffice near term range.
NIFTYBANK: Hopes at the top, Fears at the Bottom.This one so far completely doing the contrary.
1. You see good news on the banking sector, many politicians and the corporates in social media tweet how the sector is growing.
2. Good results, mergers conclude.
3. The proof is the Private Sector banks are underperforming, while PSU on the rampage.
4. CASA driving, or the cause driving.
5. In sum move past 48300 hopes rekindle, moves below 47700 fears re-surface.
It is also closing the count of wave 3 of the smaller degree, we may have to flag them as end of wave A. While break above 48300 confirms the wave 3 in smaller degree in motion. Clearly not a place to dabble with larger stake.
That sums up 47700-48300or 47500 (being the 0.5% retracement of the entire fall)

NIFTY: Monsoon CloudsOne more day, one more eventful day, sharper pre-open, measured open, manic high and closed tad to the favour of the bulls.
The incremental inference is as good as anyone's.
The biggest fear is the absence of fear in itself. Markets chug along as if they know something that we all want to know.
They still in the known territory, only that we have pushed our imagination, beyond what is seen.
The big picture, if one wants to compare, we are as overbought as we were in 2007, that should caution. Which in itself means the incremental rise can be sharper as well as quicker the falls, the rotation continues to baffle many.
The only solace one can infer and apportion is the presence of biggies, certain uncertain outcomes, hopes overriding the fears.
By definition, hedging means hedging the feared risk or the unknown risk. Else, there is absolutely no need to hedge. Ask this to the USDINR trader.
One always wants to hedge the outcome that is against the majority or the popular opinion. It is this outcome, that can unsettle the market. The outcome of the popular opinion if any is another approach to handle. We don't the tools of all ammunition at the same time to execute, each occasion has a certain precision approach to deal with.
The big graph shows presence of 1. The bearish deliberation candle, followed by the classical rise. Then the bearish engulfing (it has part of the deliberation, but we focus on the big one), and then the bearish engulfing one, one can wish them away to their own risk. Ther recent three black crows have the third one as collapsing crow.
Candle sticks are powerful pattern they warn, just because the price action pierces above the high does not guarantee anything in the big picture. The next three days are crucial or the week close is crucial in that sense. It is also the expiry week next week and closer to the exit polls.
The pip graph shows five wave moves with the larger channel and hence the current one, will that extend or truncate has to be seen.
Suffice to place 22350-22650 as the ranges.
Support 22480-430-380
Supply 22580-620-660

DXY DailyTVC:DXY The Dollar Index is at the lowest level of the uptrend. Let's see how you react on this important point .... If the upward trend continues at this level, it will continue and we have good upside potential, if we cannot hold this position and it falls and the upward trend is no longer valid and then we look for sell opportunites

Excited bulls? For your sake, don't be... just noWe are at a triple top with a low circa 12 VIX max is 5400 before the fall.
We will not get what Deutche Bank wants 5500 mark my words

Nifty returning from 22591 indicates strong resistance zone.Nifty returning from high of 22591 has given indication of strong resistance zone ahead. Also closing above Mid-Channel resistance was a good move but still it is not a convincing upward gallop with market breadth remaining negative and FII still selling relentlessly. Some decent mid and large cap stocks are not moving despite good results and some average stocks and PSU are moving towards exaggerated valuation. PE investing or comparing the 10 year PE to the current PE of the stock should be the way to go for investors. Do not get trapped at levels which might not return for years. (I am nor fear mongering but that should be the case in every and any circumstance anyway.)
Nifty Supports levels: 22470, 22402, 22345, 22257 and 22055.
Nifty Resistance levels: 22530, 22591, 22658, 22730 and 22831.

CHART BREAKDOWN US30: Key Levels, Targets and Thoughts!🎯Brief Description🖊️:
The chart provides insights into critical market levels, emphasizing an essential supply zone (medium-risk sell zone) spanning from 39600 to 39570. Additionally, medium-risk sell zone between 40050-40090, respectively, are highlighted.
Things I Have Seen👀:
Medium-Risk Buy Zone🟠: Noted between 39600 and 39570, suggesting another area with moderate risk for potential buying positions.
Medium-Risk Sell Zone🟠: Noted between 40050 and 40090, suggesting another area with moderate risk for potential selling positions.
Bearish Targets📉:
40000: Possible retracement area.
39900: Possible retracement area.
39800: Area with laying low liquidity.
Ultimate Target: 39600- Essential Demand Zone
Bullish Targets📈:
39700: Possible retracement area.
39850: Possible retracement area.
40100: Area with a lot of liquidity.
What's Important Now❗
Currently, the crucial approach is to wait and observe the price action at this level. We need to assess how the market reacts before considering any decisive moves. Stay observant and responsive to real-time developments in the market.

CHART BREAKDOWN NASDAQ: Key Levels, Targets and Thoughts!🎯Brief Description🖊️:
The chart provides insights into critical market levels, emphasizing an essential demand zone (low-risk buy zone) spanning from 18330 to 18315, respectively, are highlighted.
Things I Have Seen👀:
Important Demand Zone🟢: Identified between 18330 and 18315, serving as a low-risk buy.
Bullish Targets📈:
18400: Possible retracement area.
18500: Possible retracement area.
18580: Possible retracement area.
18670: Area with a lot of liquidity.
What's Important Now❗
Currently, the crucial approach is to wait and observe the price action at this level. We need to assess how the market reacts before considering any decisive moves. Stay observant and responsive to real-time developments in the market.
