US100 SHORTMy US100 analysis is short position currently. This is just my own opinion.
Trade at your own risk!
Market indices

High Correlation US S&P500 and Nifty 50Last 5 years if one adjusts for covid related correction. US and Indian Markets have given phenomenal returns. Looking at the 5-year chart, the correlation between the markets looks quite high. While US markets was a leading indicator in the beginning. but Nifty later on started giving leading indicator. One can argue that Nifty return is in INR while SPX return is in USD. If one looks at the USDINR exchange rate the CAGR would be around 3% in last 5 years.
While market surely looks heated up .. SPX supported by FAANG and now NVIDIA the rally is very concentrated... while NIFTY has seen sector rotation and broader participation across stocks and industries. The steam to rally another 10% to 15% is still there but risk reward is not going in Favour of being long. One should start trimming position and give away last 5 to 10% gain and focus on saving capital.


nifty important levels for tomorrow, Monday, 3rd June 2024nifty important levels for tomorrow, Monday, 3rd June 2024
No trade Zone between 22656 and 22467
Resistance 1 22800
Resistance 2 22941
Support 1 22334
Support 2 22209

#FAR40The Elliott pattern has finished an upward pulse and is completing the second Elliott pattern. The upward trend is at its end. After the final targets, we can expect a decline.


SENSEX S/R for 3/6/24Support and Resistance Levels: In technical analysis, support and resistance levels are significant price levels where buying or selling interest tends to be strong. They are identified based on previous price levels where the price has shown a tendency to reverse or find support.
Support levels are represented by the green line and green shade, indicating areas where buying interest may emerge to prevent further price decline.
Resistance levels are represented by the red line and red shade, indicating areas where selling pressure may arise to prevent further price increases. Traders often consider these levels as potential buying or selling opportunities.
Breakouts: Breakouts occur when the price convincingly moves above a resistance level (red shade) or below a support level (green shade). A bullish breakout above resistance suggests the potential for further price increases, while a bearish breakout below support suggests the potential for further price declines. Traders pay attention to these breakout signals as they may indicate the start of a new trend or significant price movement.
Disclosure: I am not SEBI registered. The information provided here is for learning purposes only and should not be interpreted as financial advice. It is important to consult with a qualified financial advisor before making any investment decisions. Tweets neither advice nor endorsement.

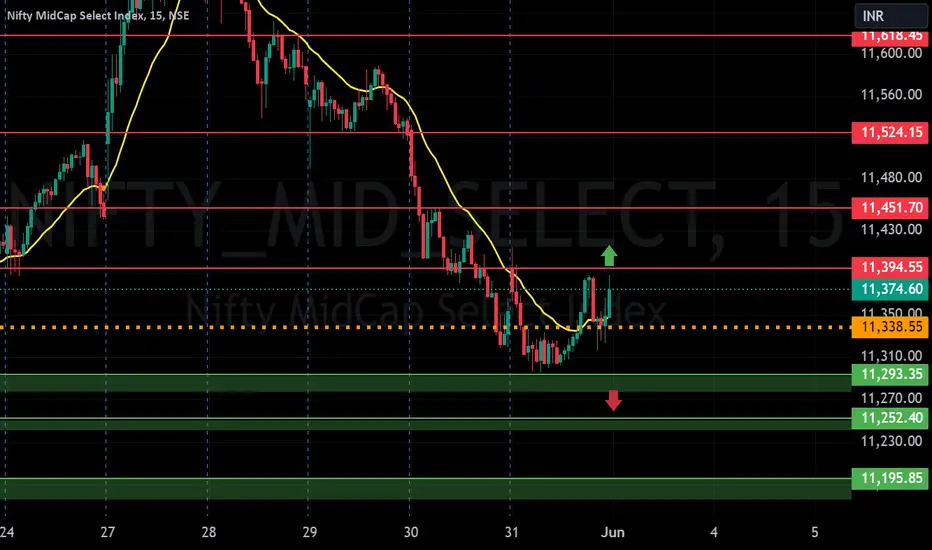
MIDCAP NIFTY S/R for 3/6/24Support and Resistance Levels: In technical analysis, support and resistance levels are significant price levels where buying or selling interest tends to be strong. They are identified based on previous price levels where the price has shown a tendency to reverse or find support.
Support levels are represented by the green line and green shade, indicating areas where buying interest may emerge to prevent further price decline.
Resistance levels are represented by the red line and red shade, indicating areas where selling pressure may arise to prevent further price increases. Traders often consider these levels as potential buying or selling opportunities.
Breakouts: Breakouts occur when the price convincingly moves above a resistance level (red shade) or below a support level (green shade). A bullish breakout above resistance suggests the potential for further price increases, while a bearish breakout below support suggests the potential for further price declines. Traders pay attention to these breakout signals as they may indicate the start of a new trend or significant price movement.
Disclosure: I am not SEBI registered. The information provided here is for learning purposes only and should not be interpreted as financial advice. It is important to consult with a qualified financial advisor before making any investment decisions. Tweets neither advice nor endorsement.
FIN NIFTY S/R for 3/6/24Support and Resistance Levels: In technical analysis, support and resistance levels are significant price levels where buying or selling interest tends to be strong. They are identified based on previous price levels where the price has shown a tendency to reverse or find support.
Support levels are represented by the green line and green shade, indicating areas where buying interest may emerge to prevent further price decline.
Resistance levels are represented by the red line and red shade, indicating areas where selling pressure may arise to prevent further price increases. Traders often consider these levels as potential buying or selling opportunities.
Breakouts: Breakouts occur when the price convincingly moves above a resistance level (red shade) or below a support level (green shade). A bullish breakout above resistance suggests the potential for further price increases, while a bearish breakout below support suggests the potential for further price declines. Traders pay attention to these breakout signals as they may indicate the start of a new trend or significant price movement.
Disclosure: I am not SEBI registered. The information provided here is for learning purposes only and should not be interpreted as financial advice. It is important to consult with a qualified financial advisor before making any investment decisions. Tweets neither advice nor endorsement.

NIRTY S/R for 3/6/24Support and Resistance Levels: In technical analysis, support and resistance levels are significant price levels where buying or selling interest tends to be strong. They are identified based on previous price levels where the price has shown a tendency to reverse or find support.
Support levels are represented by the green line and green shade, indicating areas where buying interest may emerge to prevent further price decline.
Resistance levels are represented by the red line and red shade, indicating areas where selling pressure may arise to prevent further price increases. Traders often consider these levels as potential buying or selling opportunities.
Breakouts: Breakouts occur when the price convincingly moves above a resistance level (red shade) or below a support level (green shade). A bullish breakout above resistance suggests the potential for further price increases, while a bearish breakout below support suggests the potential for further price declines. Traders pay attention to these breakout signals as they may indicate the start of a new trend or significant price movement.
Disclosure: I am not SEBI registered. The information provided here is for learning purposes only and should not be interpreted as financial advice. It is important to consult with a qualified financial advisor before making any investment decisions. Tweets neither advice nor endorsement.

#Nifty50 trade setup for the week. (3rd to 7th June24)#Nifty50 trade setup for the week. (3rd to 7th June24)
The Nifty50 is looking bearish and although the overall sentiment is looking towards the outcome of the elections, any movement has to looked at very closely. As per my analysis if the Nifty50 moves between 22,683 on the upside and 22,390 on the downside, I would advice traders to not enter the market.
Wait until the upside or the downside levels are breached and then enter. I would also suggest traders to stay away from trading on the 3rd and 4th of June due to increased volatility because of the election results.
Stay green, happy trading.

Nikkei, bias to look for short...BUTHello fellow traders , my regular and new friends!
Welcome and thanks for dropping by my post.
Bias to look for short on Nikkei, but let's see how, the price action seems choppy lately..
Do check out my recorded video (in trading ideas) for the week to have more explanation in place.
Do Like and Boost if you have learnt something and enjoyed the content, thank you!
-- Get the right tools and an experienced Guide, you WILL navigate your way out of this "Dangerous Jungle"! --
*********************************************************************
Disclaimers:
The analysis shared through this channel are purely for educational and entertainment purposes only. They are by no means professional advice for individual/s to enter trades for investment or trading purposes.
*********************************************************************

USD still slight bias to the downside...Hello fellow traders , my regular and new friends!
Welcome and thanks for dropping by my post.
USD seems like going side ways for the past 2 weeks.. i am still on the slight bias for the downside on USD..guess need a decisive breakout from here on...
Do check out my recorded video (in trading ideas) for the week to have more explanation in place.
Do Like and Boost if you have learnt something and enjoyed the content, thank you!
-- Get the right tools and an experienced Guide, you WILL navigate your way out of this "Dangerous Jungle"! --
*********************************************************************
Disclaimers:
The analysis shared through this channel are purely for educational and entertainment purposes only. They are by no means professional advice for individual/s to enter trades for investment or trading purposes.
*********************************************************************

Opportunity to Buy BankNifty Seems Right Opportunity to Buy Bank nifty with expected Target to reach as indicated

DXY POTENTIAL REVERSAL WITH A BREAKOUTDXY is currently trading within an expanding channel. A potential reversal could occur if the price manages to break out bullishly from this structure and surpass the identified consolidation zone. However, if this breakout does not happen as anticipated, we might see a further decline or an extended period of consolidation.

BANK NIFTY 2HRCAN ANYONE EXPLAIN WHAT IS HAPPENNING HERE..??
I Am Not SEBI Registered Analyst. All Post and Levels Posting is only for educational and knowledge purpose. I Am not responsible for your any kind of loss or profit.
No Claim, All Rights Reserved.‼️

WIG (Warszawa, PL) measured in gold ounces, Heikin-Ashi, 1MHello Everyone,
Today we have monthly chart for WIG Index, mesaured in gold ounces.
With best regards,
Paweł

DXYIs the US dollar going to push much lower ?
The possible scenario i see. Hopping for a retest of the 1 hr FVG and see price continuing down to take out liquidity 104.336
Form here we might see a reversal if price respect the trend line and order block below at 104.262

Dollar Move - BullishTRADE
June 1, 2024.
Expect a run on sellstops and then a bullish move thru 107.000
Buy Program unfolding on D1.
Next week BUY signal and SHORT for Fiber and Cable.

NiftyYou are not going to believe when Nifty actually plays out like this. Today as we approach election results, this is how I see nifty unfolding for next 2 months.
Long Play
Nifty CMP - 22547.95
Target 23047 SL 22416
Short Play
Entry - 23047.50 SL 23080 Target 21850
Long Play
Entry 21826 SL 21820.90 Target New All time high. My over all target on higher side is 25245.

SP500 Wyckoff Spring with Outside Day in the Daily + Cup&HandleThe daily charts offer a Spring setup opportunity while the weekly chart supports that idea with a good-looking Hammer.
What is interesting is the Outside Day bar, which comes on a good volume.
There is a previous resistance that turns support. The setup is a bit tighter than I'd prefer and makes the risk-to-reward, not the best, but the markets are rarely perfect.
This particular setup might also be called a cup and handle pattern by William Oneil's fans. Its target is equal to an important Fib extension level.

Commodities Investment Theme##Macro
1. Inflation
Inflation drives commodity prices - for example - oil gas wheat lumber steel.
If inflation are stick, gold silver are great hedges, and so far it is not pricing in much as most investors are not holding gold.
2. Interest Rates
Lowering rate is good reason to buy commodities, as lower rates weaken fiat currencies and enhance attractiveness of commodities, it also reduce opportunity cost of holding non yielding asset like precious metals.
3. Supply Chain Disruptions
Mining storage, increase demands from other sectors like AI, this seems to be the case for now.
4. Geopolitical Tension
Russia Ukraine price has rose oil and natural gas price
5. Energy transition, green tech and ai demand
6. Weather related supply shocks - such as agricultural commodities affected from weather prices. (coffee futures)
Some examples and explaination of commodities:
1. Coca:
Increase in cocoa price is not just supply concerns, robust demand for choco products worldwide is ranked bullish, west africa is most esssential coca producing region in the world and both political instability and bad weather condition hurt crop yields.
2. Orange Juice:
Price went up 300% since pandemic started, price rose due to citrus greening disease that has devasted florida orange supplies.
3. Silver Gold
13% move higher in gold can be attributed to lowering rates and foreign government buying, aside from fear from retail investors scared of geopolical conflicts.
Copper also have renewed interest due to AI demand and China's economy rebound, but need to pay attention to chinese inventory level to guage price levels.
Coming plays:
1. Natty Gas - price was high in 202 due to conflict of war, but now it is likely to rally for meeting the power usage of AI data centers.
2. Lithium - for ESS solutions and EV solutions. Mining could be a challenge that drives up prices, need to research more on mining facility
3. Wheat: Prices higher after Russia Ukraine war but all gains was erased, weather plays a role in this.
Stuff to buy:
AMEX:USO - oil, AMEX:UGA - gasoline, AMEX:UNG - natural gas
AMEX:WEAT - wheat, AMEX:CORN - corn, AMEX:SOYB - soybeans
Stocks wise:
Energy products services sustainable solutions - SCCO
Integrated copper producer: TRGP
Midstream natty gass NGL service in US: TSCO
Rural lifestyle retailer products: AU
GLobal gold mining company in south africa - NEE
Clean energy with wind and solar energy producing: VLO

CH50 SHORTI'll be looking short on Asian Session due for retracement area. Based on EMA 30 for entry area
