Government bonds

10 year yields vs spx!!!! MACRO CAPITAL FLOWS SHIFTING !!!!
What HAPPENS when a 40 YEAR descending trend line BREAKS?
#gold #silver #crudeoil
39 year down trend
Fed Fund rate is a symptom of longer term yields
first time positive 7 year rate of change since 1984

Nebula Nights: An Interstellar ImmersionI have shared my primary case on this back in may.
This is a public repost for those who are still around.
Original:
---
This chart is the #1 reason why the global market will drop from here:
Debt is going to reach unsustainable levels, banks will deny companies on the brink of bankruptcy loans, commercial real estate will spiral down at speeds never seen before, and the us stock market will get slashed by 50% into next year.
Oh yeah, and 401k's will turn into 201k's.
---
Us10y w5 algo sits at 5.9%.

Will S&P500 Win? Or it will lose?😁Do you Remember in March 2020 when Rates were the lowest it had ever been I think since the Entire History of its Trading on the Open Market? Well Nothing is Permanent in this world since Covid lows it has rallied quite a lot. It would certainly be interesting to see what happens next.
Lets Discuss the Key Levels to Watch first
Right Now it is currently at almost 3.6%ish level. If we see a Break below 3.2% ish level then it will open the Gate to Go even lower maybe at 2.5% level. And that would be quite Bullish for S&P500 or the Whole General Stock Market.
Alternate Count : Maybe Trend is your Friend and it will continue to Keep Making Higher Highs and all that Nonsense sfuff. A break above 4.3% level would be a very Bullish Thing for this Market and that would put Pressure on S&P500 to stay below it's All Time Highs. If this scenario does indeed plays out a lot of people might not be happy. Again in Trading/Investing Hope for the best but prepare for the Worst🙂
Final Thing to say : Robert Prechter, the Famous Elliott Wave Analyst in his Elliott Wave Theorist actually said that it would be a very rare thing to see this thing test again at Covid lows. So he is infact Quite Bullish and says a Major Rally has begun since its 2020 lows. And ultimately we could see Bonds test it All time Highs. If that seriously were to happen than Whole Stock Market would collapse or atleast be in a Corrective Environment. He is quite Bearish on the Outlook of Stock Markets based on his Elliott Wave Counting. He also said that this is the Worst Decade to get invested. He is quite a Smart and Intelligent Person but we shall see what happens. Maybe he could be correct who knows with the Nature of Financial Markets one can never be One Hundred Percent Sure about Anything. What do you think? For the time being let's have Patience and watch our Key Levels

10 year yields vs spx!!! DO NOT FIGHT THIS !!!
Your next investment ideas should pay VERY CLOSE ATTENTION to this chart.
It is showing you where the next MACRO CAPITAL FLOWS are heading.
#uranium #crudeoil
paradigm shift event
continuation breakout

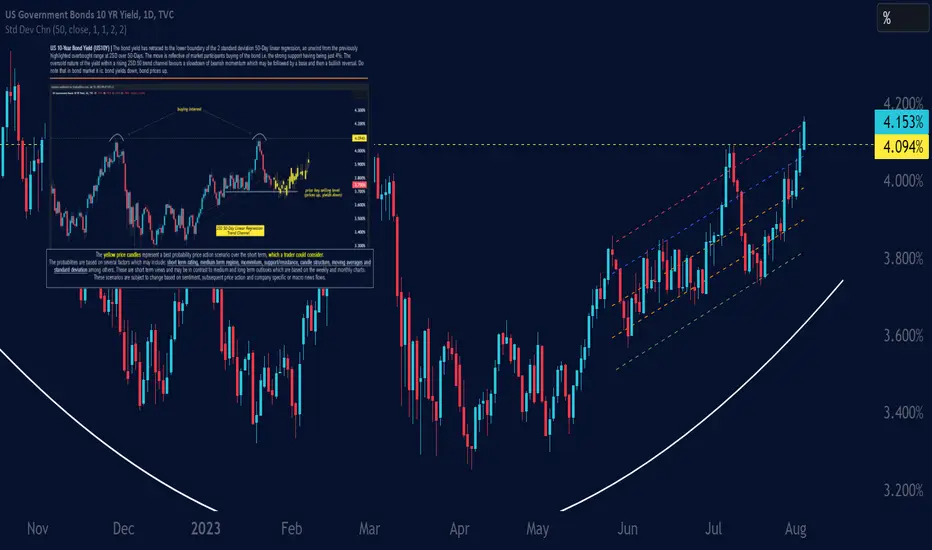
US10YThe yield now trades at the upper boundary of a 2 standard deviation 50-day linear regression trend channel, reflecting a high bullish momentum/approaching overbought condition. This follows the previous oversold condition discussed on 19 July where the yield traded at the lower boundary of the 2SD 50-Day linear regression trend channel.
US10 YEAR BOND YIELDHi everybody , Look at my beautiful analysis about rising 10y bond yield ...lokk at how it affect on us stock market .....follow my posts to be far from hype and euphoria ...
but be aware it is going to be close to the significant resistance ... and i think dxy is going to be close to big obstacle as well therefore dont sell off your gold and .....
link of my previous idea :https://www.tradingview.com/chart/US10Y/kld1jbtQ-US10Y/
Good luck,think inverse the crowd

I think for Next week dollar will be stronger For swing traders the market is showing a positive vibe for US Dollar as Index Prominently increasing and Government Bold Yields raising the Gold is decreasing and broke a multiple support level , for next week the condition based on fundamental analysis looks bearish market for gold and the data that is going to be released today will settle this analysis.

US GOVERNMENT BOND YIELDS : BACK TO 4.094%Notice a peculiar pattern with the Price action of TVC:US10Y
Price forms a turtle soup in the form of a sellside liquidity and then rallies to the upside to take out the buyside liquidity above the market price
Price then takes out the final sellside and then reallies to the upside. I want to see price to reach into the FVG on the 4hr Timeframe
Primary target
FVG
and
Buyside @ 4%

US 10 YEAR YIELDS (LONG ANALYSIS UPDATE)🚀A much needed update on the US10Y, as it has been a while. The market has moved really slow, BUT still moving as expected from our long analysis. The market has moved up a huge 23.50% since the start of this year & still has more upside left!
Well done to all those who invested into the 'US 10 Year Yields', as it makes a great diversification in your investment portfolio! Not bad doing 23.50% ROI in 8 months.

US20Y, 3d ChartPublishing the 20 year yield chart to track the progress relative to TLT.
The breakout appears to be gathering steam and if this goes parabolic, things will get very interesting.
Idea on TLT:

swedessAre about to get whrekt they have no idea that we will se 100 points up on rates yetv .. they will handel it

Global Liquidity vs BTCUSDIn this idea we'll have a look global liquidity vs BTCUSD on a quarterly timeframe.
The main pane contains the bars of a new global liquidity formula discovered by Twitter TechDev_52. On top of the bars is a solid orange line which is BTCUSD both on quarterly timeframe. Also on the main pane is a value grid for global liquidity which is based on time and global liquidity closing values.
The secondary panes show the DB ZPS RSI values of global liquidity and BTCUSD. The entire point of this idea is three factors; 1) showcase the beautiful cyclical nature of global liquidity and 2) to show the beautiful cyclical nature of BTCUSD and financially 3) the near 1-to-1 high timeframe cycle pattern matches.
It's common theory that as global liquidity increases money flows into highly valuable assets and then trickles into secondary assets in a lagging manner. If this idea is correct, this would showcase the best periods to enter and exit assets from a very high level from an investment point of mind.
To the investor these cyclical patterns are a gift that shows periods of wealth growing opportunities in traded assets. Enjoy!

Harvesting Risk Hedged Treasury YieldEver heard of risk-free rates? Risk free rates are commonly understood to refer to interest rates on 10-year US treasuries. These are considered risk-free as the likelihood of the US government defaulting is considered extremely unlikely.
Treasuries pay out a fixed interest and can be redeemed for their face value at maturity. Fixed returns and negligible default risk make treasuries a critical addition to any decent investment portfolio.
With inflation on the downtrend and Fed’s hiking cycle nearing its apex, long term treasuries provide a fixed income-generating asset with no reinvestment risk.
Little default risk does not mean zero market risk. As highlighted in our previous paper , bond prices are materially exposed to interest rate risk. CME Group’s treasury futures allow investors to hedge that risk.
This paper has been split into two parts – the first provides an overview of treasury futures and their nuances while the second walks through the trade setup required to harness risk-hedged yield.
TREASURY FUTURES
Treasury futures enable investors to express views on a bond’s future price movement. Investors can also hedge against interest rate risk by locking in a coupon rate. CME treasury futures are deliverable with eligible treasury securities which ensures price integrity.
QUOTING
Treasuries are quoted in fractional notation as a percent of their par value. For instance, a bond quoted at 111’272 suggests that it is trading 11 + 27.2/32 (11.85%) above its par value. This allows standardized quotation of bonds with different coupon rates.
Note that notion of quotes in cash markets may be different from futures.
AUCTION SCHEDULE
Treasuries are auctioned periodically depending on their maturity duration.
• Treasury Bills with maturity between 4 to 26 weeks are auctioned every week while T-Bills with maturity of 1-year are auctioned every four weeks.
• Treasury Notes with maturity of 2, 3, 5, and 7 years are auctioned every month while T-Notes with maturity of 10-years are auctioned every quarter.
• Treasury Bonds are auctioned every quarter.
The auctions for each type of security are staggered to reduce their market impact.
CONVERSION FACTOR
It is possible for a large range of “eligible” treasuries to be available for deliveries against standardised futures contract as new treasuries are regularly auctioned at changing rates. The most recently auctioned securities that are eligible for delivery are called “on the run” securities.
To standardize the delivery process for varying securities, a conversion factor unique to each bond is used. The buyer of the futures contract would pay the Principal Invoice Price to the seller. The Principal Invoice Price is the “Clean Price” of the security and is calculated by applying the Conversion Factor to the settlement price.
When the Conversion Factor is less than 1, the buyer pays less than the settlement price and when it is higher than 1 the buyer pays more.
ACCRUED INTEREST
In addition to the adjustment for the quality of the bond being delivered, the buyer must also compensate the seller for any interest the bond would accrue between the last payment and the settlement date.
The final cost to deliver the treasury futures contract would be the Clean Price + Accrued Interest.
CHEAPEST TO DELIVER
Due to the Conversion Factor, which is unique to each bond, some bonds appear to stand out as cheaper alternative for the seller to deliver. So, if a seller has multiple treasury securities, a rational seller will choose to deliver the one that best optimizes the Principal Invoice Price.
As a result, futures price most closely tracks the Cheapest-to-Deliver ("CTD”) securities.
This also provides an arbitrage opportunity for basis traders. In this case, the basis is the relationship between the cash price of the security and its clean price on the futures market. Small discrepancies in these may be profited upon.
Notably, specialized contracts such as CME Ultra 10-year Treasury Note futures with selective eligibility requirements diminish the effects of CTD by reducing the range of deliverable treasuries.
HEDGING BOND PRICE RISK WITH TREASURY FUTURES
Treasury securities are a crucial and substantial addition to any well diversified portfolio, offering income generation, diversification, and safety.
With interest rates elevated and inflation heading lower, coupon rates for long-term US treasuries are yielding positive real returns. Moreover, 10Y yield is hovering at its highest level in 13-years suggesting a strong entry point.
Since the coupon rate of the security is fixed and they can be redeemed at face value upon maturity, the present higher yielding treasuries are a great long-term income generating investment.
Despite the inverted yield curve, which suggests yields on longer-term securities are lower, a position in long-term bonds protects against reinvestment risk. Reinvestment risk refers to the risk that when the bond matures, rates may be lower.
With Fed at the apex of its hiking cycle, rates will likely not go any higher. So, a position in long term T-bond, locked in at the current decade-high rates, offers a lucrative opportunity. The position also benefits in the uncertain scenario of a recession as bond prices rise during recessions.
This investment fundamentally represents a long treasury bond position which profits in two ways: (a) Rising bond prices when interest rates decline, and (b) Coupon payments.
If the coupon payout is unimportant, fluctuations in the bond price can be profited upon in a margin efficient manner using CME futures. This does not require owning treasuries as the majority of the treasury futures are cash settled with just 5% reaching delivery.
In the fixed income case, the bond is held until maturity which leads to opportunity costs from bond price fluctuations.
CME futures can be used to harvest a fixed yield from treasuries and remain agnostic to rate changes, by hedging the long treasury position with a short treasury futures position.
This position is directionally neutral as losses on one of the legs are offset by profits on the other. The payoff can be improved by entering the short leg after bond prices are higher.
To hedge treasury exposure using CME futures the Basis Point Value (BPV) needs to be calculated. BPV, also known as DV01, measures the dollar value of a one basis point (0.01%) change in bond yield. BPV depends upon the bond’s yield to maturity, coupon rate, credit rating and face value.
Notably, BPV for longer maturity bonds is higher as their future cashflows are affected more by changes in yield.
Another commonly used term is modified duration which determines the changes in a bond’s duration or price basis of a 1% change in yield. Importantly, the modified duration of the bond is lower than 100 BPV’s since the bond price relationship to yield is non-linear.
BPV can be calculated by averaging the absolute change in the bond’s yield-to-maturity, its value when held until maturity, from a 0.01% increase and decrease in yield. Where there are multiple bonds in a portfolio, the BPV for a unit exposure will have to be multiplied by the number of units.
On the futures side, BPV can be calculated as the BPV of the cheapest to deliver security for that contract divided by its conversion factor.
By matching the BPV’s on both legs, the hedge ratio can be calculated. This represents the number of contracts needed to entirely hedge the cash position.
SUMMARY OVERVIEW OF CME TREASURY FUTURES
CME suite of treasury futures allow investors to gain exposure to treasury securities across a range of expiries in a deeply liquid market.
Each futures contract provides exposure to face value of USD 100,000.
The 2-Year, 5-Year, and 10-Year contract are particularly liquid.
Micro Treasury Futures are more intuitive as they are quoted in yields and are cash settled. Each basis point change in yield represents a USD 10 change in notional value.
These products reference yields of on-the-run treasuries and settled daily to BrokerTec US Treasury benchmarks ensuring price integrity and consistency.
Micro Treasury Futures are available for 2Y, 5Y, 10Y, and 30Y maturities enabling traders to take positions across the yield curve with low margin requirements.
TRADE SETUP TO HARVEST RISK HEDGED TREASURY YIELDS
A long position in the on-the-run 10Y treasury notes and a short position in CME Ultra 10Y futures allows investors to benefit from the treasury bond’s high coupon payment while remaining hedged against interest rate risk.
Hedge ratios can be calculated using analytical information from CME’s Treasury Analytics Tool to obtain the BPV of each of the legs:
The on-the-run treasury pays a coupon rate of 3.375% pa. and its last quoted cash price was USD 98.04. It has a DV01 of USD 76.8.
Since, each contract of CME Treasury Futures represents face value of USD 100,000, the long-treasury position would need to be in multiples of USD 100,000.
For a face value of USD 500,000 (USD 100,000 x 5) this represents a notional value of USD 490,000 (Face Value x Cash Price) .
The long-treasury position's DV01 = USD 76.8 x 5 = USD 385.
The cheapest-to-deliver security has a DV01 of USD 92.2 and a conversion factor of 0.8244.
The futures leg thus has a BPV = Cash DV01/Conversion Factor = USD 92.2/0.8244 = USD 111.8.
The hedge ratio = BPV of Long Treasury/BPV of Short Futures = USD 385/USD 111 = ~4 (3.4)
So, four (4) lots of futures would be required to hedge the cash position which would require a margin of USD 2,800 x 4 = USD 11,200.
Though the notional on the two legs does not match, the position is hedged against interest rate risk and pays out 3.375% per annum in coupon payments.
MARKET DATA
CME Real-time Market Data helps identify trading set-ups and express market views better. If you have futures in your trading portfolio, you can check out on CME Group data plans available that suit your trading needs www.tradingview.com
DISCLAIMER
This case study is for educational purposes only and does not constitute investment recommendations or advice. Nor are they used to promote any specific products, or services.
Trading or investment ideas cited here are for illustration only, as an integral part of a case study to demonstrate the fundamental concepts in risk management or trading under the market scenarios being discussed. Please read the FULL DISCLAIMER the link to which is provided in our profile description.

US 10Y TREASURY: 3.8% would be optimal?The Fed has increased reference interest rates by another 25 bps, exactly as per market expectations. On a positive side is that the US inflation continues to slow down, which increases the probability that the Fed will soon stop with further rate hikes. At least, this is the current expectation from the majority of market participants, but whether this will be so, is to be seen till the end of this year. Fed Chair Powell promised another rate hike till the end of the year, while further hikes will depend on future macro data.
The 10Y Treasury yields reached the highest weekly level at 4.04%, ending the week at level of 3.95%. The level of 4% has been tested, but it was hard to sustain this level during the week. Based on charts, a reversal is still not over, in which sense, some lower levels might be tested in a week ahead. In this sense, yields might return to the previous level of 3.8%, with a low probability that 3.6% might be tested during the week.

Us rates going down?As many of you know.. I'm not fan of making small chart analysis but due to data ive got i will be updating .. for moment and as much of pressure from infaltion has cooled down... we can clearly see a rate cuts in near future... plus.. next year is Us election.. so fed is under heavy pressure now.


DXY doesn't look too happy below 100Last week the US dollar index (DXY) closed at a 15-month low and beneath 100 for the first time since April 2022. Yet subsequent price action has seen a lack of conviction form bears, allowing prices to form a double bottom just above the March 2022 high and close with a Spinning Top doji yesterday.
Given US yields are showing signs of stability (and hinting at a move higher themselves), it seems reasonable that the US dollar is due a corrective bounce over the near-term which brings 100.5 and the April low into focus for bulls.
A break beneath the March 2022 high invalidates the bearish bias, but this could be raised to the recent swing lows if we see a decent break (or daily close above) 100.

Deciphering Divergent Signals The Complex Economic LandscapeThe global economy continues to face profound uncertainties in the wake of COVID-19's massive disruptions. For policymakers and business leaders, making sense of divergent signals on jobs, inflation, and growth remains imperative yet challenging.
In the United States, inflation pressures appear to be moderately easing after surging to 40-year highs in 2022. The annual Consumer Price Index (CPI) declined to 3% in June from the prior peak of 9.1%. Plunging gasoline and used car prices provided some consumer relief, while housing and food costs remained worryingly elevated. Core CPI, excluding food and energy, dipped to 4.8% but persists well above the Fed’s 2% target.
Supply chain improvements, waning pandemic demand spikes, and the strong dollar making imports cheaper all helped cool inflation. However, risks abound that high prices become entrenched with tight labor markets still buoying wages. Major central banks responded with substantial interest rate hikes to reduce demand, but the full economic drag likely remains unseen. Further supply shocks from geopolitics or weather could also reignite commodity inflation. While the direction seems promising, the Fed vows ongoing vigilance and further tightening until inflation durably falls to acceptable levels. The path back to price stability will be bumpy.
Yet even amidst surging inflation, the US labor market showed resilience through 2022. Employers added over 4 million jobs, driving unemployment down to 3.5%, matching pre-pandemic lows. This simultaneous inflation and job growth confounds historical norms where Fed tightening swiftly slows hiring.
Pandemic-era stimulus and savings initially cushioned households from rate hikes, sustaining consumer demand. Early retirements, long COVID disabilities, caregiving needs, and possibly a cultural rethinking of work also constricted labor supply. With fewer jobseekers available, businesses retained and attracted talent by lifting pay, leading to nominal wage growth even outpacing inflation for some months.
However, the labor market's anomalous buoyancy shows growing fragility. Job openings plunged over 20% since March, tech and housing layoffs multiplied, and wage growth decelerated – all signals of softening demand as higher rates bite. Most economists expect outright job losses in coming months as the Fed induces a deliberate recession to conquer inflation.
Outside the US, other economies show similar labor market resilience assisted by generous pandemic supports. But with emergency stimulus now depleted, Europe especially looks vulnerable. Energy and food inflation strain household budgets as rising rates threaten economies already flirting with recession. Surveys show consumer confidence nosediving across European markets. With less policy space, job losses may mount faster overseas if slowdowns worsen.
Meanwhile, Mexico’s economy and currency proved surprisingly robust. Peso strength reflects Mexico’s expanding manufacturing exports, especially autos, amid US attempts to nearshore production and diversify from China reliance. Remittances from Mexican immigrants also reached new highs, supporting domestic demand. However, complex immigration issues continue challenging US-Mexico ties.
The pandemic undoubtedly accelerated pre-existing workforce transformations. Millions older employees permanently retired. Younger cohorts increasingly spurn traditional career ladders, cobbling together gig work and passion projects. Remote technology facilitated this cultural shift toward customized careers and lifestyle priorities.
Many posit these preferences will now permanently reshape labor markets. Employers clinging to old norms of in-office inflexibility may struggle to hire and retain talent, especially younger workers. Tighter immigration restrictions also constrain domestic labor supply. At the same time, automation and artificial intelligence will transform productivity and skills demands.
In this context, labor shortages could linger regardless of economic cycles. If realized, productivity enhancements from technology could support growth with fewer workers. But displacement risks require better policies around skills retraining, portable benefits, and income supports. Individuals must continually gain new capabilities to stay relevant. The days of lifelong stable employer relationships appear gone.
For policymakers, balancing inflation control and labor health presents acute challenges. Achieving a soft landing that curtails price spikes without triggering mass unemployment hardly looks guaranteed. The Fed’s rapid tightening applies tremendous pressure to an economy still experiencing profound demographic, technological, and cultural realignments.
With less room for stimulus, other central banks face even more daunting dilemmas. Premature efforts to rein in inflation could induce deep recessions and lasting scars. But failure to act also risks runaway prices that erode living standards and stability. There are no easy solutions with both scenarios carrying grave consequences.
For business leaders, adjusting to emerging realities in workforce priorities and automation capabilities remains imperative. Companies that embrace flexible work options, prioritize pay equity, and intelligently integrate technologies will gain a competitive edge in accessing skills and talent. But transitions will inevitably be turbulent.
On the whole, the global economy's trajectory looks cloudy. While the inflation fever appears to be modestly breaking, risks of resurgence remain as long as labor markets show tightness. But just as rising prices moderate, the delayed impacts from massive rate hikes threaten to extinguish job growth and demand. For workers, maintaining adaptability and skills development is mandatory to navigate gathering storms. Any Coming downturn may well play out differently than past recessions due to demographic shifts, cultural evolution, and automation. But with debt levels still stretched thin across sectors, the turbulence could yet prove intense. The path forward promises to be volatile and uneven amidst the lingering pandemic aftershocks. Navigating uncertainty remains imperative but challenging.

US 10Y TREASURY: watch for FOMCTreasury yields ended the week lower, as investors are weighing on a next monetary move of the Fed during next week. FOMC is scheduled for July 26-27th, where the majority of market participants are expecting further increase of interest rates by 25bps. The economy is showing modest signs of slow-down, while some economists are expecting a lagging effect of monetary policy, where recession might come as of the end of this year. In this sense, they are of the opinion that the Fed might pause rate hikes at July's meeting. All these are opinions, while the final view on the US economy will be given by Fed officials after the FOMC meeting.
During the week 10Y Treasury yields were mostly concentrated around 3.8% level. Although the lowest weekly level was at 3.73%, as of the weekend yields have returned to 3.8%. It could be expected for 10Y yields to continue to oscillate around 3.8% also at the beginning of the week ahead. Certainly, the crucial date during the week would be July 26th, when the Fed will announce its decision on interest rates. Depending on the outcome of the decision, yields might reach 3.7% or 3.6% levels. A move toward 4% does not seem likely at this moment, based on a technical analysis.

US10Y to 6.18%Rate jumps in leg 5, to complete iH&S, and second bullflag. Banks fail en masse as run accelerates, BTFP cant provide enough liquidity and FDIC jumps in using FedNow, which later on gets transitioned into retail CBDC. You will want your money back no? Then take the mark of the beast. By october.

$US10Y trading above the downward trendlineTVC:US10Y Even though most of the macro indicators (alongside the recent CPI data) indicate lower yields forward, the downward trendline from Oct 2022 highs broke out in June 2023, with a successful retest pattern couple of days ago. So, as long the yields stay above the trendline, we could see them rising higher over the coming months.

