Digital and technical analysisWe notice that there is a divergence and that we are in a major correction
Government bonds

US 10Y TREASURY: waiting for Fed Debate over the question whether FED should further increase interest rates or not is still quite active among economists. A Nobel-prise winner and economist Christopher Pissarides is of the opinion that there is no need for the US to further increase interest rates, as noted in an interview with CNBC. Many other influential economists share his opinion. However, Fed Chair Powell previously noted that two more rate hikes should be expected till the end of this year. At the same time, CME's Fedwatch is showing investors expectations of 92% for a 25 bps rate hike at July`s FOMC meeting. Until the final decision, US Treasury yields might express higher volatility, as seen during the previous week.
10Y US Treasuries reached the level of 4% two weeks ago, still, during the previous week, yields have dropped to the short term stop at 3.8%. Lowest weekly level was at 3.76%. Volatility around 3.8% might also continue during the week ahead. At this moment on charts, there is a low probability that yields might return to 3.6%. They will rather oscillate around 3.8% or higher, waiting for the FOMC meeting as of the end of July.


US10Y A break below the 1D MA50 will trigger a 2nd sell-off.The U.S. Government Bonds 10YR Yield (US10Y) is approaching the 1D MA50 (blue trend-line) that has been supporting the price action since May 16. The long-term trend since the October 21 2022 market top has been bearish, guided downwards by a Lower Lows trend-line but since February it has transitioned into a Rectangle. The recent July 07 High was a direct hit at the top of the Rectangle, so this week's rejection comes as a very natural consequence.
If the price closes a 1D candle below the 1D MA50, the 2nd part of the Rectangle's bearish leg will most likely be triggered. As you see during this long-term pattern, we've had two -19.70% decline sequences and if the current one turns out to be of that magnitude, we are looking at a 3.300% target.
Note that 4 days ago we formed a 1D Golden Cross, technically a bullish pattern, but the previous 1D Death Cross (bearish pattern) turned out to be the Rectangle's bottom. On that notion, the Golden Cross may have formed the top.
-------------------------------------------------------------------------------
** Please LIKE 👍, FOLLOW ✅, SHARE 🙌 and COMMENT ✍ if you enjoy this idea! Also share your ideas and charts in the comments section below! **
-------------------------------------------------------------------------------
💸💸💸💸💸💸
👇 👇 👇 👇 👇 👇

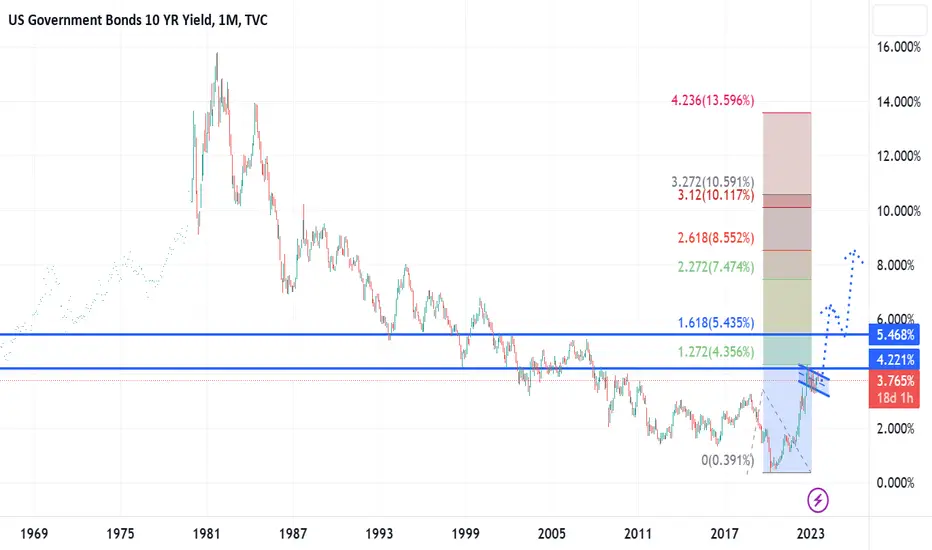
If yields make a new high I think they'll fly. If we draw a fib from the high to low of the last leg into the low in yields we can see the current bounce is off the 127 fib.
Most often when this is a correction the high comes around 161 (Which would be 7%). However, i find more often when we have a 127 bounce the 161 breaks and the following fibs hit.
If this TA norm plays out, it'd imply the FED is far from finished.
US 10Y yield stick peak cycleUS 10Y yield long-term remain uptrend but we look like stick peak cycle.
We recommend US10Y yield turn down SMA200 day at 3.70%.
US 10Y yield will be a risk of dropping to test the support at 3.30%.

US10Y: Excellent long term sell opportunity.The US10Y turned neutral on the 1D timeframe today (RSI = 51.795, MACD = 0.074, ADX = 33.857) after it got rejected on R1 two days ago. It is likely to see a sharp fall as on the March 2nd rejection, and in that case S1 and S2 won't pose any bullish pressure to the downtrend, nor should the 1D MA50 and 1D MA200, which in the past 12 months haven't had any such significance.
Consequently, we consider the current level early enough for a low risk sell position on the long term, targeting the S3 (TP = 3.300%). As you see, the trading structure follows quite similar legs since November and right now we are most likely on a leg 2.
## If you like our free content follow our profile to get more daily ideas. ##
## Comments and likes are greatly appreciated. ##

10yr likely to rest and continue higher10yr likely to rest and continue higher. During the cool-off i expect spx to spike 6-7k. Then 10yr to 10%, spx below 2k.
Stay safe
Good luck

sell us30Recommend that he sell Dow Jones now do a lot of analysis and give you the end result on a plate of gold


US 10Y TREASURY: 4% will holdFor some time charts were pointing to a potential for US10Y to reach 4% level, which finally occurred during the previous week. Job figures released for June show that average hourly earnings continue to be increased, 0.4% m/m in June or 4.4% on a yearly basis, which might bring inflation further to the higher grounds, which will push FOMC to further increase interest rates. Market sentiment for an increase in July reached 92%, but whether the Fed will have the same perception is about to be seen as of the end of July, when the FOMC meeting is scheduled.
10Y Treasuries started the previous week around 3.8%, however, after released jobs data, yields jumped to the highest weekly level at 4.09%. Considering current sentiment, it could be expected for yields to continue to be elevated during the week ahead. At this moment, there is decreased potential that they might revert to the previous, 3.8% level.

Is it time to switch "treasures"?-The US government's 2-year bond is trying to form a new bullish pivot on the monthly chart.
-I believe that it will not have enough strength to go further, that is, to break the pre SUBPRIME peak of 2008, in the region of 5,283, as inflation at the moment (short term) seems to want to cool down.
-But long-term inflation, I'm sorry to say that you may not want to let your guard down, so 5 and 10 year bonds may reach new highs.
-On the weekly chart we have an accumulation of prices, and the projection of this accumulation suggests the region of 5330 as a possible maximum destination for the prices of the 2-year bond.
-The SETUP used also projects purchasing power up to the range of 5,338 according to the high pivot also shown by the SETUP used!
-The daily chart already shows exhaustion, so you need to pull back on the long average just below if you really want to look for the 5,338 region.
-Do your analysis and good business.
-Be Aware, If You Buy, Use Stop!
-See below for other graphic reviews!

US10YHi ,,,, us 10 year bond yield break this bullish flag and it could put more pressure on stock market and the shares like TEsla which I am bearish on that ......
the us economy players are going to take the risk off the table be aware of that ....
Good luck ...

us 10 year bond yield go to 5.00-5.25%us 10 year bond yield break up sideway down channel and above SMA 200 day. We think us 10 year bond yield have go to 5.00-5.25% form 4.00%

German Bund Yields heading higher againBeen calling this the last few days. German Bund yields beginning to break back higher again. Inflation NOT transitory. ECB next week. Could be headed back above 2% soon.

It might be the right time to buy 10 year TreasuriesI see a big opportunity on treasuries with the rates that the treasauries are trading at. Why? Inflation has been going down consistently from 9.1% to 4% and the PPI (which is the Producer Price Index) from 11.1% to 1.1%. These indicators usually draw near the core CPI which has been sticky above 5% and has been the aim for the FED. Rents and some services have been raised this year and are not going down or stabilizing 12 year compared until next year. There is a lag effect in the economy regarding the rate hikes of about 12 to 18 months and we are still to see many of the effects noting that they have been restrictive for just 9 months.
Another nice data is the base, 12 month old prices. May and June are the top of the prices from last year due to the supply chain issues and the Russia Ucranie war. Oil went up to 130 dollar a barrel and most of commodities topped last year. So the CPI next week should be a 14 year high real yield high when a 3.2 to 3.5% print on the CPI should show more inflation loosening.
Economy is stil in a tight spot, with a strong labor market which made the last rate decisión of the FED a prediction of two more rate hikes this year. Eventhough since then 2 voting members have seen the posible mistake of keep hiking and have said that they should still see the effects of the 500 rate increase and not hike more for at least this year. This alone should drive a big buy througout the curve.
Economy is not that strong to see a 14 year high in real yield for a 10 year high with much analysts, including the FED are expecting at least a mild recesión. So rates are very high taking into account the análisis made. A 3.50% on the 10 year and a 4.30% on the 2 year are the aims. But the market has been frightened and selling due to the losses they took from anticipating this move too early. The recent debt limit helped a lot recently for those losses, but its an issue that has been dealt with. A frightened market ussually is an opportunity and I think this is one of them.
We still need to see the other 7 memebers of the FED agree, but in an educated guess the next week CPI data must do the job.


No coincidences hereThis is a new type of experiment regarding the simulation of scenarios. I am bullish biased on this one because of the candlestick pattern on the Daily chart. Looking forward to see if there is any meaning to these drawings and their correlation with the future price action.
Strategy and money management are key to success? The law of large numbers has its own story and puts everything in context. The context of probabilities and potentials. I am more interested in creating drawings that make sense after the future unfolds, exploring the computational potential of the unconscious brain activity, if it exists.

Make a wish on Bund's StarLinked postings are more relevant than this one. I drew the yellow path before the liftoff but I don't know if the same applies at this point in time. If any downward action appears it might just be a smaller retracement. I am looking at the star and can't believe my eyes. Is this real or am I mixing reality with quantum dreaming? Or is it one and the same?

INTERMARKET ANALYSIS : TREASURY YIELDS VS DOLLARThe TVC:US10Y have taken out a major swing low and made some rally to the upside. ThoughI still expect more rally to come, which in my opinion, would eventually come
If the TVC:US10Y rallies to the buyside Liquidity at rates of 4.089% and 4.335% respectively, then I am expecting the price of dollar to rally to the upside
This analysis explanation would simply make me Bullish on TVC:DXY and bearish on all other asset classes

10 year yield pops above channelCould be that interest rates and yields are on the rise again with todays small but noticeable pop above this 'bull flag' style parallel channel.

Knock Knock Who is there? it is me, US10Y 4.2%Knock knock.
Who's there?
I. O.
I. O. who?
Me.
When are you paying Treasury holders back?
Never!
Bullish Breakout ...to be continued...
The information and publications are not meant to be, and do not constitute, financial, investment, trading, or other types of advice or recommendations.

SPX: MAKE A MONTHLY TREND TOPHi everyone, im a portfolio manager. Today, i send you a warning to create a peak of the S&P500 index.
Careful.
