Possible bullish impulse move on the 2 Yr.Bull flag + bullish continuation on the momentum osculators + stocks falling + dollar finding bottom
Government bonds

Higher Yields May Cause Bigger Correction On DXYHigher yields may cause a bigger correction on DXY, as yields can be still looking for wave 5 by Elliott wave theory.
Yields higher, USD strong, stocks down. Risk-off flows may not be over just yet if yields are in fifth wave. However, when yields will make new high and then top after 5th, thats when DXY can complete B/2 rally, with a lower high, when focus will shift away from US to other CB. However, of course, wave 4 on yields can get more complex if current trendline support is broken, so wave B/2 on DXY may take more time to unfold.
Grega

Yield Curve InversionThe chart above is a yearly chart of the ratio of the 10-year Treasury yield (US10Y) to the 2-year Treasury yield (US02Y). The chart is meant to highlight how extreme the yield curve inversion is getting. Typically a yield curve inversion is indicative of an impending recession.
Usually, the 10-year treasury should have a higher yield than the 2-year treasury since there is more risk involved when you invest in a longer-term treasury. Just recently, the 10-year treasury yield has reached a record low ratio of only about 85% of the 2-year treasury yield. In other words, investors are being compensated less for taking more risk.
As the chart below shows, the rate of change (on a quarterly basis) in the 2-year Treasury yield has been parabolic.
Below is the rate of change (on a quarterly basis) in the 10-year treasury which is typically more stable than the rate of change seen in shorter-term treasuries. The chart shows that the 10-year treasury yields have also been moving up at an unprecedented quarterly rate of change.
Many analysts look to an inversion of the 10-year yield with the 3-month yield, which has not yet occurred. The failure of the 10-year yield to invert relative to the 3-month yield is likely due to the unprecedented rate of change in the 10-year yield, which has historically remained relatively stable. If the 10-year yield is moving up at a higher rate of change than the 3-month yield, this can delay or prevent an inversion altogether.
Check out my analysis from July for a more in-depth discussion on why the failure (or delay) of the 10-year yield to invert to the 3-month yield might be signaling that we've entered into a new supercycle, in which higher yields may continue for the long term:

Us rates back trens upDue to inflationary pressure rates in the usa is getting stronger now.. so its trend up. Bad for stocks

1 2 & 10 Year yield seem to be toppish short term, $VIX in range🚨#yields look to be topping🚨
Things are FALLING into place!
Been posting on $DJI & $BTC RANGES
Risk reward was great late last week & on this dip (focusing on DOW JONES ATM)
$VIX staying 18-23 is ok
Adding more $ on dips
#stocks #crypto

US10Y Rejection cluster. Targeting the 1D MA200 again.The U.S. Government Bonds 10YR Yield (US10Y) has been trading within a Channel Down pattern ever since the October 21 2022 High and even though there might be a Diverging Channel Up (dashed lines) emerging, the current levels and the fact that it has failed to break higher in the last five 1D candles, make it a strong Resistance cluster.
With the 1D RSI also on such a rejection junction, we are turning bearish on the US10Y again, targeting the 1D MA200 (orange trend-line), which supported the price twice on January 19 and February 02. Potential contact (as a target) can be made at 3.510%. We will continue to be bearish only if the 3.320% Support breaks.
-------------------------------------------------------------------------------
** Please LIKE 👍, FOLLOW ✅, SHARE 🙌 and COMMENT ✍ if you enjoy this idea! Also share your ideas and charts in the comments section below! **
-------------------------------------------------------------------------------
💸💸💸💸💸💸
👇 👇 👇 👇 👇 👇

US 10 YEAR YIELDS (LONG ANALYSIS)The US 10 Year Yield is getting ready for another move to the upside, which shows us that the current falling wedge pattern it is correcting inside of, is considered Wave 4 of the Elliot Wave theory. I am expecting this to rocket up for the time being, alongside the Dollar Index.
US10Y - DXY = Positive Correlation
US10Y - XAUUSD = Negative Correlation

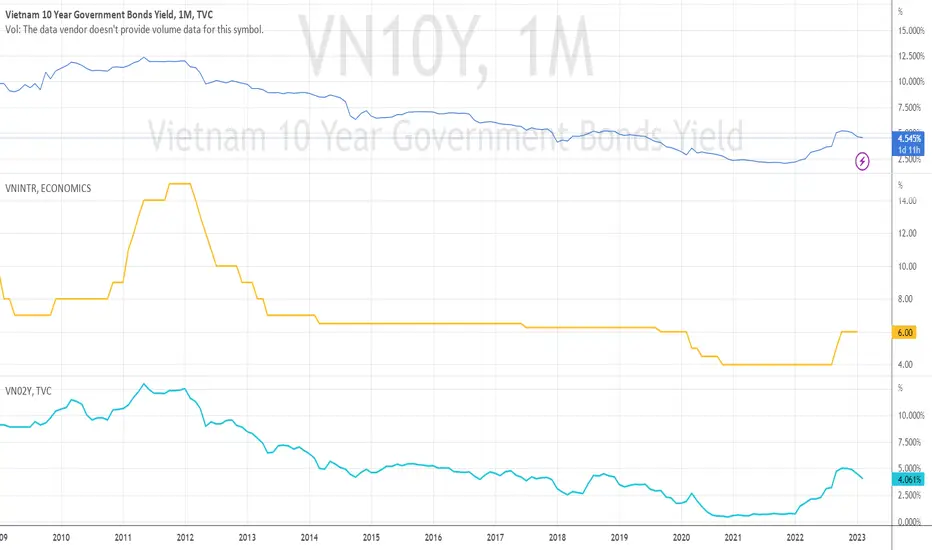
Viet Nam Rate vs Bond 10Y 2ybond interest rate and sbv interest rate
2 year bond interest rate
10 year bond interest rate
Bund yields going higher again?This is one of the patterns I have been looking at the last few months. If it is playing out Bunds are heading towards 3%.

US10Y : Going UP - WHY???Bond yield has been going up these past few days. What is happening? Many would think that this is because of recent events like the 'hot' jobs market and sticky headline inflation which may cause the Fed to continue hiking rates - higher/longer. Sounds plausible??? Maybe. It may look like the MARKET is now going along with the Fed instead of disagreeing with it earlier by driving yield down.
Note that inflation expectation is FALLING.
There is ONE consequence of a HIGHER yield. ASSET price will come down. The stock market and home prices will CRASH.
Already the country's finances is in a BAD shape. US is expected to pay up to $1T in interest alone. The consumer is already drowning in debt as evidence by the higher credit card debt at a time when interest is also a an all time HIGH. Both country and people may not last long holding up their finances.
So what is causing yield to rise?
One third of US DEBT outstanding is maturing this year. That is nearly $7T. And of the $7T, roughly $4T matures in the first 4 months of 2023. Since all these debt needs to be roll-over, this causes an increase in supply which means HIGHER YIELD!!!
This is crazy. With high yield, asset price will fall which leads to RECESSION. With recession, tax revenue will fall which will require US to borrow more. All these is happening while the Fed is doing QT!!!
So what kind of landing are we expecting? It is definitely not a SOFT landing. It is also not going to be a HARD landing. In my opinion, when debt is so HIGH, both public and private, it is going to be a CRASH LANDING. The consequence for the US and the entire world is devastating.
Good luck to us all.

US10Y - ST Pullback in Yield Ahead? Charted is a proposed price pathway for the 10yr T Bonds.
I'm looking for an easing in yield soon... in the 4.125 area (.786 Fib level) specifically, sometime in early March.
This will represent the top of the b wave of wave 4 off the Aug. 2020 low.
This expectation flies in the face of recently released inflation related news. As such my parameters are well defined here. A move beyond the afore mentioned yield will make me reassess the trade.
I'm seeing correlated markets showing signs of synergy with the expected outcome of this move.
Specifically I am expecting a move up in oil, technical ST pullback in DXY and a technical bounce in gold...which will fail and complete a fantastic short set-up.
See my Gold idea...

us rates trend downUs rates are getting weaker and showing that rates might be at least peak and need correction.. but just follow trend.. not predicting it.

🔥 US Bond Yields Suggest More Interest Rate Hikes: BEARISH 🚨The US 2-Year bond yields are important because they tell us how much returns an investor will get by lending his money to the government. In periods of higher economic risk, investors demand higher returns. Thus, the height of the bond yields can be used to determine whether we're in an economically risky period or not.
As seen on the chart, once the 2-year yield starts increasing, the FED will increase the interest rates. Higher interest rates are BEARISH for the markets.
With the 2-year yields making a new high recently, it suggests that the FED will need to increase the interest rates further. Is the current 25 basis points enough to tame inflation and market risk? Certainly not if the yields will keep like this.
If the yield will keep on rising there's a decent probability that stocks will continue to go down. If so, crypto will likely follow.
For now there's little reason to believe that we're going to make new bear-market lows, but once stocks will really start selling off this probability will increase. Will monitor.

EURBUND 20% appreciation expected
Probability: 37%
Aggressive pivot: 132.28
Conservative pivot 128.20
Lowest point (redline): 126.48
Minimum Target: 153.23
Target2: 167.93
Note : prediction will be invalid if target 1 is achieved before the setup is triggered

US 10Y Bond - Correction lowerPrice did not do an impulse from Oct 2022, so we are in a complex correction.
Targetting a move to 3.4 for now.

US10Y - TLT Part 2Unfortunately this website won't go past 20 years for 30Y yields, so I'm posting 10Y
Anyways, the notion that the Fed is done at 5% is pure fallacy. We're seeing inflation we haven't seen since the 80's, and a lot of it is structural. Aside from labor shortage and Russian oil, we have way too much deficit spending by the government and the Fed balance sheet exploded during the COVID QE.
Having taken out college loans at 10% interest, I wouldn't be surprised at all if yields went above 10%. People pegging the peak at 5 or 6% are gonna be in for a freakin' shock. I also expect rates to stay high until the Fed balance sheet comes back down, and we're talking 10 years or so because they're under water on all of the MBS they hold.
That doesn't mean the stock market has to go down though, the stock market went up in that era aside from the '87 crash. Focus in inflation trades, stay away from bonds, especially TLT, lol.
Note: I realize TLT is 20Y+, but no historical charts available for anything besides 10Y

Fading Bonds rally Long US10Year Yield / Short TY Future fading the YTD bond rally driven by Central Banks Pivot hope misread by markets, it seems that the short positioning has exacerbated the buying so far this year.
Things should start to normalise into month end and ahead of FED/ ECB meetings in February.
Short US10Y Future - Expect the Yield rise by 20bps

US 02Y possible black swan for stocksUS 02Y is close to breakout from the bull flag. After reaching the top, the price of 2 y did consolidate but never dropped hard. After consolidation on this level, it seems it's ready to break out of the bull flag which would be very bullish for 2 Y but bearish for the market as a whole. Remember, even though a lot of retail traders follow FERD, they should follow 2 Y yield as that is what FED and Powel followed. FED is much smaller than the bond market, and the interest rate on the 2-year bond is something that is important for FED.
Also one of the main problems for retail traders is most of them don't follow yield inversion which is now at a huge level. Meaning the interest rate is now higher for a 1 or 2-year bond than on 10 or 30 which is insane and is a sign of huge money indicating something big will break out soon. Every yield inversion till now finished with massive stock collapsing, so will likely now too.
With the breakout of the bull flag, there would be a trigger possibility for 2 y to retest highs which would mean the FED fund rate must go much more than 5% which would be very bullish for US Dollar/DXY and very bearish for stock, crypto, and gold and silver/ commodities as a whole.
A good thing would be that all would have pressure on inflation which we all need at this moment.

US10Y, XAUUSD AND DXY CONFLUENCE Hi trader
The xauusd is trying support and the us10yr is testing previous resistance, but the dxy is already in a breakout phase, so guess? :)
My trading strategy isn't intended to be used as a signal service. It's a process of gaining knowledge of market structure and improving my trading abilities.
Like and subscribe and happy trading to all

US10Y SELLWelcome to my account. There is a high probability that the market will go down. With a strong model formation. Double button. He also made the area retest twice. The price fails to breach the broken resistance 3.900. I think the price will be negative over time. And we see its price is 3500. In the first stage

10 Year yield Elliot wave count ideaobviously its risky to try to put EW on something like the US10Y yield with so many issues in the world right now but i couldnt help notice how clean the count looks at the moment.
NOT trading advice.

Yields in the long runTaking a long term view, we should never forget what 10y yields did this year. We are in a era of high treasury returns, right in time as the governments safety is at its worst.

The BundThe bund is looking a bit bullish and thats a bit of good news i think especially with all this bearishness infecting pretty much everything well at least for a bit until joining the rest...
