✅US30_BONDS BEARISH BIAS|SHORT🔥
✅US30_BONDS price went up sharply
But a strong resistance level was hit
Thus, as a pullback is already happening
And a move down towards the target shall follow
SHORT🔥
✅Like and subscribe to never miss a new idea!✅
Government bonds


2 Year-10 Year Yield curve deeply invertedIf there is any tell-tale sign that a massive recession is coming, it is this: 2-Year - 10-Year yield curve inversion. If you look back in history you would see that every time this yield spread has inverted, the economy and the stock market has gone into a recession. The problem is that this is the deepest inversion from an historical perspective - deeper than 2008 inversion. This can play out very badly for the S&P500, and the stock markets in general.
Will S&P500 be in big trouble because of this?

US30Y Short From Resistance! Sell!
Hello,Traders!
US30Y went up sharply
Retested the horizontal resistance
And made a pullback so I think
We will see a retest
Of the support level below
Sell!
Like, comment and subscribe to boost your trading!
See other ideas below too!

Does the yield curve inversion signal recession?The famous negative curve.
This market concept is used when the US02Y or US03Y operate at higher levels than the US10Y, this behavior usually anticipates recessions, but why does this happen?
The inversion of the yield curve distorts the expected functionality of the financial system.
Under "normal" conditions, raising funds in the short term for investment in longer terms is used to provide positive arbitrage between interest rates on liabilities (paid) and assets (received), a strategy subject to the limits of the rollover capacity of the liabilities and raising new funds.
The availability of assets with higher premiums and liquidity, US02Y and US03Y, makes it less attractive to offer funds for longer terms < US10Y, and more expensive to raise funds for those who demand funds for shorter terms.
So the interest curve is considered a kind of thermometer of what lies ahead in an economy, and it is the graphic representation of how much investors are charging to lend money in different maturities, and once it is inverted, it means that it is more expensive to borrow in the short term than in the long term – an unusual thing, because more distant payment dates mean greater risks for the borrower.
In the US economy, a widely documented fact is that yield curve inversion (i.e., when there is a negative differential between long-term versus short-term bond yields) is a good leading indicator of periods of economic contraction. four to six quarters ahead.
According to data available on the Federal Reserve website, yield curve inversion has preceded every US recession since 1950, with the exception of a false signal in 1967.
There is also evidence that indicators of this nature are important predictors of periods of economic contraction in other countries.
But are there any silver linings to this unusual reversal scenario? Yes, in these moments of greater uncertainty we have an interesting opportunity to buy good companies at low prices.
This is because after the monetary tightening cycle, the economy usually weakens, during this period risk assets suffer, considering that their future projections will suffer due to the scenario, so many of the market participants seek security in bonds, others seek to anticipate the recovery considering that as soon as this CORRECTIVE cycle ends, a new UPWARD CYCLE tends to maintain perennial companies and give birth to many new companies that arise in the face of challenging scenarios.

Yield Curve Inversion And the last 4 RecessionsThe Yield Curve Inversion is considered a good indicator for anticipating a Recession.
As we can see in this Idea, in the last 30 years, when the Yields were negative, the recession occurred after several months.

FOMC Meeting Next Week: Bank of America Expects 50bp Rate Hike The Federal Open Market Committee (FOMC) is set to meet next week, and investors are eagerly anticipating the outcome of the meeting. Bank of America Global Research has discussed its expectations for the meeting, saying that it expects the Fed to raise its target range for the federal funds rate by 50bp in December to 4.25-4.5%.
According to Bank of America, the Fed has telegraphed this move over the last few weeks through its communications. However, the more important question is where the Fed will go next. Bank of America expects the median forecast for 2023 to move up by 50bp to 5.125%, which is consistent with its terminal rate. The bank also expects the dot plot to show 100bp of cuts each in 2024 and 2025.
In addition, Bank of America expects the macro projections in the Statement of Economic Projections (SEP) to be revised to show lower GDP growth and inflation than in September, and higher unemployment.
At the press conference following the FOMC meeting, Bank of America expects Chair Powell to push back against easing in financial conditions and remind investors that a slower pace of hikes does not mean a lower terminal rate. The bank believes that Powell will stress that the Fed's job is far from done.
Overall, Bank of America expects the FOMC meeting next week to be consistent with the Fed's previous communications and for there to be no major surprises or shifts in policy.
Some Jargon Explained
The Dot Plot
The dot plot, also known as the Summary of Economic Projections (SEP), is a visual representation of Federal Reserve policymakers' individual forecasts for where they think key interest rates will be in the coming years. The dot plot shows the central tendency, or the middle of the range, of the individual forecasts for the federal funds rate.
Each participant in the FOMC meeting provides their own individual forecast for the federal funds rate at the end of each calendar year, as well as over the longer run. These forecasts are then plotted on a chart, with the dots representing the individual forecasts and the lines connecting the dots indicating the median of the group's forecasts.
The dot plot is released four times per year, along with the FOMC's policy statement, and provides insight into the collective thinking of FOMC members about the future path of interest rates. It is an important tool for investors to gauge the future direction of monetary policy.
The Terminal Rate
The terminal rate, also known as the long-run federal funds rate or the equilibrium real interest rate, is the interest rate that the Federal Reserve believes is consistent with the long-run health of the economy. It represents the level of the federal funds rate that is neither expansionary nor contractionary and is expected to prevail in the long run, once the economy has reached its full employment and price stability goals.
The terminal rate is not a fixed number, and can change over time depending on a variety of factors such as changes in the underlying productivity and demographic trends of the economy. The Federal Reserve uses the terminal rate as a reference point when setting its short-term interest rate targets.
In general, the terminal rate is expected to be lower than the current federal funds rate, as the Fed typically raises interest rates in the short run to prevent the economy from overheating and then lowers them in the long run to support economic growth. This means that the terminal rate can provide important information about the future direction of monetary policy.

US02Y Showing the way to stock market recoveryThe US02Y has just completed a Head and Shoulders (H&S) pattern, which is a technical formation found on tops. The very same formation was last seen in October - December 2018 and caused a massive long-term drop on the US02Y. Check also the identical 1D RSI sequences leading to the top with Channel Down patterns.
The US02Y peak was translated into a fall on inflation (orange trend-line) and the stock market (S&P500 blue trend-line) immediately reacted. We've already seen a strong stock rally these past two months, but so far seems counter-trend.
Do you think the Fed and the CPI report next week can help sustain it?
-------------------------------------------------------------------------------
** Please LIKE 👍, SUBSCRIBE ✅, SHARE 🙌 and COMMENT ✍ if you enjoy this idea! Also share your ideas and charts in the comments section below! This is best way to keep it relevant, support me, keep the content here free and allow the idea to reach as many people as possible. **
-------------------------------------------------------------------------------
You may also TELL ME 🙋♀️🙋♂️ in the comments section which symbol you want me to analyze next and on which time-frame. The one with the most posts will be published tomorrow! 👏🎁
-------------------------------------------------------------------------------
💸💸💸💸💸💸
👇 👇 👇 👇 👇 👇

When does the recession become official?Fed funds rate crossing above the 2 and 10 year yield(s) can give us a pretty good idea...

US10Y Time for it to decide the long term trendThe US10Y is approaching the Higher Lows support of the 2022 bullish trend. Holding it can make the price rebound back to the 1D MA50 (blue line) and the dashed line of its growth zone at least.
A break below it and in particular the 1D MA200 (orange line) can turn the trend bearish long term to the 1W MA100 (red line).
The 1D RSI is on its (oversold) Support level as well.
Follow us, like the idea and leave a comment below!!

10 year yield has broken the trendlineThis chart yesterday had the yield at the bottom of this up channel. Now it looks like more like it is breaking down. Yields heading lower. This makes the yield curve even more extremely inverted which is a recession predictor.
USD vs US yields : 2017 compared to 2022USD vs US yields ***2017 compared to 2022**
Think US yields can see a rally short-term now after top divergence and 5 down on yields. The question is how far can USD go and stocks drop till US yields complete an A-B-C bounce. DXY resistance at 108-109.

Is oil price about to collaps ?The history of US. Oil/$ chart vs US02Y-US10Y chart (inverted) : show that the cude price is lagging the move of the US. spread between 2s/10s. "Is oil price is about to collaps ? or this time is diffrent because of OPEC+ cutts ?"

10 year yield at the bottom of a channelIts quite a nice looking channel here on the 10 year yield chart. Probability of a bounce higher off this support level seems high indicating potentially a fall in bond prices in the short run.

US10Y Bounce at 3.332% then to 5.376 by Summer 2023The current pitchfork trend is holding and I'm looking at the US10Y reverse at 3.332% this month. I'm also expecting the fed to over tighten or some other news event to drive the US10Y to 5.376% by June 2023. The nature of pitchforks are able to easily visualize the physics of the market and I'll do my best below to explain what I'm seeing.
From a price action perspective the US10Y broke the median from the beginning of time and is coming back to re-test it as support.
As of August 2011 gap down to Jan 2014 price action has respected that median range through today.
In the world of physics, when you have a huge swing away from the median, you'll also have the same energy swinging back in the other direction. Think of a swinging palm tree in the wind.
The same is happening here and is illustrated by capturing the breakdown in Feb 2020 where price quickly broke trend then held the 3 standard deviant move down during the 2020 crash. US10Y has quickly made a move in the other direction and is preparing to breakout with huge force.

10yr inflection pointThe 10year is confused! will 2023 be bullish or bearish for earnings? We won't know until probably Q1 earnings, so until then markets will be volatile. If 10Yr heads to 5% you can bet earnings will continue to go higher, and S&P will become cheaper even at around 4000. if 10yr sells off and heads to 1.5% means the fed are cutting rates and earnings are dropping like a lead balloon. Regardless of the fed cutting rates, S&P will become expensive and will need to correct or crash!
I have no idea, either way, the crash comes now, or after the 10yr hits 5%, but the earnings crash is coming...laying off people isn't an option, it creates a crash....
ps every single recessionary metric is screaming recession....

Yield inversion to reach bottom January 2023For DOT COM bubble, when yield inversion reached bottom, the top of the markets were 182 days later.
IMO we'll reach bottom in January 2023 and markets will peak 182 days later, in September 2023.

US 2yr Yield Turning OverThe 2yr yield appears to be rolling over which is bullish for stocks. Have to see if there is a weekly reversal

NO ONE IS TALKING ABOUT THIS.I thought I'd share something very interesting, that may occur in the upcoming weeks, the upcoming months.
Looking at the US Bond Yields, we see it forming a rising wedge pattern.
In Elliot Wave Theory, it is called a leading 5th wave diagonal.
The past weekly candle closed as a tweezer top AND finding resistance at the 0.786 fibonacci extension level.
This may signal a bearish reversal of conditions.
Now you all must be thinking, "Oh no... Not another Bearish idea from this guy..."
HOL'UP. WAIT A MINUTE.
A decrease in bond yields tend to have an Inverse Effect on asset markets.
When Bond Yields decrease, It means investors are more likely to allocate their capital away from bonds (safe-havens) to high-risk high-reward investments. Vice versa when bond yields increase.
Just a few closing thoughts, please keep in mind that although it is a bearish pattern, we must not assume a reversal until Price breaks down from this wedge.
I hope you all really enjoyed my analysis on the US10, fellow traders! 🥰
Take care, God Bless, & let's kill it at the charts! 🥰🥰

INTEREST RATES STILL HAVE MOMEMTUMFrom simple market structure, interest rates doesn't look like it would reduce at all, it will still go above the roof
Of course, this would affect inflation rate and destroy the economy further still
Taking notes of the Stock against market that is directly affeected by interest rates. Currently, stocks are rallying due to the interest rates decrease.
I expect a rally in the interest rates as from next year, due to the seasonal tendency of Stocks declining

US10 Year BondUS10Y bond yield seems near support. If it take support there and reverse on upside then some correction may come in equity

US02Y is the key for stocks and it has started to drop!This is a 1W time-frame chart, showing the correlation between the U.S. Government Bonds 2 YR Yield and the S&P500 (blue trend-line). Some may perceive the recent 2-month rally on stocks as a coincidence but the US02Y price action shows that it is not and has a direct correlation with it.
The 1W RSI on the US02Y has been falling within a Channel Down since the start of February 2022, while at the same time the actual price has been rising within a Channel Up. That is a technical Bearish Divergence. The same Bearish Divergence was last seen from late January 2018 up until the week of November 05 2018. As shown on the chart this lasted 41 weeks (287 days).
The start of this Bearish Divergence happened when the stock market(S&P500) had an initial pull-back event entering into a year long period of volatility, followed buy an even stronger correction. Once the US02Y started to drop, the stock market bottomed and started rising sustainably (until of course the non-technical black Swan event of COVID).
Right now, we are two weeks past the 41 week (287 days) mark and the US02Y has been dropping for 4 weeks. As mentioned, the stock market has been (aggressively) rising since the October 10 2022 1W candle. The fractals are identical and this could be a repeat of the 2019 rally. Whether we see it extending or not, the US20Y certainly holds the key.
-------------------------------------------------------------------------------
** Please LIKE 👍, SUBSCRIBE ✅, SHARE 🙌 and COMMENT ✍ if you enjoy this idea! Also share your ideas and charts in the comments section below! This is best way to keep it relevant, support me, keep the content here free and allow the idea to reach as many people as possible. **
-------------------------------------------------------------------------------
You may also TELL ME 🙋♀️🙋♂️ in the comments section which symbol you want me to analyze next and on which time-frame. The one with the most posts will be published tomorrow! 👏🎁
-------------------------------------------------------------------------------
💸💸💸💸💸💸
👇 👇 👇 👇 👇 👇

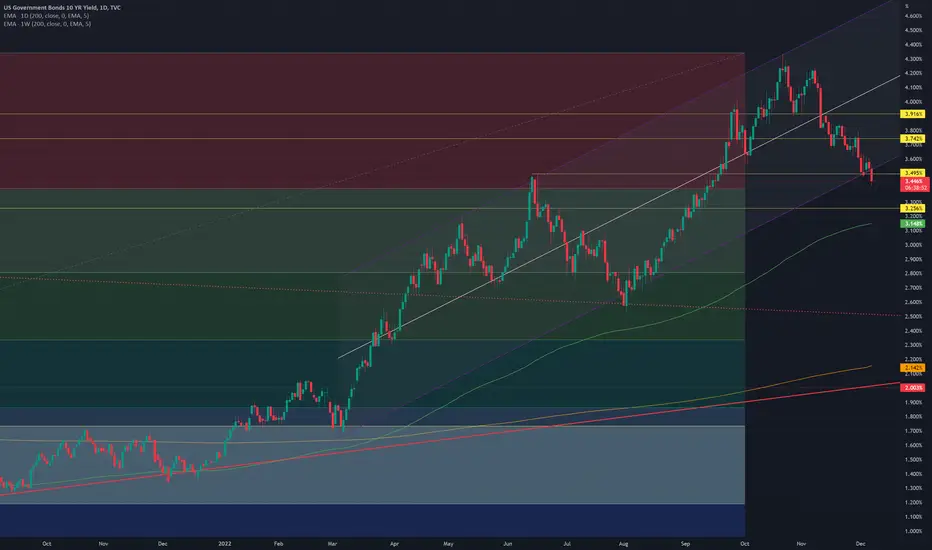
us yields bottoming soonUS 10y yields have pulled back from over 4.3% to below 3.6% in a matter of weeks on the back of FED HOPIUM.
We may get a slowing in rate rises but not due for a pause yet and way too soon to price in cuts.
I see yields rebounding from around 3.50s% back towards/above 4% in coming weeks/months.
