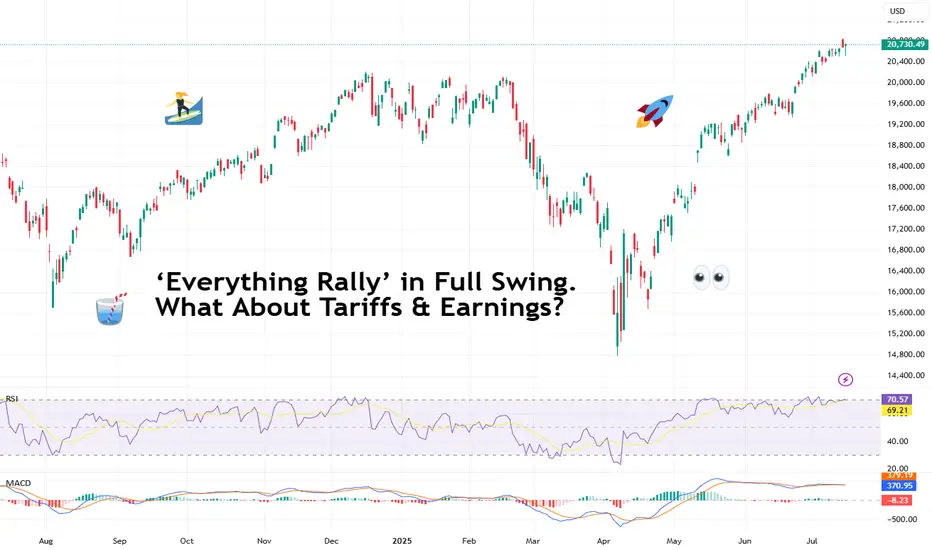
‘Everything Rally’ in Full Swing. What About Tariffs & Earnings?It’s official: we’re witnessing one of those rare, confounding moments when nearly every big risk-on thing is screaming ATH! (All-Time High, for those who haven’t worn out that abbreviation on X this month).
Bitcoin BITSTAMP:BTCUSD blew past $122,000 on Monday — a turbo rally that made anyone who

The best trades require research, then commitment.
Get started for free$0 forever, no credit card needed

Scott "Kidd" PoteetThe unlikely astronaut

Where the world does markets
Join 100 million traders and investors taking the future into their own hands.
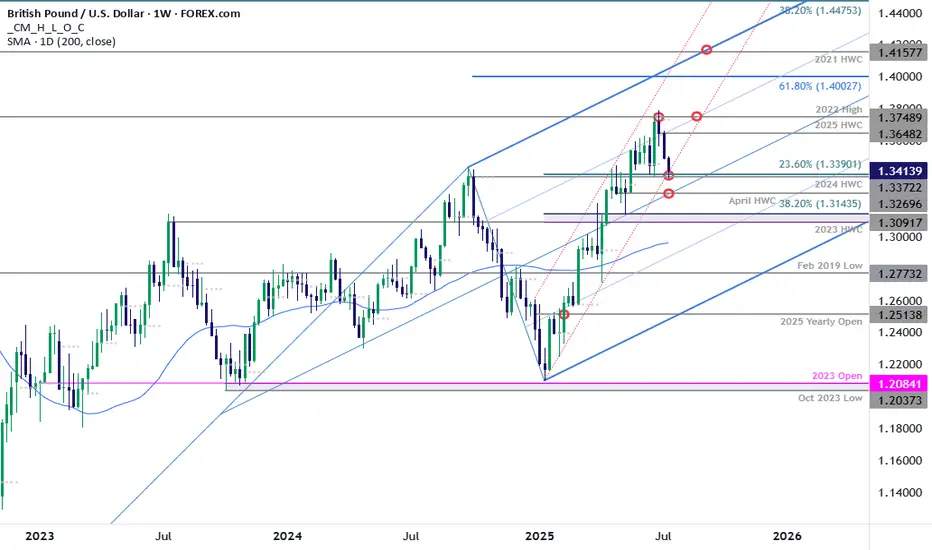
GBP/USD Plunges to Make-or-Break SupportSterling is poised to mark a third consecutive weekly decline after turning from resistance at multi-year highs. The decline takes price into critical support at the yearly trendline- this is a make-or-break level for the bulls.
GBP/USD is testing confluent support today at 1.3372/90- a region defi
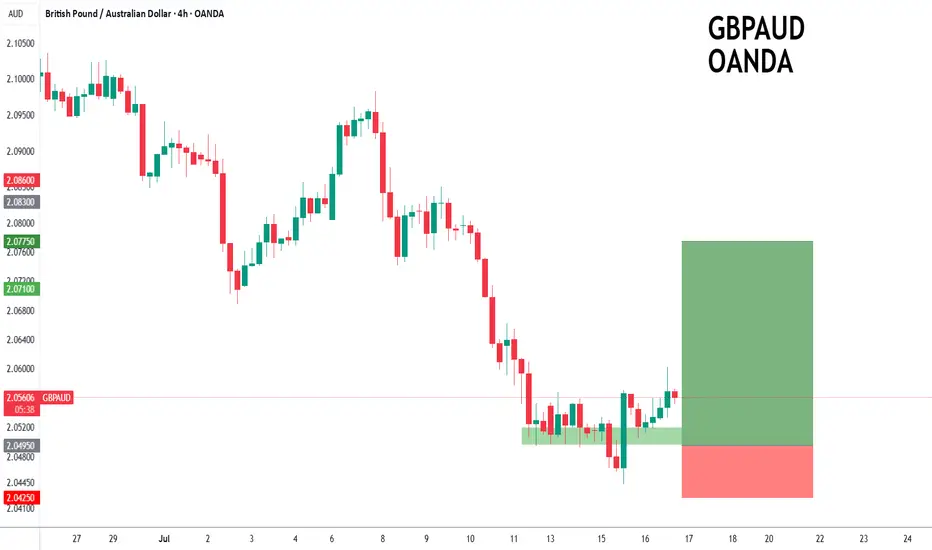
GBPAUD to turnaround?GBPAUD - 24h expiry
The primary trend remains bullish.
Price action looks to be forming a bottom.
We look for a temporary move lower.
Preferred trade is to buy on dips.
Bespoke support is located at 2.0495.
We look to Buy at 2.0495 (stop at 2.0425)
Our profit targets will be 2.0775 and 2.082
ETH eyes on $3431.83: Golden Genesis fib may END this SurgeETH finally got a surge after a long consolidation.
But has just hit a Golden Genesis fib at $3431.83
Like hitting a brick wall, it is now staggering back.
It is PROBABLE that we orbit this fib a few times.
It is POSSIBLE that we reject here to end the surge.
It is PLAUSIBLE that we Break-n-Retest

Spotify's Valuation Is Red-Lining (Rating Downgrade)📈 Spotify's Remarkable Comeback
Spotify NYSE:SPOT has transformed itself from a money-losing audio platform into a disciplined, profit-generating tech firm. Through smarter podcast investments, layoffs, and better monetization strategies, the company recently swung from red ink to positive free c

Using 1 min time frame for entries on VX algo & day tradingwhat time frames do you use to confirm entries outside of a buy signal?
If I am day trading, I will mainly use the 1 minute time frame to look for moving average support and resistance, and read the candle stick patterns as well from that chart.
However, there are times I'll switch to a 5 minute a

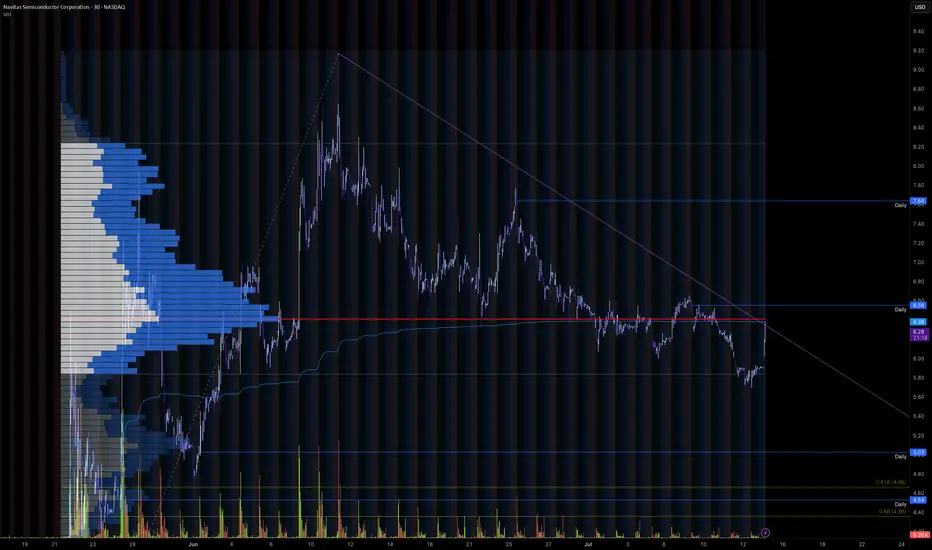
Trendline Breakout for Wave 3Navitas is currently looking at breaking out of its recent downtrend to potentially begin wave 3 of its move up, which, as we all know, is the most impulsive move.
Could be very tasty after a 350% pump already
Need to get above the range POC and breakout of the trend line, would be looking to get
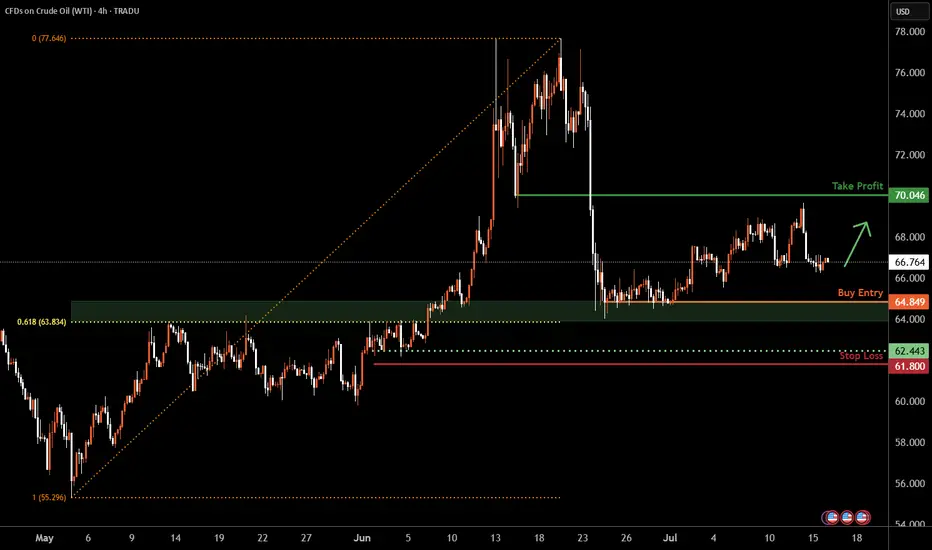
WTI Oil H4 | Potential bounce off a multi-swing-low supportWTI oil (USOIL) is falling towards a multi-swing-low support and could potentially bounce off this level to climb higher.
Buy entry is at 64.84 which is a multi-swing-low support that aligns closely with the 61.8% Fibonacci retracement.
Stop loss is at 61.80 which is a level that lies underneath a
BITCOIN- MONSTER ORDERS IN THE BOOK -> You Know What This Means COINBASE:BTCUSD “Monster orders” are exceptionally large buy-limit orders clustered roughly 7 % beneath the current market price.
Large buy-limit walls can act like a price magnet—deep liquidity attracts algos and traders hunting fills, often pulling price straight toward the level.
Once the wall

End-of-Session Market ReviewToday was a solid trading day with some interesting moves across the markets:
S&P 500: The market trended upwards from the open, gradually moving into and above the prior day’s value area, closing near the high of that range.
NASDAQ 100: After some initial back-and-forth, it climbed above the prio

See all editors' picks ideas
Crowding model ║ BullVision🔬 Overview
The Crypto Crowding Model Pro is a sophisticated analytical tool designed to visualize and quantify market conditions across multiple cryptocurrencies. By leveraging Relative Strength Index (RSI) and Z-score calculations, this indicator provides traders with an intuitive and detailed sn

Dynamic Gap Probability ToolDynamic Gap Probability Tool measures the percentage gap between price and a chosen moving average, then analyzes your chart history to estimate the likelihood of the next candle moving up or down. It dynamically adjusts its sample size to ensure statistical robustness while focusing on the exact de

EVaR Indicator and Position SizingThe Problem:
Financial markets consistently show "fat-tailed" distributions where extreme events occur with higher frequency than predicted by normal distributions (Gaussian or even log-normal). These fat tails manifest in sudden price crashes, volatility spikes, and black swan events that traditi

Divergence Screener [Trendoscope®]🎲Overview
The Divergence Screener is a powerful TradingView indicator designed to detect and visualize bullish and bearish divergences, including hidden divergences, between price action and a user-selected oscillator. Built with flexibility in mind, it allows traders to customize the oscillator

Logarithmic Moving Average (LMA) [QuantAlgo]🟢 Overview
The Logarithmic Moving Average (LMA) uses advanced logarithmic weighting to create a dynamic trend-following indicator that prioritizes recent price action while maintaining statistical significance. Unlike traditional moving averages that use linear or exponential weights, this indic

Volumatic Support/Resistance Levels [BigBeluga]🔵 OVERVIEW
A smart volume-powered tool for identifying key support and resistance zones—enhanced with real-time volume histogram fills and high-volume markers.
Volumatic Support/Resistance Levels detects structural levels from swing highs and lows, and wraps them in dynamic histograms that re

True Close – Institutional Trading Sessions (Zeiierman)█ Overview
True Close – Institutional Trading Sessions (Zeiierman) is a professional-grade session mapping tool designed to help traders align with how institutions perceive the market’s true close. Unlike the textbook “daily close” used by retail traders, institutional desks often anchor their

Open Interest Footprint IQ [TradingIQ]Hello Traders!
Th e Open Interest Footprint IQ indicator is an advanced visualization tool designed for cryptocurrency markets. It provides a granular, real-time breakdown of open interest changes across different price levels, allowing traders to see how aggressive market participation is distribu

Zigzag CandlesCan't deny that I am obsessed with zigzags. Been doing some crazy experiments with it and have many more in pipeline. I believe zigzag can be used to derive better trend following methods. Here is an attempt to visualize zigzag as candlesticks. Next steps probably to derive moving average, atr (alth

MathStatisticsKernelFunctionsLibrary "MathStatisticsKernelFunctions"
TODO: add library description here
uniform(distance, bandwidth) Uniform kernel.
Parameters:
distance : float, distance to kernel origin.
bandwidth : float, default=1.0, bandwidth limiter to weight the kernel.
Returns: float.
triangular(distance

See all indicators and strategies
News didn't load
Looks like that didn't go very well. Let's try again.
Community trends
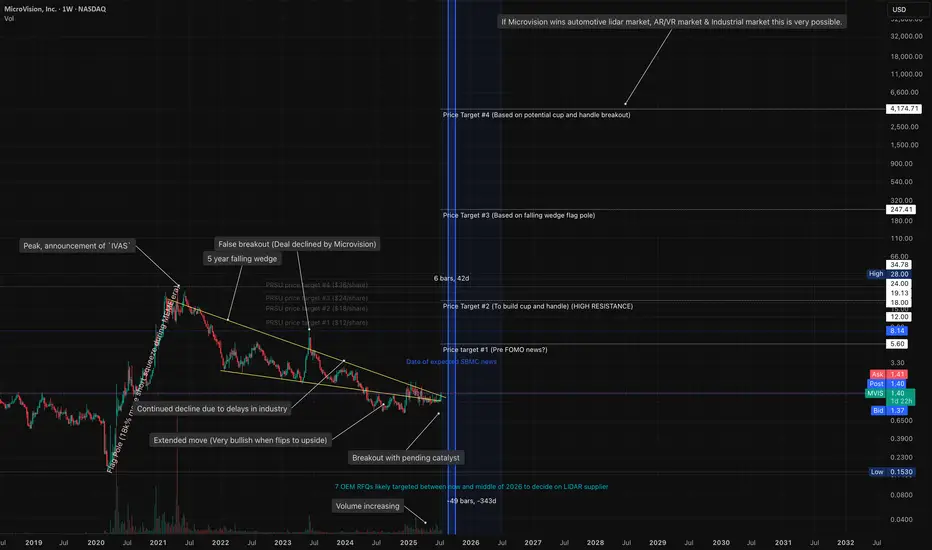
Markets Converging MVIS market changing potentialMicrovision is weeks away from hitting an intense inflection point.
Pending news for SBMC (decision date August 29th )
Microvision is partnered with NVDA for their driving lidar and software -- and have a plug and play system better than any competitor. (an update was made to MVIS website while
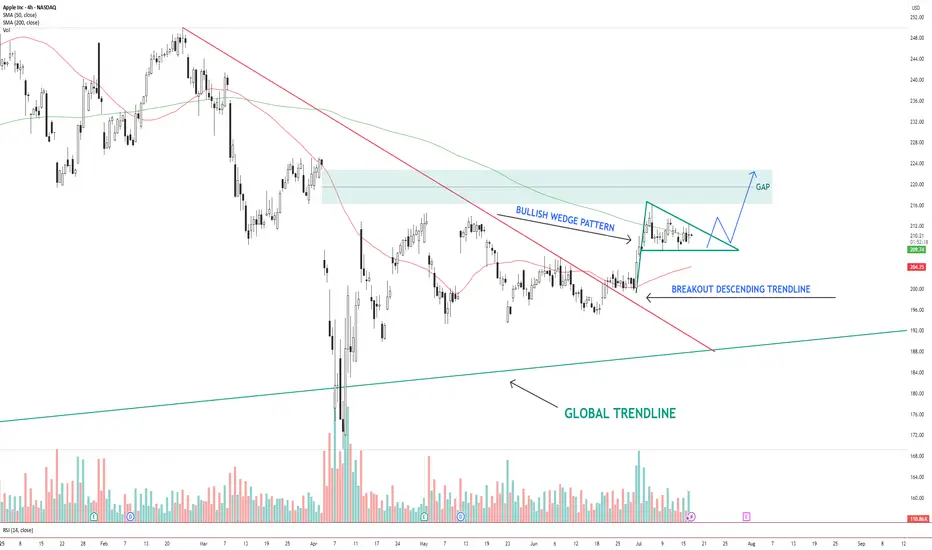
AAPL – Bullish Wedge Breakout Setup Toward Gap FillAAPL NASDAQ:AAPL has broken out of a descending trendline and is now consolidating inside a bullish wedge pattern . Price is holding above the 200 SMA and hovering near the 50 SMA.
The structure suggests a potential breakout above the wedge, with a clear gap area between $216–$224 acting
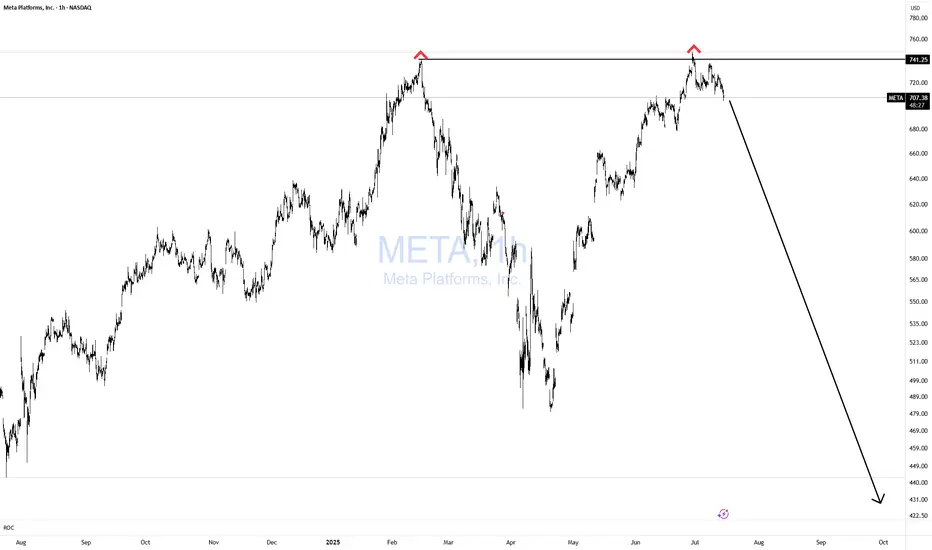
META Double Topping!Does it get any easier than this? NOPE!
If you can't spot this pattern from 1000 miles away, then you need a lot more time in the seat, training yourself in TA.
Simple with great risk reward!
Bulls GTFO!
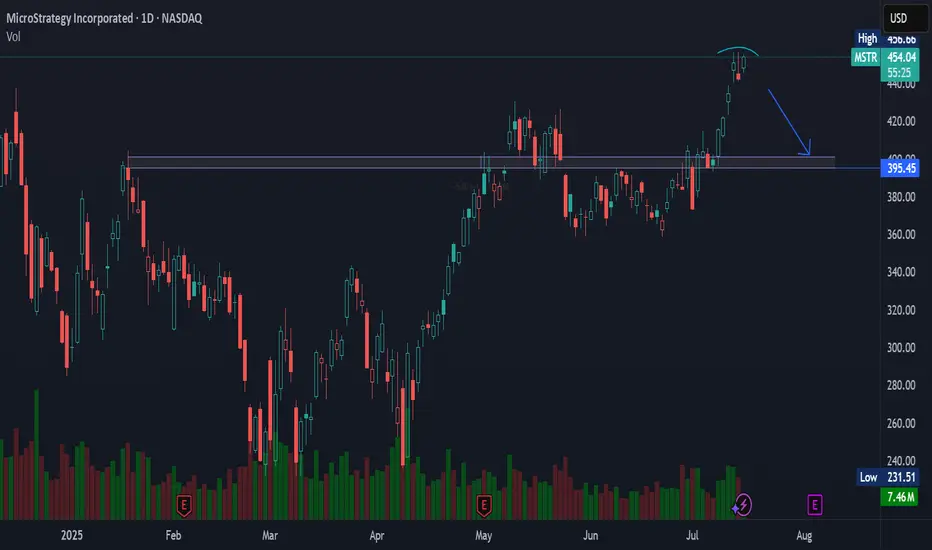
MSTR NASDAQ:MSTR looks like it’s gearing up for a pullback — eyes on the $395 level for a potential retest.
Watch the support. 👀📉
#MSTR #Bitcoin #Stocks #Tech #Trading
New Setup: DAVEDAVE has gotten oversold with a potential bullish divergence on my RSI-5. If DAVE can manage to close higher than the previous candle's high, then we can look for a bounce providing the rest of the Market is bouncing also.

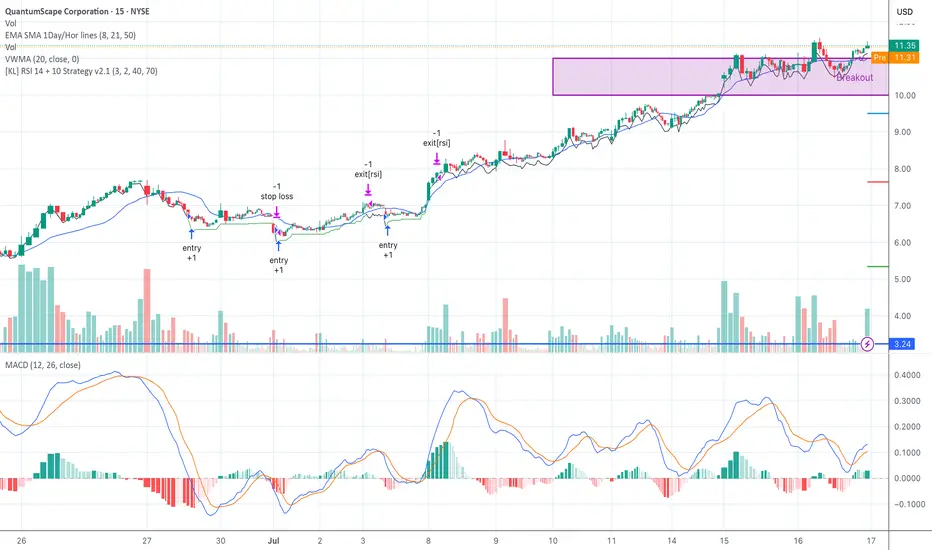
QS Breakout Setting Up — Entries Triggered, Waiting for ConfirmSeed System entries are printing on QS with trailing profit zones holding firm.
MACD crossovers confirming the move. Watching RSI cooling just under breakout resistance at $11.35.
A push through $11.50 with volume and I’m adding — slowly.
Support at $10.03, cut fast if price shows weakness.
Let
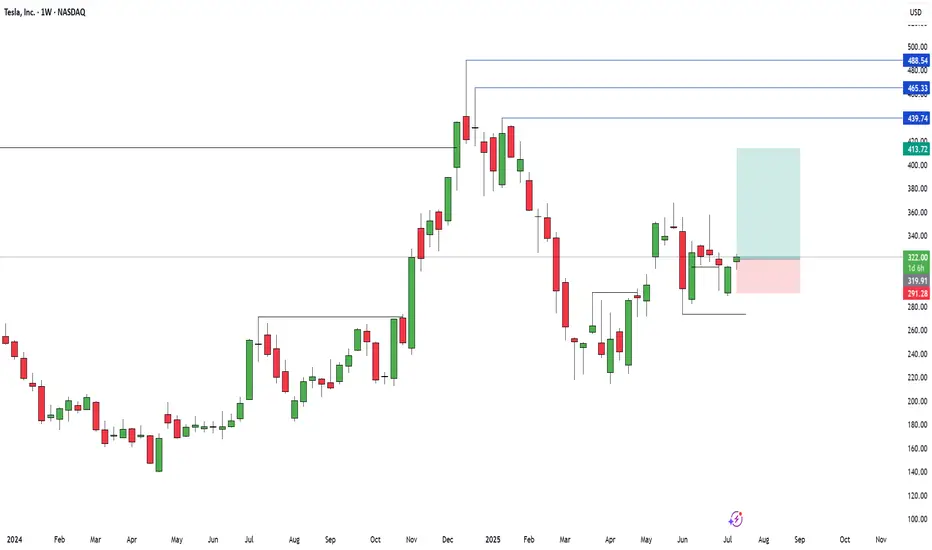
Long entry TSLA - Weekly Time FrameIt seems price failed to make a lower low that reversed the most "immediate" uptrend. Therefore, trying to play the entry against those who went short.
Lets see how it plays ouy
NVDA SELLSELL NVDA at 149.00 to 163.00, riding it back down to 93.00 to 77.00 as Profit Targets, Stop Loss is at 172.00!
If anyone likes long mumbo jumbo garbage analysis, than this is NOT for you.
Also, if you are afraid of risk, failure, and want only a 100% sure thing, than
run as fast as you can from th

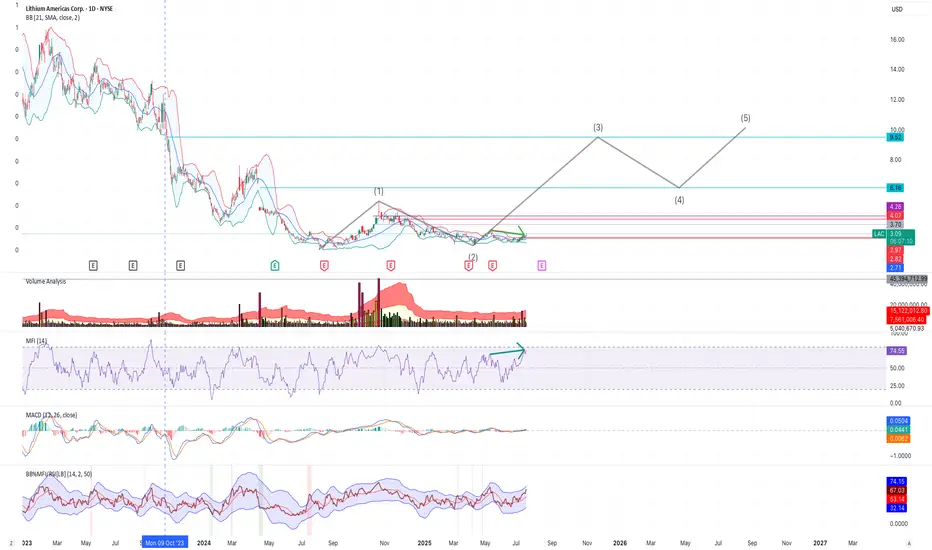
The 3rd Nevada Lithium Elliot WaveI believe LAC may have begun its 3rd elliot wave, with a bottom at $2.33. There also appears to be nice recent strong base support around $2.80. In addition, there appears to be a deviation between price and money flow, as shown with the green arrows - with a potential correction available to push p
NBIS 55 BREAKOUT in the works!NBIS is an AI darling and a big momentum stock. When it goes it goes! it has been testing this 55 level for some time now.
We recently had a big GS upgrade that "woke" it up. A rest day here and another one will let the 9ema catch up to it and allow for a big breakout. If we take out this trendl

See all stocks ideas
Today
TCBITexas Capital Bancshares, Inc.
Actual
1.58
USD
Estimate
1.29
USD
Today
ELVElevance Health, Inc.
Actual
8.84
USD
Estimate
8.91
USD
Today
PEPPepsiCo, Inc.
Actual
2.12
USD
Estimate
2.03
USD
Today
CFGCitizens Financial Group, Inc.
Actual
0.92
USD
Estimate
0.88
USD
Today
IIINInsteel Industries, Inc.
Actual
0.78
USD
Estimate
0.69
USD
Today
FITBFifth Third Bancorp
Actual
0.88
USD
Estimate
0.87
USD
Today
MMCMarsh & McLennan Companies, Inc.
Actual
2.72
USD
Estimate
2.67
USD
Today
SNASnap-On Incorporated
Actual
4.72
USD
Estimate
4.63
USD
See more events
News didn't load
Looks like that didn't go very well. Let's try again.
Community trends
ETH eyes on $3431.83: Golden Genesis fib may END this SurgeETH finally got a surge after a long consolidation.
But has just hit a Golden Genesis fib at $3431.83
Like hitting a brick wall, it is now staggering back.
It is PROBABLE that we orbit this fib a few times.
It is POSSIBLE that we reject here to end the surge.
It is PLAUSIBLE that we Break-n-Retest
2/ Altseason: Live - My Coin-Picking StrategyThe "Altseason: Live" experiment has unofficially begun. While many are debating if altseason will happen at all, I prefer to act. We may not see a classic, market-wide surge across all coins. The market has changed. But I believe that targeted, explosive opportunities always exist.
In this post, I

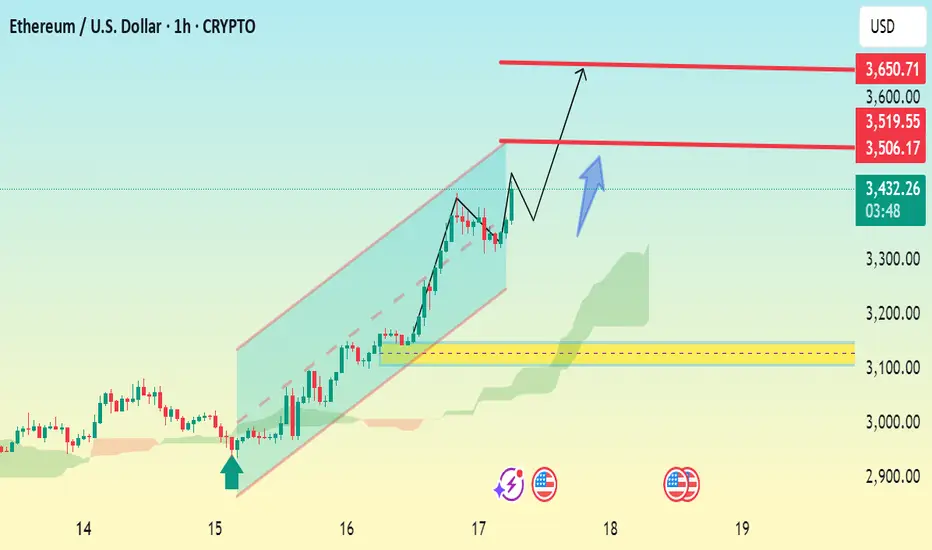
ETHUSD 1h Bullish Reversal SetupChart Analysis Summary:
Current Price:
$3,429.21 (at the time of the screenshot)
Trend:
Strong uptrend within a bullish ascending channel.
Price has been respecting the trendline and moving upward steadily.
Key Chart Patterns & Tools:
Ascending Channel: ETH is trading within an upward slopi
ETH - If You Know ...... You Know whats Coming
NYSE:BLK $BUIDL tokenized U.S.-Treasury fund launched on COINBASE:ETHUSD in Mar 2024—Wall Street is already settling real dollars on-chain.
NYSE:JPM JPMD stablecoin just went live on Base (an COINBASE:ETHUSD L2), piping wholesale payments from a $4 T balance-sheet straight
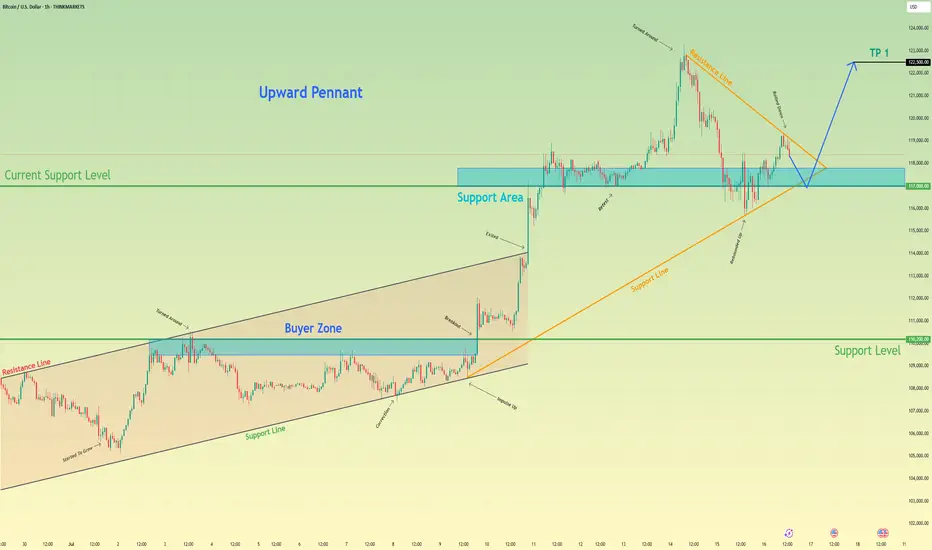
Bitcoin may exit of pennant and then rebound up of support areaHello traders, I want share with you my opinion about Bitcoin. Earlier, the price was moving inside an upward channel, respecting both the resistance and support boundaries. After reaching the buyer zone (110200–109500 points), BTC made a strong impulse up, breaking out of the channel and entering a
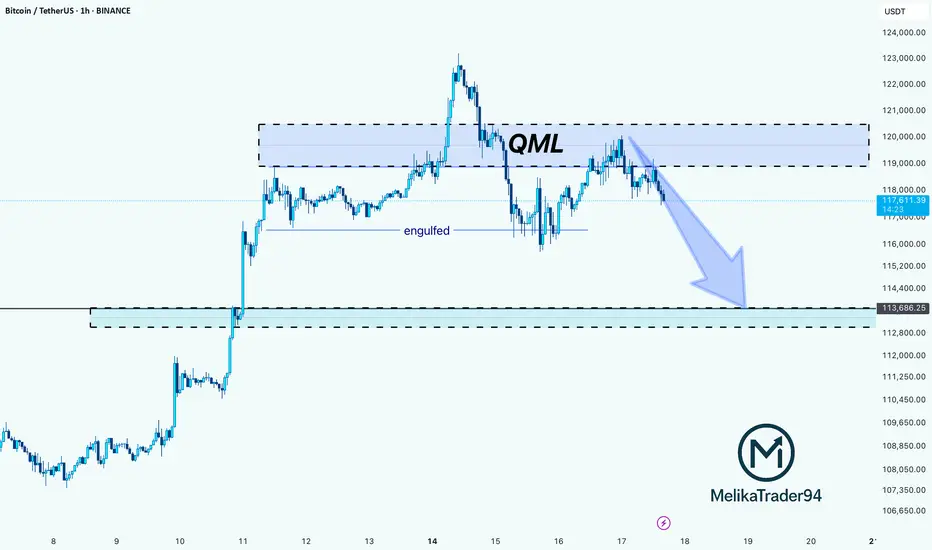
BTC Rejection from QML Zone: Towards on 113,600 SupportHello guys!
This chart shows a QML (Quasimodo Level) setup in play on Bitcoin. After price created a new high and engulfed the previous structure, it returned to the QML zone (around $119K–$121K) and reacted exactly as expected: strong rejection.
The sharp selloff from the QML area confirms a bear
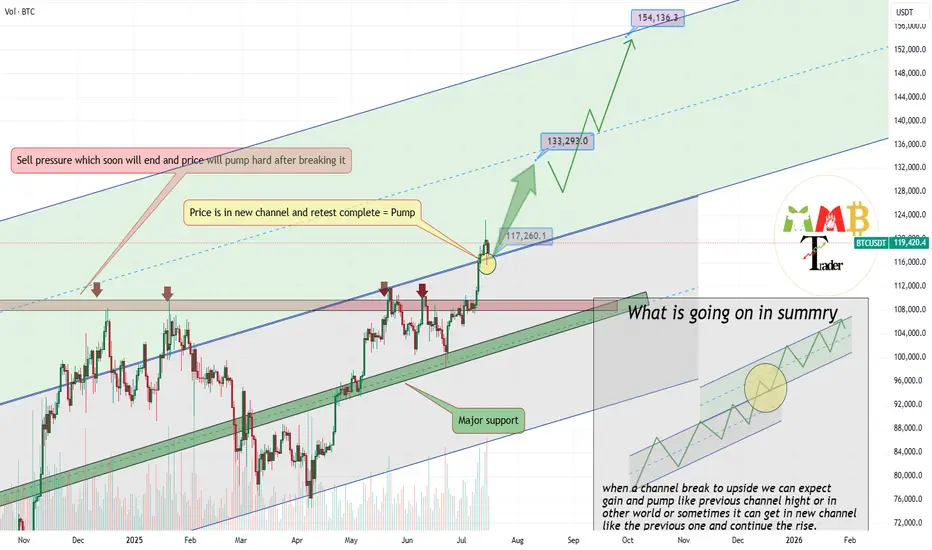
Bitcoin retest of breakout completed soon 133K$As we can see price broke previous channel and now is in new Ascending channel and pointing targets like 133K$ & 150K$.
Major support now is around 116000$ to 117000$ and price hold strong and market can easily continue more pump here like the green arrow.
BINANCE:BTCUSDT is now hitting ATH consta
Xrp - The final bullish breakout!💰Xrp ( CRYPTO:XRPUSD ) will create new all time highs:
🔎Analysis summary:
After a consolidation of an incredible seven years, Xrp is finally about to create new all time highs. With this monthly candle of +40%, bulls are totally taking over control, which means that an altcoin season is likel

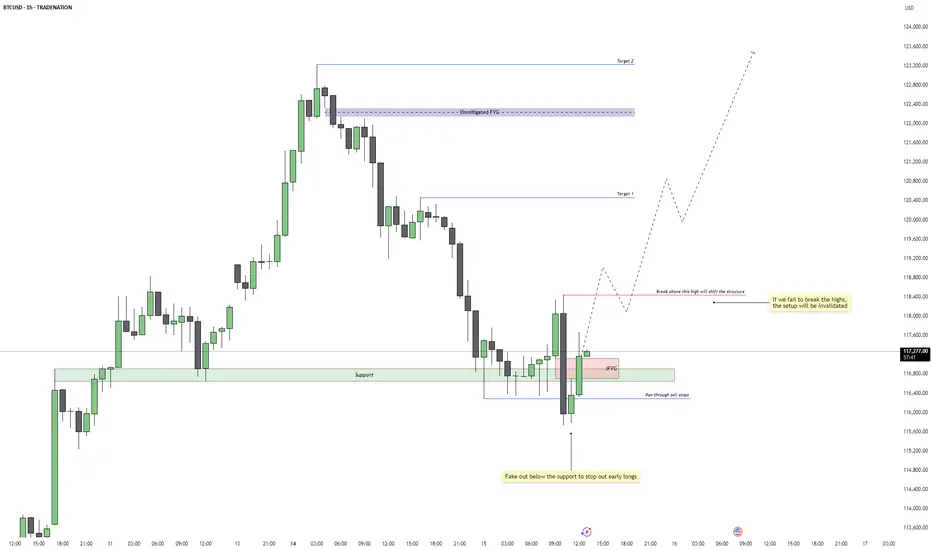
Bitcoin - Reversal Setup or Just a Trap Reset?Price faked below the 1H support zone around 115,800, triggering a clean run through resting sell stops. This classic liquidity sweep flushed out early long positions before immediately reclaiming the range. The move aggressively filled a prior imbalance and flipped sentiment just when it seemed the
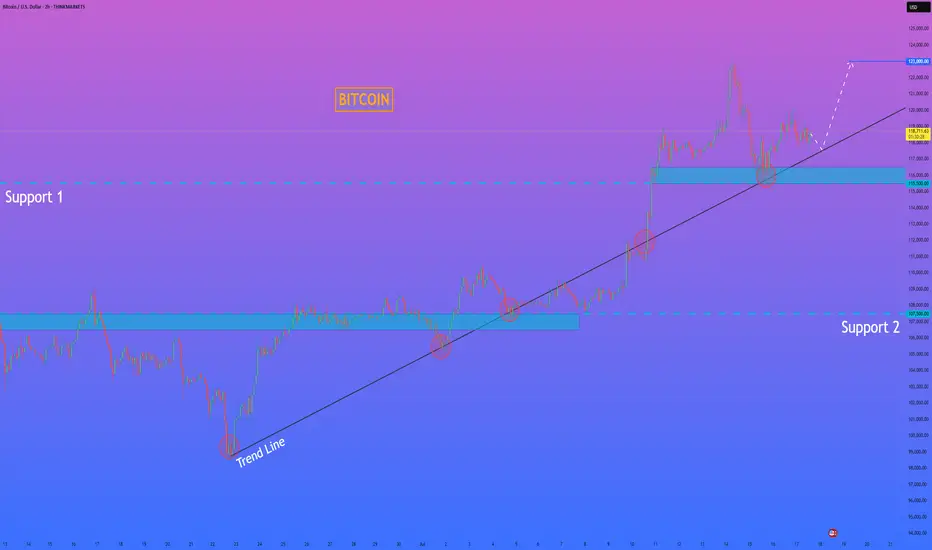
HelenP. I Bitcoin will correct to trend line and then start riseHi folks today I'm prepared for you Bitcoin analytics. The price has been trading in a strong bullish structure, clearly respecting the ascending trend line since the rebound from the 107500 level. Each time the price touched the trend line, it formed a higher low and continued the upward movement.
See all crypto ideas
News didn't load
Looks like that didn't go very well. Let's try again.
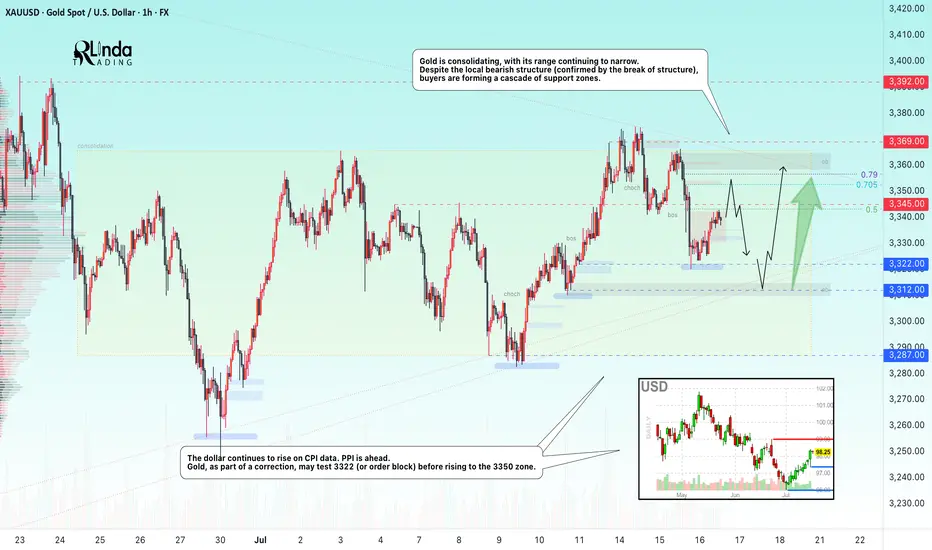
GOLD → Borders are shrinking. Consolidation continues...FX:XAUUSD is adjusting amid controversial CPI data and confirming the local bearish market structure. The PPI is ahead, and gold is consolidating, with its boundaries continuing to narrow...
Gold is recovering slightly but remains under pressure amid rising bond yields and a stronger US dollar
XAUUSDHello Traders! 👋
What are your thoughts on GOLD?
Gold has broken above its descending trendline and completed a successful pullback to the breakout level. Now, the price appears ready to resume its upward move, but it's still facing resistance near the $3375 level.
We expect another attempt to bre

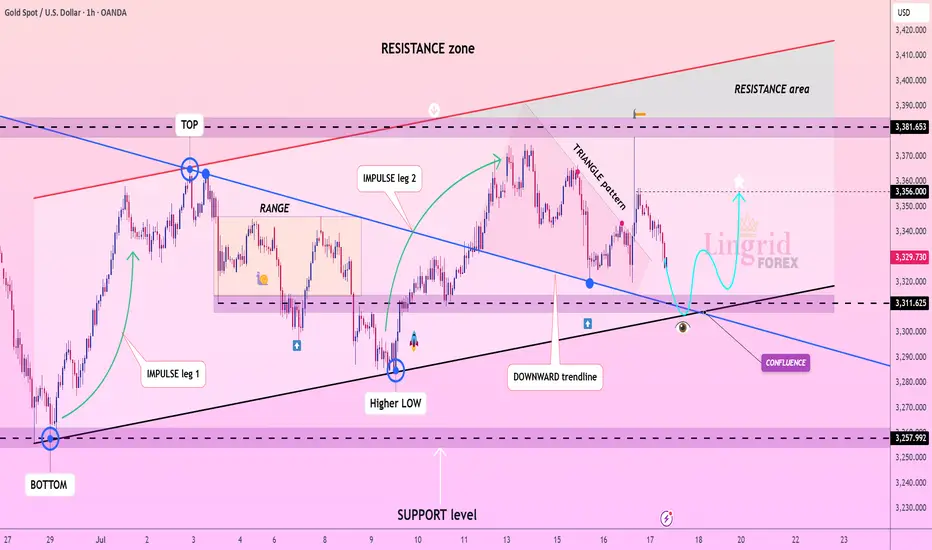
Lingrid | GOLD Continues to See Range-Bound MovementOANDA:XAUUSD is forming a bullish structure above the confluence of the downward trendline and horizontal support at 3,310. A strong impulse move followed by a triangle consolidation hints at an emerging continuation pattern, with buyers preparing for another leg higher. Price is currently approach
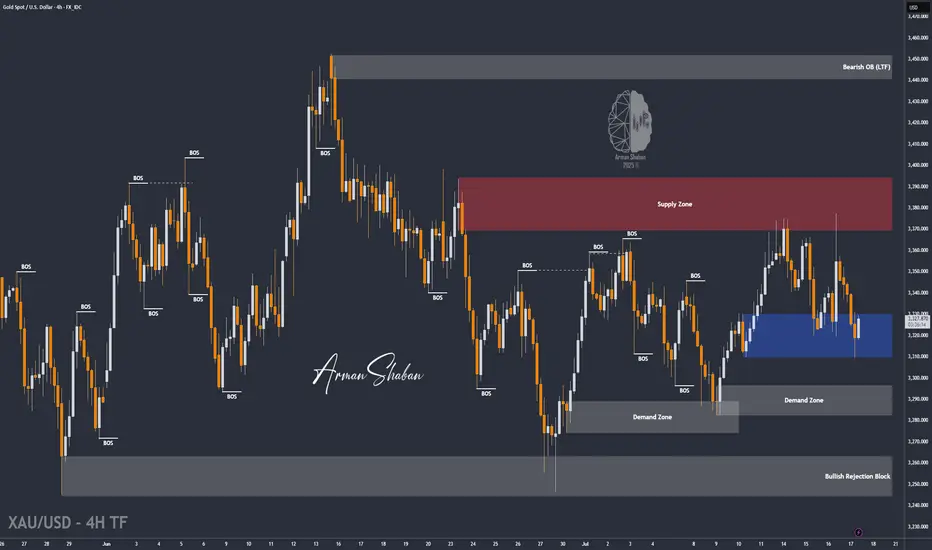
XAU/USD | First LONG to $3345, Then a Potential DROP Below $3300By analyzing the gold chart on the 4-hour timeframe, we can see that last night the price first tapped into the $3340 level, showing an initial push up to $3352. However, the drop intensified soon after, breaking the $3340 resistance and, according to the second scenario, falling to $3310. Upon reac
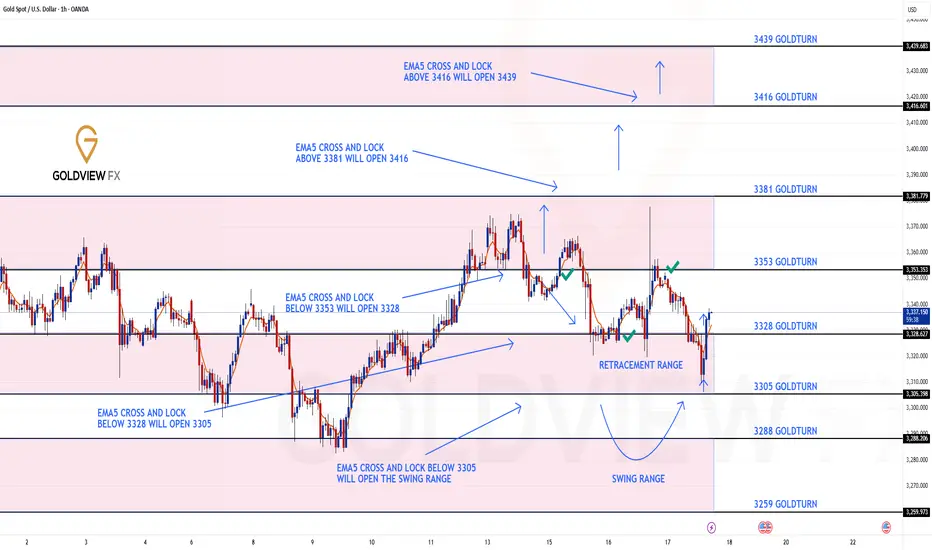
GOLD ROUTE MAP UPDATEHey Everyone,
Quick follow-up on yesterday’s 1H chart update
After hitting 3353, we did not see an EMA5 cross and lock above this level. That lack of confirmation was key and it validated a rejection right at 3353, leading to another drop into the retracement zone.
As per plan, that retracement
Gold 30Min Engaged ( Bearish Reversal Entry Detected ) what do you think before Price Move , GOLD Bullish or Bearish & why ?
lets spread the Knowledge
➕ Objective: Precision Volume Execution
Time Frame: 30-Minute Warfare
Entry Protocol: Only after volume-verified breakout
🩸 Bearish Reversal : 3339 Zone
🩸 Bullish Reversal : 3311Zone
➗ Hanzo Pr
#XAUUSD(GOLD): Strong Sellers Hold, Further Drop Incoming! God dropped from our area of entry yesterday as we initially expected. However, since the massive drop, we are now seeing some short-term correction in the prices. In the coming time, we can expect further price drops around 3280 or 3250.
If you like our idea, please like and comment.
Team Setupsf
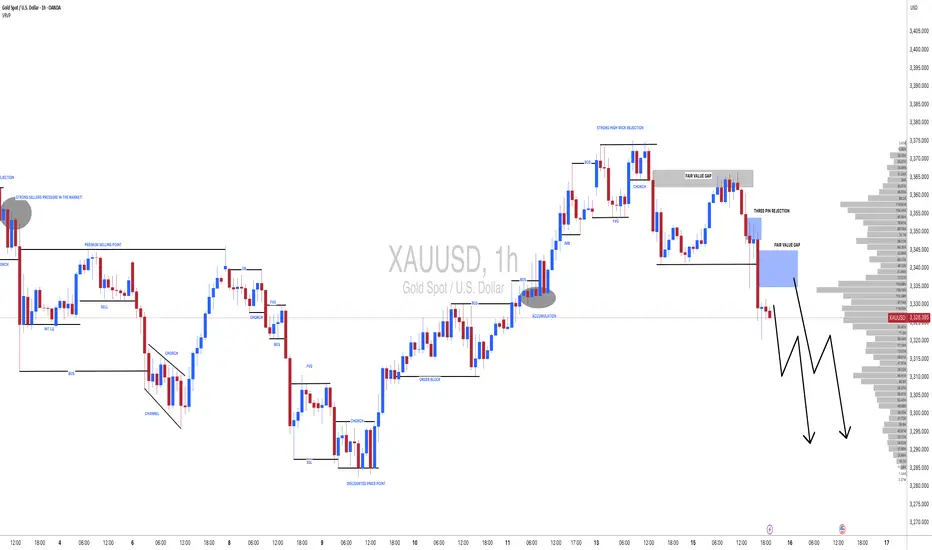
XUA/USD) Bearish Analysis Read The captionSMC trading point update
Technical analysis of XAU/USD (Gold vs USD) on the 1-hour timeframe. Here's a breakdown
Technical Analysis Summary
1. Descending Channel:
The price is moving within a clear descending channel, indicating a bearish market structure.
Recent price action rejected th

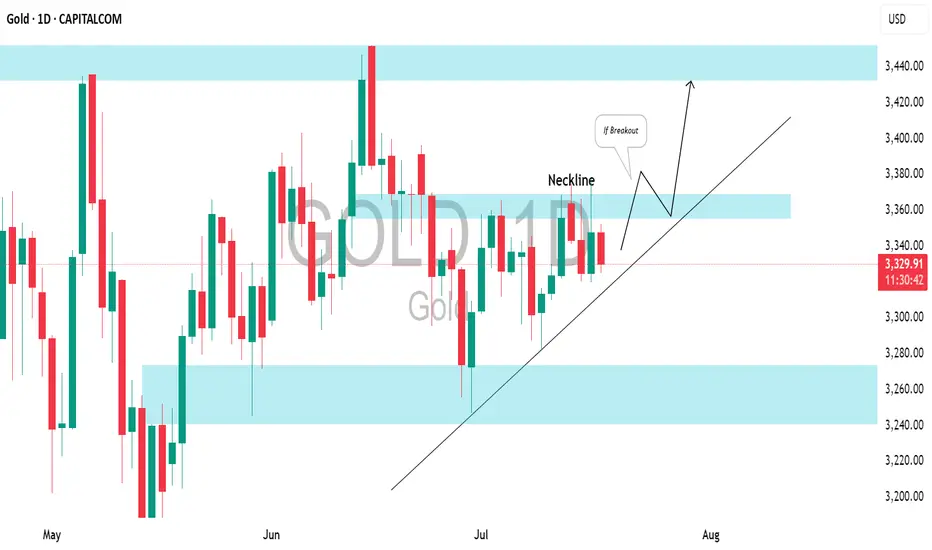
GOLD (XAUUSD): Bullish Accumulation PatternI spotted a clear ascending triangle pattern on a daily time frame.
To validate a bullish continuation, we need a breakout above the neckline.
A daily candle close above 3370 will serve as a strong confirmation, and we can expect a move up to at least the 3440 resistance level.
Waiting for the Break: 3375 or 3320 Will Decide the Next 1k Pips📉 Quick recap:
As you know, I've been bullish on Gold. However, as explained in yesterday’s analysis, I started to approach this view with more caution. Unfortunately, I closed my long position at break even… before the rally to the 3375 resistance. That’s trading.
📌 What now?
Despite missing t

See all futures ideas
News didn't load
Looks like that didn't go very well. Let's try again.
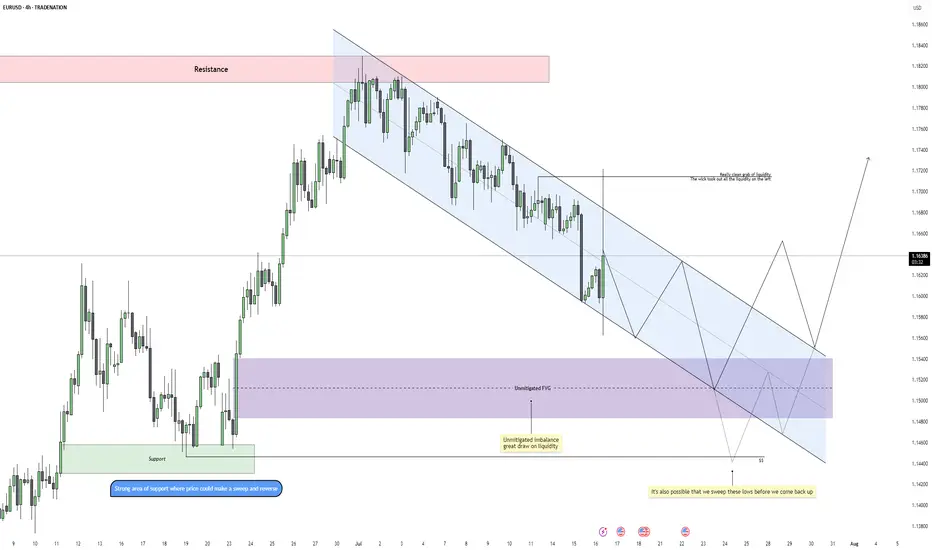
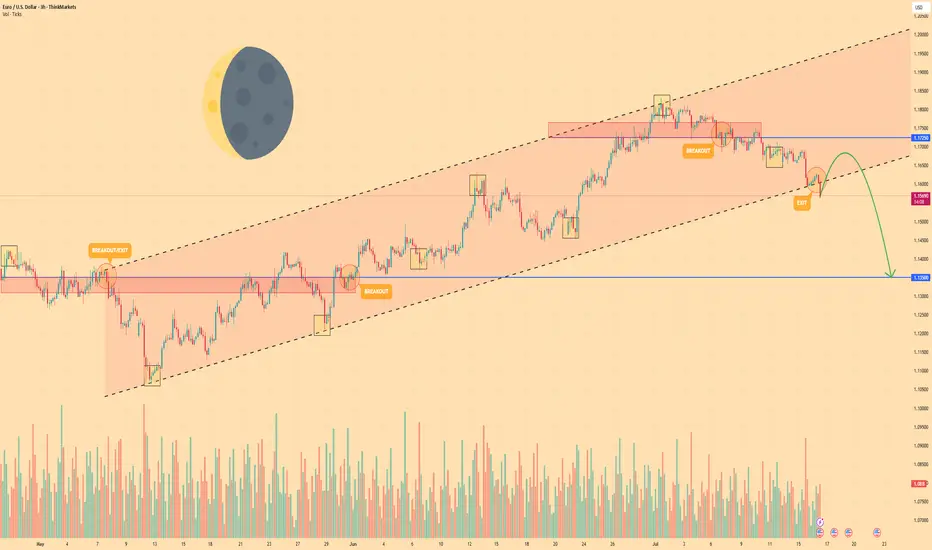
EURUSD – Bearish Rhythm ContinuesEURUSD is currently moving within a well-defined descending channel on the 4H timeframe, maintaining a consistent pattern of lower highs and lower lows. This confirms that bearish order flow remains intact, especially after the recent rejection from the upper boundary of the channel. The previous mo
EURUSDHello Traders! 👋
What are your thoughts on EURUSD?
EURUSD has broken support level and its ascending trendline, indicating a possible shift in short-term market structure and growing bearish pressure.
In the short term, we expect a pullback toward the broken support/trendline zone.
If price fails
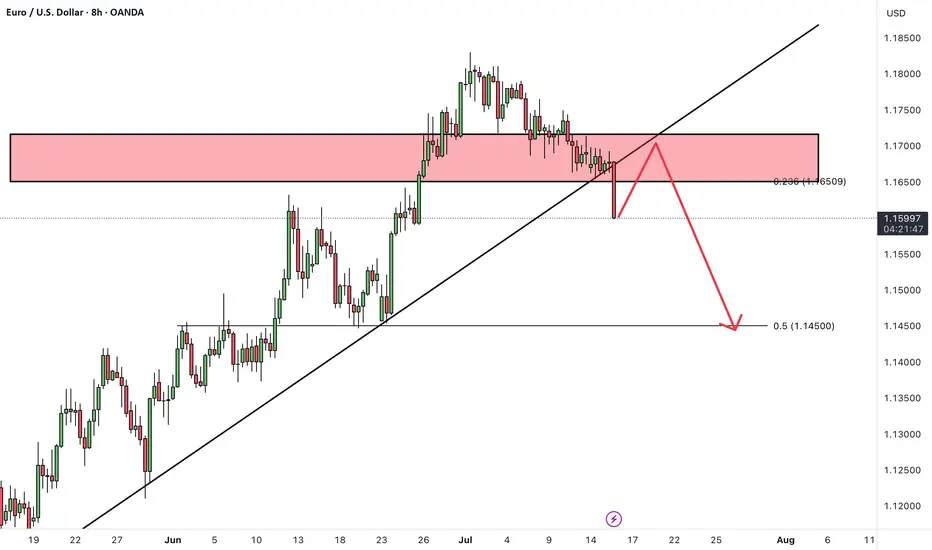
EUR/USD - Daily Chart (Wedge Breakout) (16.07.2025) The EUR/USD Pair on the D1 timeframe presents a Potential Selling Opportunity due to a recent Formation of a Wedge Pattern. This suggests a shift in momentum towards the downside in the coming Days.
Possible Short Trade:
Entry: Consider Entering A Short Position around Trendline Of The Pattern.

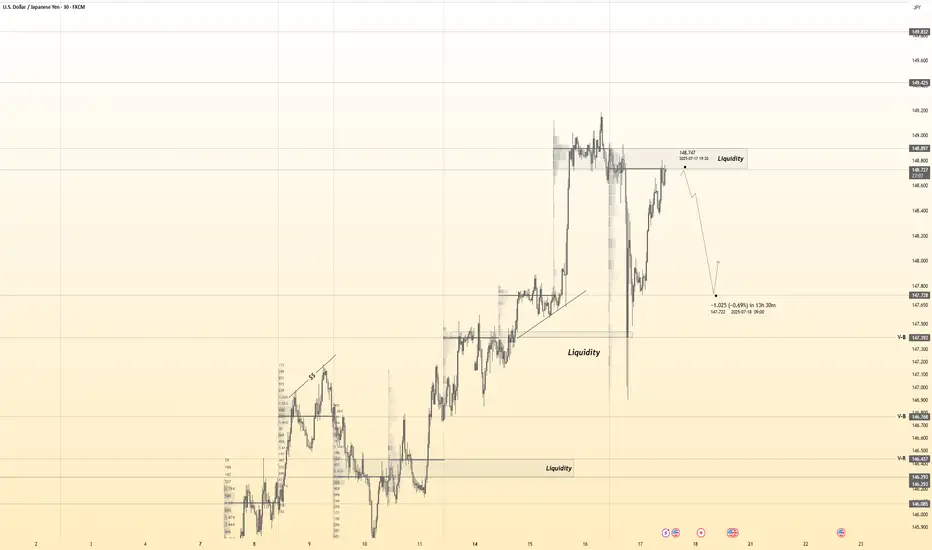
USDJPY 30Min Engaged ( Bearish Entry Detected )————-
➕ Objective: Precision Volume Execution
Time Frame: 30-Minute Warfare
Entry Protocol: Only after volume-verified breakout
🩸 Bearish From now Price :148.750
➗ Hanzo Protocol: Volume-Tiered Entry Authority
➕ Zone Activated: Dynamic market pressure detected.
The level isn’t just price — it’s
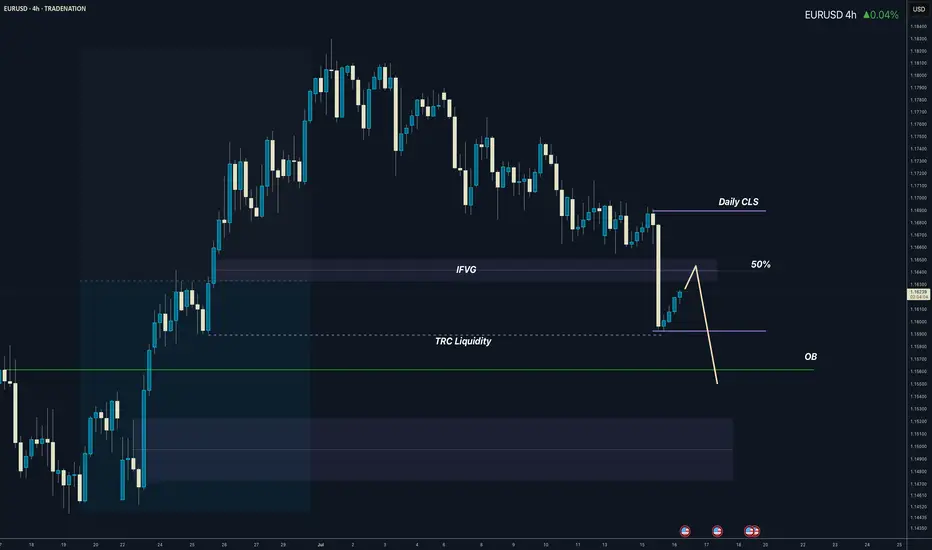
Daily CLS I Model O I CLS low will be visited...Yo Market Warriors ⚔️
Fresh outlook drop — if you’ve been riding with me, you already know:
🎯My system is 100% mechanical. No emotions. No trend lines. No subjective guessing. Just precision, structure, and sniper entries.
🧠 What’s CLS?
It’s the real smart money. The invisible hand behind $7T/day
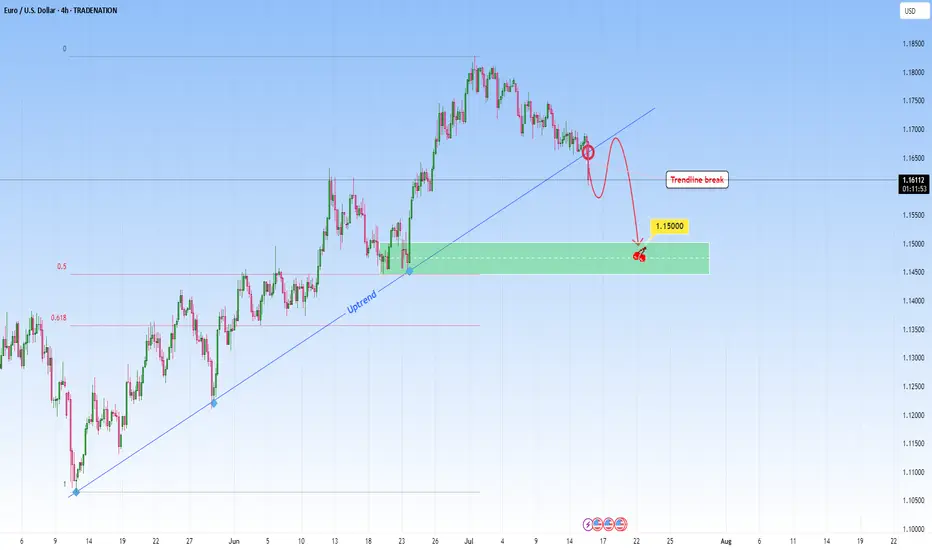
EURUSD: Sell Opportunity after Trendline breakEURUSD was in a steep uptrend but it might stop with this recent break through the uptrend. A break like this one on a strong trendline that had multiple touches, indicates either a potential reversal or major pause in the trend. This candle that broke the trendline signals the first hint of structu
GBP/USD Plunges to Make-or-Break SupportSterling is poised to mark a third consecutive weekly decline after turning from resistance at multi-year highs. The decline takes price into critical support at the yearly trendline- this is a make-or-break level for the bulls.
GBP/USD is testing confluent support today at 1.3372/90- a region defi

GBPAUD to turnaround?GBPAUD - 24h expiry
The primary trend remains bullish.
Price action looks to be forming a bottom.
We look for a temporary move lower.
Preferred trade is to buy on dips.
Bespoke support is located at 2.0495.
We look to Buy at 2.0495 (stop at 2.0425)
Our profit targets will be 2.0775 and 2.082
EURO - Price may drop to $1.1350 support level Hi guys, this is my overview for EURUSD, feel free to check it and write your feedback in comments👊
Euro began its journey by breaking into a rising channel off the swing low near $1.1080, establishing a clear uptrend.
Within this channel, price carved out steady support along the lower trendline,
See all forex ideas
| EUR | USD | GBP | JPY | AUD | ||||
|---|---|---|---|---|---|---|---|---|
| EUR | - | - | - | - | - | - | - | |
| USD | - | - | - | - | - | - | - | |
| GBP | - | - | - | - | - | - | - | |
| JPY | - | - | - | - | - | - | - | |
| CHF | - | - | - | - | - | - | - | |
| AUD | - | - | - | - | - | - | - | |
| CNY | - | - | - | - | - | - | - | |
| CAD | - | - | - | - | - | - | - |
News didn't load
Looks like that didn't go very well. Let's try again.
Trade directly on the supercharts through our supported, fully-verified and user-reviewed brokers.


