GBP/JPY Made A Reversal Pattern , Short Setup To Get 100 Pips !Here is my 1H Chart On GBP/JPY , And finally the chart made a reversal pattern The price creating a very clear reversal pattern ( double top) and the price made a very good bearish price action now from good res area But until now we have not a clear closure below our neckline to confirm the pattern

The best trades require research, then commitment.
Get started for free$0 forever, no credit card needed

Scott "Kidd" PoteetPolaris Dawn astronaut

Where the world does markets
Join 100 million traders and investors taking the future into their own hands.
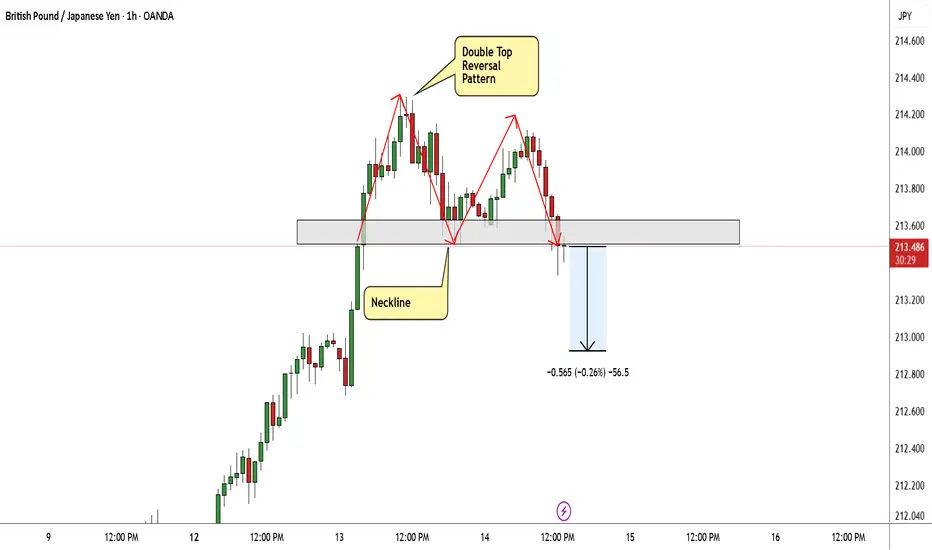
Bullish continuation?GBP/JPY could make a short-term pullback to the support level, which is a pullback support, and could bounce from this level to our take profit.
Entry: 211.43
Why we like it:
There is a pullback support level.
Stop loss: 210.35
Why we like it:
There is a pullback support level.
Take profit: 214.6

Silver Prices Stabilise Near Record HighsSilver Prices Stabilise Near Record Highs
As the XAG/USD chart shows, the price of silver per ounce is consolidating near its all-time high, which lies above $85.
Bullish sentiment dominates the market, as concerns over the independence of the US Federal Reserve, heightened geopolitical tensions,

Litecoin: The Next PumpAfter years of posting my Monero KRAKEN:XMRUSD thesis based on its privacy use case it has finally catapulted into new All Time Highs and entered "price discovery."
So I now look to what is next... focusing on
PATTERN RECOGNITION
FUNDAMENTALS: PRIVACY
THE TRADE
Pattern Recognition
A

When Will Tesla’s Pilot Take Off?Hello Traders 👋
Hope you all are doing well and trading with discipline. Let’s analyze Tesla from a pure technical perspective and see where the next major move could unfold.
Tesla is trading inside a well-defined rising channel, respecting both the rising support and the rising resistance, which c

Post-Rally Consolidation, Awaiting CatalystHello everyone,
Bitcoin is no longer in an expansion phase of the uptrend, but has shifted into a consolidation phase following the recent rally.
From a structural perspective, the medium-term uptrend remains intact. Bitcoin continues to print higher highs and higher lows, with price holding ab

Bitcoin - Holding The Middle, Eyes On The EdgeBitcoin continues to trade within a clearly defined range, with price currently positioned in the upper half of that structure. After a strong move away from the lower boundary, the market has shown acceptance above the midpoint, suggesting buyers are still active but now approaching an area where r

XAUUSD: Critical Supply Zone - Reaction May Define Next MoveHello everyone, here is my breakdown of the current XAUUSD setup.
Market Analysis
Gold is trading within a broader bullish environment, but recent price action shows signs of exhaustion near key resistance. After a period of consolidation inside a clear range, XAUUSD broke to the upside and forme
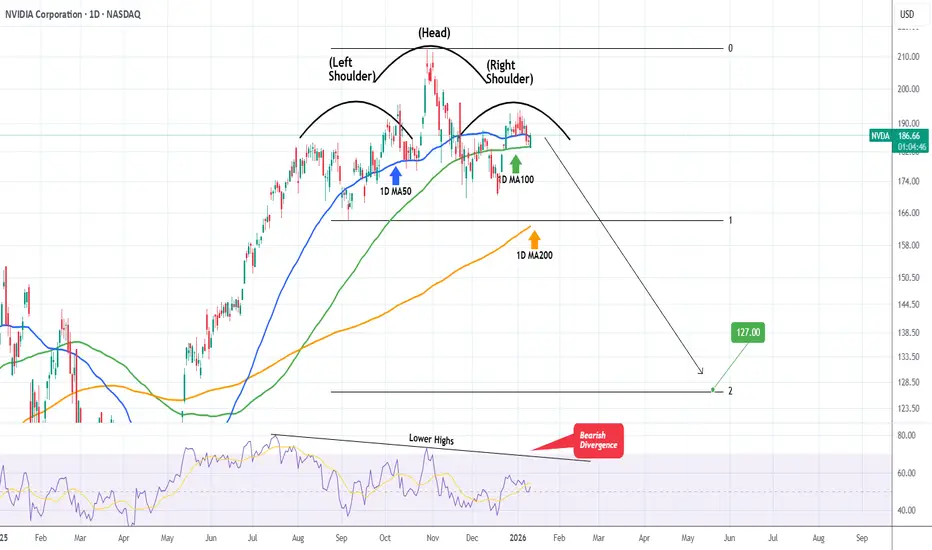
NVIDIA Huge Head & Shoulders forming. $127 technical Target.NVIDIA Corporation (NVDA) is in the process of completing the Right Shoulder of a Head and Shoulders (H&S) pattern, having turned sideways since the October 29 2025 High (ATH).
With the 1D RSI on Lower Highs, i.e. a Bearish Divergence since July 17 2025, it is possible that within a month's time ma
AUDUSD Trend continuation pattern supported at 0.6637The AUDUSD remains in a bullish trend, with recent price action showing signs of a breakout within the broader uptrend.
Support Zone: 0.6637 – a key level from previous consolidation. Price is currently testing or approaching this level.
A bullish rebound from 0.6637 would confirm ongoing upside m

See all editors' picks ideas
DeeptestDeeptest: Quantitative Backtesting Library for Pine Script
━━━━━━━━━━━━━━━━━━━━━━━━━━━━━━━━━━
█ OVERVIEW
Deeptest is a Pine Script library that provides quantitative analysis tools for strategy backtesting. It calculates over 100 statistical metrics including risk-adjusted return ratios (Sharpe

Arbitrage Detector [LuxAlgo]The Arbitrage Detector unveils hidden spreads in the crypto and forex markets. It compares the same asset on the main crypto exchanges and forex brokers and displays both prices and volumes on a dashboard, as well as the maximum spread detected on a histogram divided by four user-selected percenti

Multi-Distribution Volume Profile (Zeiierman)█ Overview
Multi-Distribution Volume Profile (Zeiierman) is a flexible, structure-first volume profile tool that lets you reshape how volume is distributed across price, from classic uniform profiles to advanced statistical curves like Gaussian, Lognormal, Student-t, and more.
Instead of forcin

Multi-Ticker Anchored CandlesMulti-Ticker Anchored Candles (MTAC) is a simple tool for overlaying up to 3 tickers onto the same chart. This is achieved by interpreting each symbol's OHLC data as percentages, then plotting their candle points relative to the main chart's open. This allows for a simple comparison of tickers to tr

Vdubus Divergence Wave Pattern Generator V1The Vdubus Divergence Wave Theory
10 years in the making & now finally thanks to AI I have attempted to put my Trading strategy & logic into a visual representation of how I analyse and project market using Core price action & MacD. Enjoy :)
A Proprietary Structural & Momentum Confluence System

Per Bak Self-Organized CriticalityTL;DR: This indicator measures market fragility. It measures the system's vulnerability to cascade failures and phase transitions. I've added four independent stress vectors: tail risk, volatility regime, credit stress, and positioning extremes. This allows us to quantify how susceptible markets are

Volatility Risk PremiumTHE INSURANCE PREMIUM OF THE STOCK MARKET
Every day, millions of investors face a fundamental question that has puzzled economists for decades: how much should protection against market crashes cost? The answer lies in a phenomenon called the Volatility Risk Premium, and understanding it may fundam

Volume Gaps & Imbalances (Zeiierman)█ Overview
Volume Gaps & Imbalances (Zeiierman) is an advanced market-structure and order-flow visualizer that maps where the market traded, where it did not, and how buyer-vs-seller pressure accumulated across the entire price range.
The core of the indicator is a price-by-price volume prof

Match Finder [theUltimator5]Match Finder is the dating app of indicators. It takes your current ticker and finds the most compatible match over a recent time period. The match may not be Mr. right, but it is Mr. right now. It doesn't forecast future connection, but it tells you current compatibility for today.
Jokes aside,

Trend Line Methods (TLM)Trend Line Methods (TLM)
Overview
Trend Line Methods (TLM) is a visual study designed to help traders explore trend structure using two complementary, auto-drawn trend channels. The script focuses on how price interacts with rising or falling boundaries over time. It does not generate trade sign

See all indicators and strategies
Community trends
$INTC — just took full profits at $49. Why? NASDAQ:INTC — just took full profits at $49. Why?
Because that was the plan. I plan my trade and trade my plan.
Can it go higher? Absolutely. It may even make new all-time highs later this year. But from here, the risk shifts toward “dead money” — extended consolidation where capital is tied up

Small long on PATHIt should go up as I see it. Just watch and see, not much more to it as i don't want to reveal my secrets;)

Intel - Here comes the bullish breakout!💾Intel ( NASDAQ:INTC ) will soon break out:
🔎Analysis summary:
During 2025, Intel has over and over again been retesting major support. That was exactly the reason why I told everyone to enter longs here on Intel. Just a couple months later we witnessed a +150% rally and Intel is about to cre

MP swing long, blue box riskMP has been in a long consolidation and retested it's previous weekly highs
it also helps that the US government has a stake in it, and rare earths are needed to push technology; but let's not distract ourselves too much with fundamentals and listen to what the chart is saying.
weekly squeeze star

Big year for BMEA Inverse head and shoulders with clean break through 100, some big catalyst coming this year.

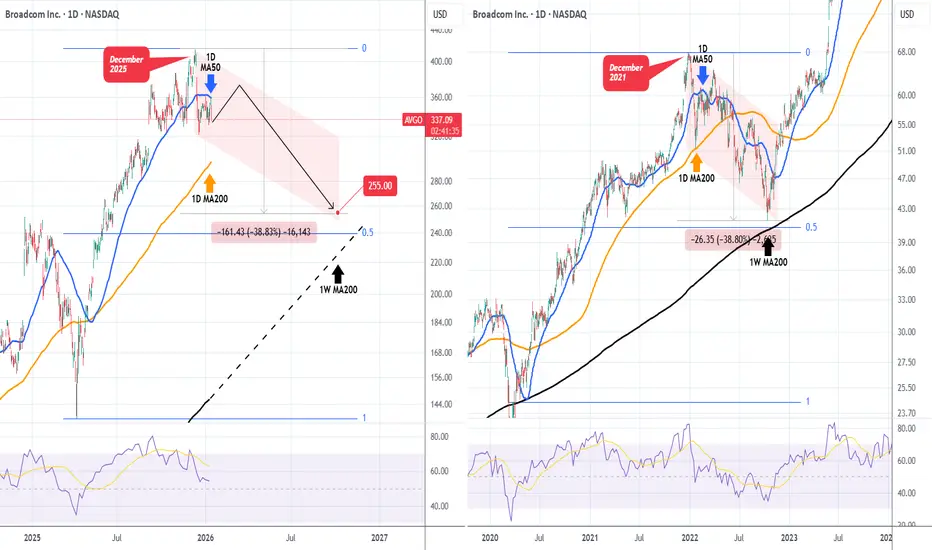
BROADCOM under its 1D MA50, targeting $255.Broadcom Inc. (AVGO) is already 1 month into its new Bear Cycle as following its December 10 2025 All Time High (ATH), it has dropped below its 1D MA50 (blue trend-line), being unable to break above it again yesterday on its 2nd test in the last 2 weeks.
This is almost identical to the 2022 Bear Cy
NVDA Is Pressing a Structural Pivot — Dec 15 Is a Reaction DayNVDA Is Pressing a Structural Pivot — Dec 15 Is a Reaction Day, Not a Guess
On the 15-minute timeframe, NVIDIA (NVDA) is stabilizing after a sharp downside impulse, but structure has not fully reset bullish yet.
The earlier selloff broke key support near 183, confirming a bearish break of structur

Kingsmen Resources Ltd. (OTCQB: KNGRF) Is Gaining MomentumKingsmen Resources Ltd. (TSX-V: KNG | OTCQB: KNGRF) is emerging as a junior exploration name drawing renewed technical and market attention as price action compresses beneath a key resistance zone. The company is a Canada-based mineral exploration firm focused on the acquisition and advancement of p

$NVO is NOT the free money you think it is, at least not yet.It's not hard to see that Novo Nordisk NYSE:NVO , Denmarks largest company by revenue, is long due for a bull run. Everything from fundamentals to technicals are saying that it's time for Novo to finally shine but is it really the rocket waiting to liftoff that most of the market thinks?
Donald

Microsoft (MSFT) shares fall below $460Microsoft (MSFT) shares fall below $460
As the Microsoft (MSFT) share chart shows:
→ yesterday’s candle closed below $460 — the lowest level since early June last year;
→ the decline from the all-time high near $550 has exceeded 16%.
Why MSFT shares are falling
The downward move may reflect

See all stocks ideas
Today
BLKBlackRock, Inc.
Actual
13.16
USD
Estimate
12.24
USD
Today
IIINInsteel Industries, Inc.
Actual
0.39
USD
Estimate
0.38
USD
Today
FHNFirst Horizon Corporation
Actual
0.52
USD
Estimate
0.46
USD
Today
WABCWestamerica Bancorporation
Actual
1.12
USD
Estimate
1.07
USD
Today
MCBMetropolitan Bank Holding Corp.
Actual
—
Estimate
2.20
USD
Today
WAFDWaFd, Inc.
Actual
—
Estimate
0.76
USD
Today
BANFBancFirst Corporation
Actual
—
Estimate
1.79
USD
Today
CZNCCitizens & Northern Corp
Actual
—
Estimate
0.59
USD
See more events
Community trends
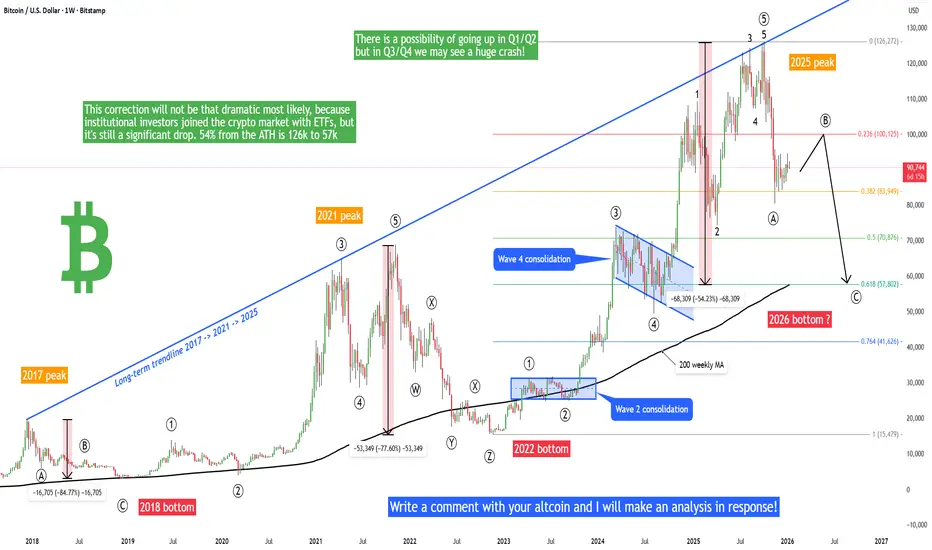
Bitcoin - 2026 roadmap, pump to 100k, then crash to 57k!Is it possible that Bitcoin will go above 100k or 103k in the next weeks/months? And is it possible that Bitcoin will later drop heavily to 57k? Altcoin season during the rise to 103k? I will answer these questions in this post. Write a comment with your altcoin, hit the like button, and I will make
BTCUSDT: Pullback To 93K Support Before Return of Bullish TrendHello everyone, here is my breakdown of the current BTCUSDT setup.
BTCUSDT previously transitioned from a strong bearish impulse into a recovery phase, where price formed a well-defined upward channel, signaling a corrective bullish structure. Within this channel, Bitcoin produced higher highs and

Bitcoin is about to hit 106k Bitcoin is about to hit 106k
After BTC managed to break through 90200, the bullish trend has been re-established.
Last night BTC hit its first target and today it is well positioned for the other targets.
Considering that the price is rising aggressively, I think it could easily hit 106k this

BITCOIN Institutional Levels: Buy 94.4k–92.6k → Target 98k–100k🔱 BITCOIN SMC OUTLOOK — EXECUTIVE SUMMARY M30 TF
✨ Bitcoin remains in bullish market structure with higher-timeframe continuation bias
🟢 Trend context: Accumulation → Expansion sequence still intact
🧱 Bullish Breaker Blocks:
• 94,400 (primary BB – first dip zone)
• 92,600 (secondary BB – deepe

From Stocks to BTC. How Rotation Is Funding the Next Leg Higher📉 Stocks Look Tired
The S&P 500 and Nasdaq are both rolling over.
Daily candles show rejection and lower momentum, while Nasdaq makes lower lows, signaling that stock indices are losing strength and upside is fading for now.
When this happens, capital often rotates out of broad equities, not j

BTC - Structure Flip, Next Leg Loading...BTC just did something important.
Price broke above a key resistance, and that level has now flipped into support. This kind of structure shift usually confirms that the previous range is done and a new leg is starting.
That said, this doesn’t mean price can’t breathe.
A pullback toward the $92,0

Bitcoin - Holding The Middle, Eyes On The EdgeBitcoin continues to trade within a clearly defined range, with price currently positioned in the upper half of that structure. After a strong move away from the lower boundary, the market has shown acceptance above the midpoint, suggesting buyers are still active but now approaching an area where r
Bitcoin may test 100K after rebounding from 94K Bitcoin broke through resistance, with the rally driven by improved fundamentals following news of the adoption of a law on digital asset market transparency. Technically, the market is breaking the structure, showing bullish sentiment.
Regulation creates the foundation for the growth of the crypto

When Capital Flows Back Into CryptoBTCUSDT is still trading within a clear bullish trend, supported by both macro news and solid technical structure.
From a macro perspective, Bitcoin’s recent rally was triggered by the latest Bureau of Labor Statistics report, showing that U.S. inflation remains relatively stable. This has strength

Aptos (APT): We Are Going To See Good Push Soon | Good R:RAPT had a decent reversal recently, which resulted in a break above the EMAs, and buyers have been showing dominance since then. What we are looking for now is a proper break of structure, which would confirm continuation of the upside move. The ultimate target for this setup is the $3.70 area.
Swa

See all crypto ideas
XAUUSD Holds Bullish Structure Above Support - Eyes on $4,680Hello traders! Here’s my technical outlook on Gold (XAUUSD, 3H) based on the current chart structure. Gold is trading within a well-defined bullish trend after reclaiming key levels and establishing a sequence of higher highs and higher lows. Earlier on the chart, price formed a consolidation range,

Gold H1: Bullish Structure, Now Comes the TestHello, I’m Camila.
From the H1 perspective, gold continues to trade within a well-defined ascending channel, confirming that the broader bullish structure remains firmly in place. The recent advance toward the upper boundary of the channel highlights strong upside momentum. However, it also indica

XAUUSD: Critical Supply Zone - Reaction May Define Next MoveHello everyone, here is my breakdown of the current XAUUSD setup.
Market Analysis
Gold is trading within a broader bullish environment, but recent price action shows signs of exhaustion near key resistance. After a period of consolidation inside a clear range, XAUUSD broke to the upside and forme
XAUUSD: The Bullish Trend Remains IntactXAUUSD continues to trade within a primary bullish trend , and the current short-term pullbacks are merely a healthy pause before price extends higher.
From a fundamental perspective, recent U.S. economic data suggest that inflationary pressures are easing and consumer demand is no longer exce

Ppi selling pressure first Gold is trading near a strong resistance zone. A rejection from this level could push price down toward the 4600 support/target. If support holds, a bullish rebound is expected, while a clean breakout above resistance may continue the upside move.

Elise | XAUUSD – 30M | Bullish Continuation From DemandOANDA:XAUUSD
After a strong expansion leg, XAUUSD is consolidating above demand, showing controlled selling and acceptance above prior support. This type of pause typically represents re-accumulation before the next leg higher, especially while price holds above the marked demand zone.
Key Scenar

XAUUSD Short: Fails at Supply Zone, Sellers Regain ControlHello traders! Here’s a clear technical breakdown of XAUUSD (1H) based on the current chart structure. XAUUSD recently completed a strong bullish leg within a well-defined ascending channel, but momentum started to fade as price reached the major Supply Zone around 4,620–4,630. This area acted as a

USOIL Cut n Reverse Level, holds or not??#USOIL.. after a strong pull back from bottom now market have upside final hope for sellers that is 62.85-90
Keep close and if market holds than we can expect a drop below that.
NOTE: we will gor for cut n reverse above 62.85-90 on confirmation .
Good luck
Trade wisley

Silver is flashing a warning it hasn’t shown in decadesToday the price crossed $90 per ounce while the monthly RSI the 92 level. Higher than 2011, when silver topped out near RSI 82 and then fell by ~80%
The only other time we’ve seen this level was 1980… followed by a ~90% crash
History doesn’t repeat perfectly, but it does rhyme
So the real questio

Gold (XAUUSD): Correction vs. ReversalHi!
Market Structure
Gold remains structurally bullish. Price continues to trade within two ascending channels, both of which are sloping upward and confirming a sustained bullish trend. The successful break and hold above the prior resistance (now acting as support) reinforces the medium-term up

See all futures ideas
Technical Pullback Within a DowntrendHello everyone,
At this point, the downtrend remains the dominant scenario for EUR/USD. The recent rebounds do not signal a trend change, but rather look like technical pullbacks — pauses that allow price to rebalance before the market decides on its next move.
After topping out around the 1.1800

USDACD Price Update – Clean & Clear ExplanationPrice is moving within an ascending channel, respecting trendline support and resistance. After a pullback from the upper channel, the pair is currently reacting from a key demand zone, showing signs of potential bullish continuation.
🔹 Bias: Bullish
🔹 Entry Area: Near channel support / demand zone

EURUSD Short: Sellers Take Control Below 1.1680Hello traders! Here’s a clear technical breakdown of EURUSD (2H) based on the current chart structure. EURUSD previously traded within a well-defined ascending channel, confirming a strong bullish phase with consistent higher highs and higher lows. During this advance, price formed a consolidation r

EURUSD: Sellers Take Control Below Key Resistance, Eyes 1.1600Hello everyone, here is my breakdown of the current EURUSD setup.
Market Analysis
EURUSD previously traded within a well-defined upward channel, confirming a bullish recovery phase after forming a strong base from the prior decline. Buyers maintained control by producing higher highs and higher l

USDCAD: Bullish Structure Holds Above Rising TrendlineUSDCAD: Bullish Structure Holds Above Rising Trendline
USDCAD continues to respect a clear bullish structure, with price holding above the ascending trendline that has been guiding the market higher.
After the recent pullback, the pair is showing signs of stabilization, suggesting that the corre

USDCHF - Let the Market Come to YouUSDCHF remains overall bullish, and price is now doing exactly what we want to see in a healthy trend.
We’re currently retesting a key intersection:
– the lower blue trendline
– and the green structure support
As long as this intersection holds, my focus stays on trend-following long setups. I

Chasing Buys at the Top? USDJPY Is Sending a Risk WarningUSDJPY is entering a technical corrective pullback after an extended and aggressive rally. While the broader macro backdrop previously remained unfavorable for the Japanese yen, the market is no longer reacting strongly to USD-bullish headlines as it did before.
From a news perspective, the J

GBPUSD Monthly CLS - Model 1Hi friends, new range created. As always we are looking for the manipulation in to the key level around the range. Don't forget confirmation switch from manipulation phase to the distribution phase to make the setup valid. Stay patient and enter only after change in order flow. If price reaches 50%

15.01.26 Daily ForecastPairs on Watch -
FX:NZDJPY
FX:EURJPY
A short overview of the instruments I am looking at for today, multi-timeframe analysis down to what I will be looking at for an entry. Enjoy!

AUD/USD: Bull Trap Incoming?AUD/USD is showing clear signs of a slowdown in the bullish trend after December’s impulse, with price now consolidating below a key supply area and within a structure that is starting to lose momentum. On the daily chart, the market delivered a clean directional move, but the current phase is typic

See all forex ideas
| - | - | - | - | - | - | - | ||
| - | - | - | - | - | - | - | ||
| - | - | - | - | - | - | - | ||
| - | - | - | - | - | - | - | ||
| - | - | - | - | - | - | - | ||
| - | - | - | - | - | - | - | ||
| - | - | - | - | - | - | - | ||
| - | - | - | - | - | - | - |
Trade directly on Supercharts through our supported, fully-verified, and user-reviewed brokers.


