20.02.26 Daily ForecastFX:AUDUSD - We have the potential to look for longs on this pair with the DXY failing to break the high it is currently sat at. A simple 15M continuation will confirm the move to the upside with the possibility of the DXY selling off to the downside.
FX:USDJPY - Price has formed a first touch

The best trades require research, then commitment.
Get started for free$0 forever, no credit card needed

Scott "Kidd" PoteetPolaris Dawn astronaut

Where the world does markets
Join 100 million traders and investors taking the future into their own hands.

OIL Breakout Done , Long Setup Valid To Get 500 Pips !Here is my 4H Chart on OIL , We Have A Clear Breakout and the price closed above my old res And above my C.T.L after more than 4 weeks the price respect the res and touch it and move to downside but for the first time the price closed above it with Daily Candle and that prove it`s a real breakout a

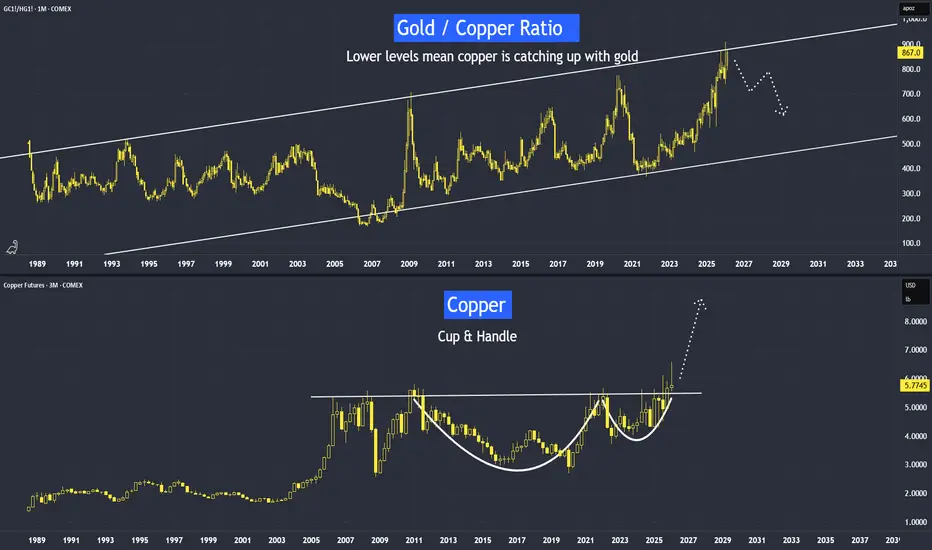
Copper is Next - After Gold & SilverLast week, we came across news: China calls for more copper stockpiling.
Therefore, is Copper Next to Rally After Silver and Gold?
Why Is China Stockpiling Copper?
In the video I posted last week, I explained that the Gold/Copper ratio may face resistance at the upper band of its long-term parallel
GBP/USD is currently under severe pressureGBP/USD is currently under severe pressure, trading around the psychological level of 1.3500.
✅ Pound Sterling: March Rate Cut Expectations
The GBP continues to exhibit structural weakness due to two key fundamental factors:
- Subdued Inflation: Recent data showed UK consumer inflation fell to i

Figma Stock Powers Up 16% on Solid Results. Turnaround Possible?(From IPO darling to design underdog and maybe back again.)
🎨 From Hero to Hangover
It has been a dramatic few months for Figma NYSE:FIG .
The design software firm burst onto the public markets in late July with the kind of debut that makes investment bankers frame the tombstone. Shares surg

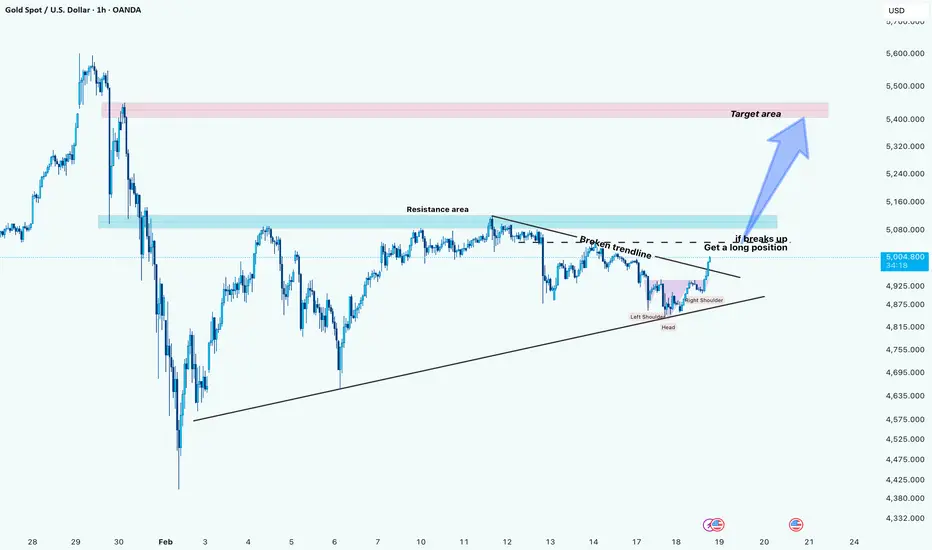
Gold (xauusd): Resistance Flip Could Open Path to 5,400+Hi!
Gold is currently compressing below a key resistance zone while forming a short-term recovery structure after breaking the local descending trendline. Price is now approaching a decisive area where momentum could shift bullish if buyers step in with volume.
The main level to watch is the blue
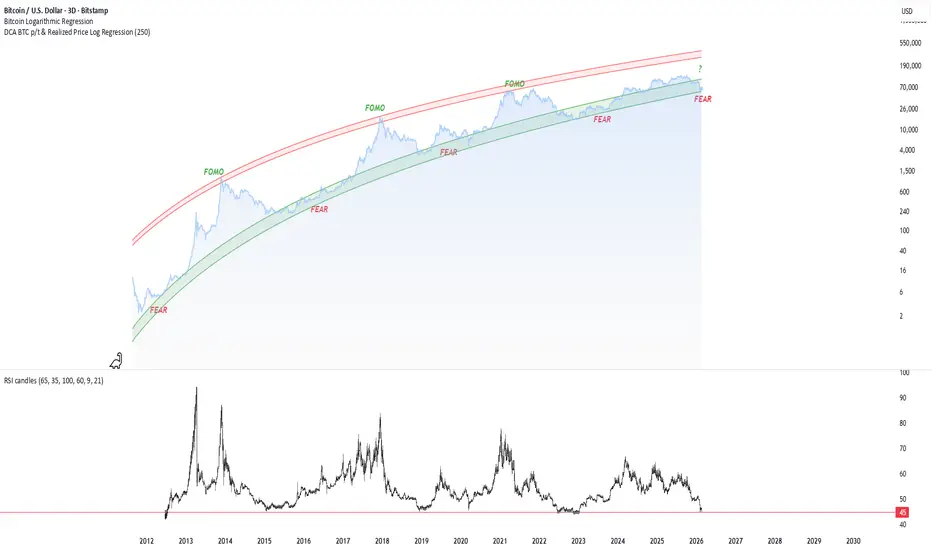
FEAR ? The Logic of the "Fear Zone" & Macro Reset
Logarithmic Regression Channel (15-Year Trend)
As seen in the chart above, Bitcoin is currently trading within the Green "FEAR" Zone of its 15-year logarithmic regression channel.
Historical Significance: Every major cycle bottom (2015, 2019, 2022) has o
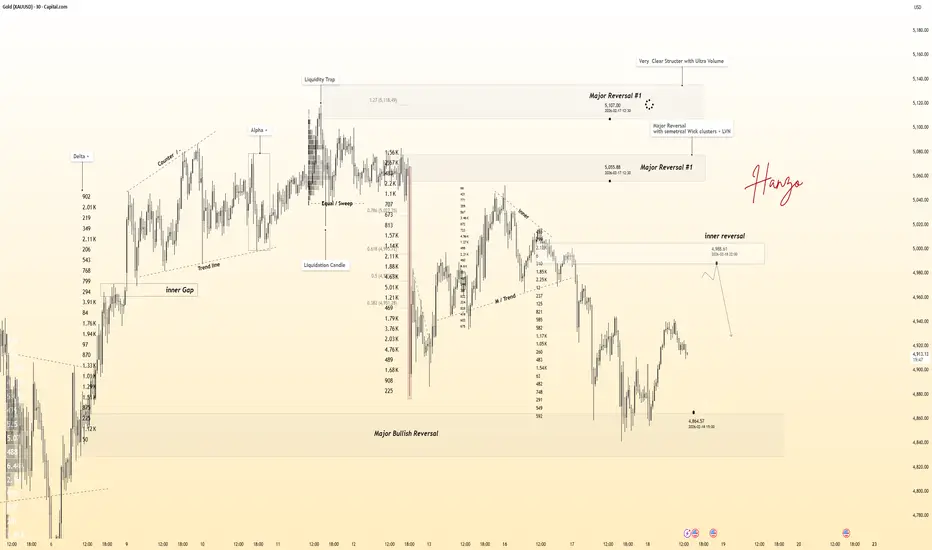
Gold 30Min Engaged ( Bearish Entry Detected )⚡Base : Hanzo Trading Alpha Algorithm
The algorithm calculates volatility displacement vs liquidity recovery, identifying where probability meets imbalance.
It trades only where precision, volume, and manipulation intersect —only logic.
✈️ Technical Reasons
/ Direction — SHORT / Reversal 4987 Area
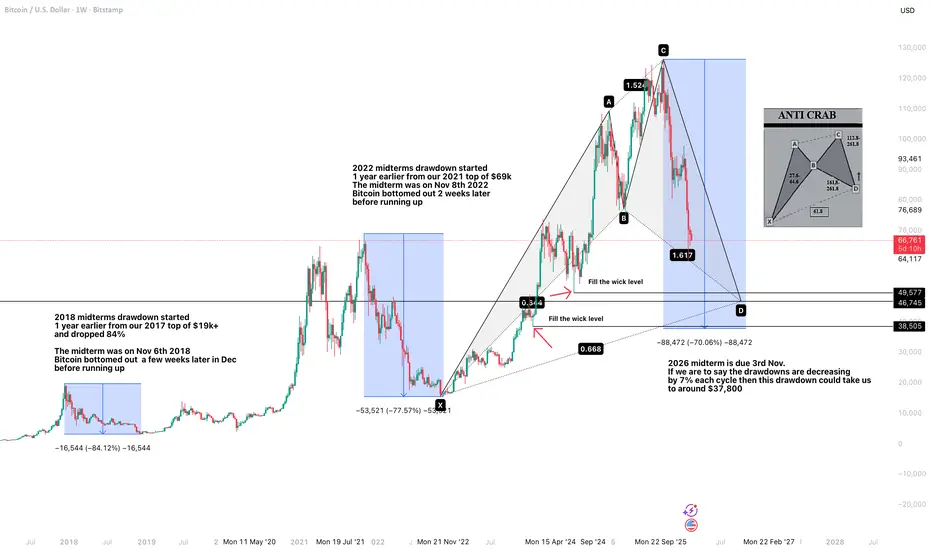
Btc and the midterm election cycles2026 sees the midterm election over in the USA, these midterms seem to have an adverse effect on the bitcoin price as you can see from what I've drawn.
I've looked back to the last 2 midterms, 2018 and 2022 and both have the same conclusion, large drawdowns. 2018 saw an 84% price decrease on bitcoi
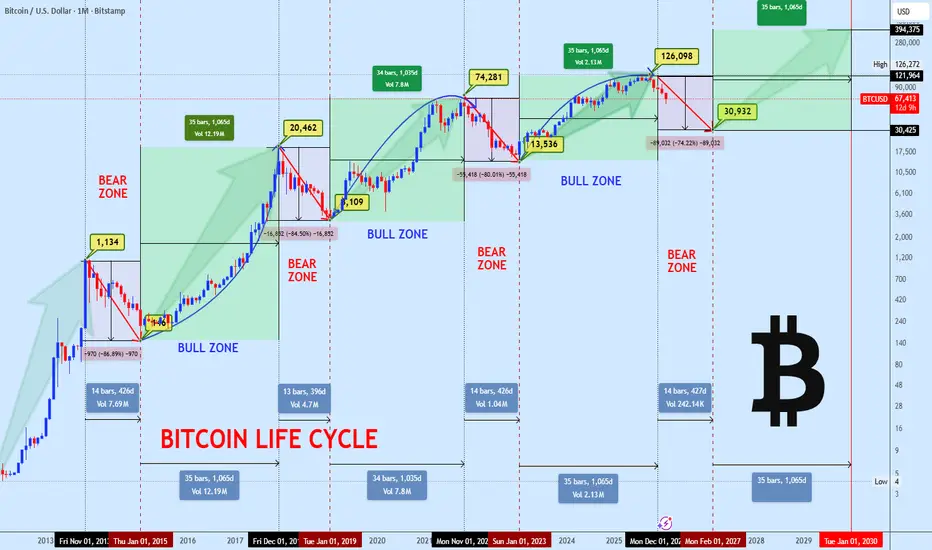
BITCOIN MACRO UPDATE LIFE CYCLE, STRUCTURE & PRICE LEVELSIt is timely to revisit the typical crypto market cycle, as Bitcoin continues to respect it with remarkable precision.
The macro top was confirmed in October, when BTC tested the $126,000 zone, marking the current cycle ATH. Since that rejection, price has transitioned into a prolonged consolidat
See all editors' picks ideas
MovingAveragesLibrary "MovingAverages"
A collection of O(1) numerically stable moving averages that support anchors and fractional lengths up to 100k bars.
Pine Script has a robust set of moving averages suitable for a majority of cases, making these alternatives useful only if you need anchoring, fractional
Pine Script® library

Clusters Volume Profile [LuxAlgo]The Clusters Volume Profile indicator utilizes K-Means clustering to categorize historical price action into distinct groups and generates individual volume profiles for each detected cluster. This tool provides a unique perspective on volume distribution by isolating price behaviors based on prox
Pine Script® indicator

Central Bank Liquidity Gap IndicatorThis indicator measures the gap between global liquidity growth and stock market growth to identify potential buying opportunities.
Liquidity drives markets. When central banks print money, that liquidity eventually flows into stocks and other assets. If we spot when liquidity growth is outpacing
Pine Script® indicator

Peak Trading Activity Graphs [LuxAlgo]The Peak Trading Activity Graphs displays four graphs that allow traders to see at a glance the times of the highest and lowest volume and volatility for any month, day of the month, day of the week, or hour of the day. By default, it plots the median values of the selected data for each period. T
Pine Script® indicator

Smart Trader, Episode 03, by Ata Sabanci, Candles and TradelinesA volume-based multi-block analysis system designed for educational purposes. This indicator helps traders understand their current market situation through aggregated block analysis, volumetric calculations, trend detection, and an AI-style narrative engine.
━━━━━━━━━━━━━━━━━━━━━━━━━━━━━━━━━━━━━━━
Pine Script® indicator

Asset Drift ModelThis Asset Drift Model is a statistical tool designed to detect whether an asset exhibits a systematic directional tendency in its historical returns. Unlike traditional momentum indicators that react to price movements, this indicator performs a formal hypothesis test to determine if the observed d
Pine Script® indicator

Hyperfork Matrix🔱 Hyperfork Matrix 🔱 A manual Andrews Pitchfork tool with action/reaction propagation lines and lattice matrix functionality. This indicator extends Dr. Alan Andrews' and Patrick Mikula's median line methodology by automating the projection of reaction and action lines at equidistant intervals, cr
Pine Script® indicator

Arbitrage Matrix [LuxAlgo]The Arbitrage Matrix is a follow-up to our Arbitrage Detector that compares the spreads in price and volume between all the major crypto exchanges and forex brokers for any given asset.
It provides traders with a comprehensive view of the entire marketplace, revealing hidden relationships among d
Pine Script® indicator

Wyckoff Schematic by Kingshuk GhoshThe "Wyckoff Schematic" is a Pine Script indicator that automatically detects and visualizes Wyckoff Method accumulation and distribution patterns in real-time. This professional tool helps traders identify smart money movements, phase transitions, and critical market structure points.
Key Features
Pine Script® indicator

Volume Cluster Profile [VCP] (Zeiierman)█ Overview
Volume Cluster Profile (Zeiierman) is a volume profile tool that builds cluster-enhanced volume-by-price maps for both the current market window and prior swing segments.
Instead of treating the profile as a raw histogram only, VCP detects the dominant volume peaks (clusters) insid
Pine Script® indicator

See all indicators and strategies
Community trends
Figma Stock Powers Up 16% on Solid Results. Turnaround Possible?(From IPO darling to design underdog and maybe back again.)
🎨 From Hero to Hangover
It has been a dramatic few months for Figma NYSE:FIG .
The design software firm burst onto the public markets in late July with the kind of debut that makes investment bankers frame the tombstone. Shares surg
NVIDIA Has it already started its correction to $100 ??NVIDIA Corporation (NVDA) has been trading within a 12-year Channel Up and this is not the first time we bring forward this pattern. Both on the 1M and 1W time-frames, as a long-term perspective is required now, the signals of a Cycle Top are there.
The massive RSI Bearish Divergence but more impor

Micron Technology - Retesting the massive resistance!📉Micron Technology ( NASDAQ:MU ) will reverse quite soon:
🔎Analysis summary:
Over the course of the past couple of months, Micron Technology has been rallying about +500%. And while this entire rally was quite expected, Micron Technology is now retesting a significant resistance trendline. A


Still Riding the ChannelOpendoor is still inside the channel from months past. Riding the descending channel until something material happens.
Today is earnings day and the consensus is Opendoor will have far lower revenue than the previous quarter, Q3. This is expected anyway as people typically dont move during winter

AMD: A-Wave Truncated at ~195, B-Wave Rally UnderwayCurrent Situation:
AMD at ~201 (Feb 19, 2026), rebounding from 195 low post-earnings pullback. Truncated A-wave complete (subwave 5 failed to extend), with volume support and RSI recovering from oversold.
Primary Count:
Wave A truncated at 194.83. Wave B started, targeting 220-235 (mid-March,

ONDS Bull Flag Tightens as Defense Wins Fuel the Next BreakoutOndas Holdings (ONDS) has shifted from “story stock” to a name traders are actively repricing, with a string of defense-related catalysts (German State Police, NATO, and an Asia-Pacific contract) keeping sentiment constructive. That fundamental tailwind matters here because price is no longer chasin

Nebius is looking badNebius has formed a head and should pattern and also complete 6 waves of its correction with 7th (C) wave pending.
There is also a glaring gap on weekly at 28.5 USD. Its going to be a fast move to the downside, I thinking starting from next week.

The $200 Magnet: Why Apple (AAPL) is Structurally VulnerableTechnical lines only break when there is a narrative to push them. Despite posting strong Q1 revenue recently, the institutional sentiment around Apple is shifting:
The AI Lag: Recent reports regarding delays in Apple's AI-powered Siri upgrades are creating real anxiety. While competitors are aggre

SMR printed a Bullish Tri-Star Pattern the past 3 daysThe past 3 days, SMR has printed 3 dogi candles with the middle candle gapping below the first and 3rd candle right off of a big red candle down. That's a very bullish setup working.

See all stocks ideas
Today
MNOVMediciNova, Inc.
Actual
−0.10
USD
Estimate
−0.10
USD
Today
ASIXAdvanSix Inc.
Actual
0.03
USD
Estimate
−0.06
USD
Today
DNOWDNOW Inc.
Actual
0.15
USD
Estimate
0.15
USD
Today
WUWestern Union Company (The)
Actual
0.45
USD
Estimate
0.43
USD
Today
OISOil States International, Inc.
Actual
0.13
USD
Estimate
0.10
USD
Today
USBCUSBC, Inc.
Actual
—
Estimate
−2.80
USD
Today
TXNMTXNM Energy, Inc.
Actual
—
Estimate
0.69
USD
Today
WWRWestwater Resources, Inc.
Actual
—
Estimate
—
See more events
Community trends
BTCUSDT Short: Bearish Structure Continues Below SupplyHello traders! Here’s my technical outlook on BTCUSDT (1H) based on the current chart structure. BTCUSDT remains within a broader bearish context after breaking down from a previous consolidation range near the highs. Earlier price action showed a temporary balance between buyers and sellers, but on

Bitcoin Near a “Do-or-Die” Zone — Here’s What I’m WatchingThis analysis is on the 4-hour timeframe, in line with the idea I shared with you a few days ago . Since Bitcoin ( BINANCE:BTCUSDT )'s moves in the past few days have been rather range-bound and without significant momentum, I’m sharing another update with you based on Bitcoin’s current conditions

An additional 50% BTC plummet to $30-40k about to print? - Feb26
** Blackrock transfer millions of dollars worth (for now) of Bitcoin to Coinbase. **
** Fear and greed at historic lows. **
Why pay $66k today when you can pay $33k tomorrow?!
This idea is not spontaneous, an influencer video is shared with me, “Steve says a 3 day death cross forecasts a mega

BTCUSDT: Coiling for Move - Bearish Bias While Below 70KHello everyone, here is my breakdown of the current BTCUSDT setup.
Market Analysis
BTCUSDT has been trading within a well-defined bearish environment, moving inside a descending channel where price consistently formed lower highs and lower lows. This structure reflected controlled selling pressur

BTC (bitcoin): Breakout Could Open Path to 70,100Hi!
On the 1H chart, Bitcoin is trading inside a short-term descending channel after rejecting the 70K region.
Price recently swept liquidity near the QML area around 66,000 – 66,200 and reacted from demand. Now the focus shifts to the upper boundary of the channel.
Key Levels
Channel Suppo

Bitcoin Descending channel is dumping it until valid breakout The price is yet dumping in this channel and next possible support zone would be around 50K$ zone but that support may noy touch easily we may have breakout to the upside of channel and heavy pump after that without touching this support but also we should consider this support as well to because we

Bitcoin - All ETF investors will get liquidated! (here is why)Bitcoin can drop below 40k later this year! But before that, in the short term, we may see a final drop to 58k, followed by a huge bear market rally to 85k. If you are confused, let's take a look at my prediction:
Short-term: 58k (wave A on the chart)
Mid-term: 85k (wave B on the chart)
Long-te

Bitcoin: Breakdown or Reversal?BCT on the 4H timeframe is currently trading around $66.8k, sitting inside a larger descending structure. This is not random movement. Price is respecting structure.
📉 What the Technicals Say
1️⃣ Short-Term Structure: Bearish Channel
The blue channel shows a clear downward channel:
- Lower hi

SOLUSDT - The trend pressure continues. Interest in 77.5BINANCE:SOLUSDT breaks another support level and is preparing to continue its decline within the current cycle. Before continuing its decline, the altcoin may form a retest of the zone of interest
Market manipulation (short squeeze) provokes a reversal and resumes the downward movement within

XRP: A Short Term Bearish ScenarioXRP: A Short Term Bearish Scenario
XRP broke down from a bearish pattern and the bearish movement was just confirmed.
The market overall looks a bit crazy this week and a possible war between the U.S and Iran will not make things better.
For as long as XRP holds below this pattern it can go down

See all crypto ideas
Gold next move (expecting sell)(19-02-2026)Plz Go through the analysis carefully and do trade accordingly.
Anup 'BIAS for the day (19-02-2026)
Current price- 5010
"if Price stays below 5045-50 then next target is 4970, 4900, 4850 and 4760 and above that 5020 and 5100".
-POSSIBILITY-1
Wait (as geopolitical situation are worsening )
-POSS

XAUUSDHello Traders! 👋
What are your thoughts on GOLD?
Gold, after a strong bullish rally and printing a new high, entered a corrective phase and declined toward the 4400 area, where buyers stepped in and provided support.
Currently, price is fluctuating within a key decision zone.
The recent price act

GOLD - Correction within the local uptrend FX:XAUUSD is testing 5000, the first attempt was unsuccessful, but there is still a chance for further growth. Geopolitical support is the main driver.
Renewed demand for safe-haven assets due to the lack of breakthrough in Russia-Ukraine negotiations and the rapid escalation of the US confli

XAU/USD (Gold) - Surges as US–Iran Tensions Rise (19.02.2026)📌 Description 🟡 Setup OANDA:XAUUSD
Gold (XAUUSD – H1) is reacting strongly to rising geopolitical tensions between the US and Iran, increasing safe-haven demand.
Technically:
• Descending trendline has been tested multiple times
• Price bounced strongly from the marked Support Zone (Demand Ar

Gold Price Key Levels AnalysisThis chart highlights key resistance and support levels for gold. The Key Resistance Level at 5,506.344 is a potential price rejection zone, where a breakout or rejection could occur. Minor Resistance at 5,313.157 is a possible pullback zone. The Support Zone at 5,142.301 is expected to hold or boun

XAUUSD: Support Holding, Resistance Pressured - Move To 5,100Hello everyone, here is my breakdown of the current XAUUSD setup.
Market Analysis
Gold previously traded inside a sideways range after forming a strong bullish impulse that pushed price into the major resistance zone near the 5,100 level. This consolidation reflected temporary balance between buy

THE KOG REPORT - UpdateEnd of day update from us here at KOG:
A choppy day but we managed to get some nice early trades with price bouncing from the lower hot spot then giving us consecutive longs on the indi's. Apart from that, nothing really exciting as price still plays the range and chops up and down.
For now, we'v

Gold 30Min Engaged ( Four Entry's Detected )⚡Base : Hanzo Trading Alpha Algorithm
The algorithm calculates volatility displacement vs liquidity recovery, identifying where probability meets imbalance.
It trades only where precision, volume, and manipulation intersect —only logic.
✈️ Technical Reasons
/ Direction — LONG / Reversal 4948 Area

GOLD DAILY CHART ROUTE MAPHi everyone,
Please see our daily chart idea.
As outlined previously, we were watching for a pullback into oir Goldturn channel half-line. This level has consistently acted as a strong area of dynamic support, often providing solid reaction points within the broader trend. Once again, price delive

XAG/USD Triangle Squeeze – Smart Money Preparing the Next Run!📊 XAG/USD (Silver) – 2H Technical Outlook
✅ Silver is currently trapped inside a well-defined symmetrical triangle on the 2H timeframe, showing clear compression between descending resistance and rising support. Price has respected both trendlines multiple times, forming lower highs while demand c

See all futures ideas
EURUSDHello Traders! 👋
What are your thoughts on EURUSD?
The price has successfully broken above a long-term descending trendline and a major resistance zone, confirming a structural bullish shift in the higher timeframe.
After reaching the recent swing high, the pair entered a healthy corrective phase

Triangle Pressure Builds - EURUSD Downside To 1.1740 in FocusHello traders! Here’s my technical outlook on EURUSD (4H) based on the current chart structure. EURUSD previously traded inside a controlled bearish channel, where price respected both the descending resistance and support boundaries, forming a steady sequence of lower highs and lower lows. This str

SetupsFX_| GBPUSD: A Strong Bullish Reversal On The Way! Dear traders,
The GBPUSD has invalidated our previous analysis as the DXY has shown extreme bullish momentum leading to a significant price drop. The current price is trading at a critical level from which we anticipate a reversal and continuation of the bullish price movement towards 1.3950.
We r

AUDUSD Monthly CLS - Model 1 Hi friends, new range created. As always we are looking for the manipulation in to the key level around the range. Don't forget confirmation switch from manipulation phase to the distribution phase to make the setup valid. Stay patient and enter only after change in order flow. If price reaches 50%

20.02.26 Daily ForecastFX:AUDUSD - We have the potential to look for longs on this pair with the DXY failing to break the high it is currently sat at. A simple 15M continuation will confirm the move to the upside with the possibility of the DXY selling off to the downside.
FX:USDJPY - Price has formed a first touch
EUR/JPY: Intraday Bullish Reversal Confirmed The EURJPY pair experienced a significant decline last week.
However, since the beginning of this week, the pair has been consolidating within a horizontal range on a 4-hour timeframe.
Following yesterday's bullish movement, the price successfully violated the resistance of this range.
This sugges

EUR/JPY Rejected at Resistance – Sell Setup in Play (20.02.2026)📊 Description ✅ Setup TICKMILL:EURJPY
EURJPY (M30) rallied strongly but has now:
✔ Broken the ascending trendline
✔ Rejected from a clear resistance / supply zone
✔ Showing consolidation below resistance
✔ Momentum shifting bearish
The previous bullish structure is weakening, and price is stru

GBPNZD: An Upward Movement is ExpectedGBPNZD: An Upward Movement is Expected
GBPNZD respected a clean "Wedge Pattern" structure before printing a strong bullish reaction from the lower boundary.
The impulsive move higher suggests seller exhaustion and a potential short-term trend shift.
Price is now consolidating above the broken p

GBPJPY: Bullish Push to 214.29?FX:GBPJPY is eyeing a bullish continuation on the 4-hour chart , with price rebounding from the upward channel's lower boundary after forming higher highs, converging with a potential entry zone that could ignite upside momentum if buyers defend amid recent volatility. This setup suggests a rall

EURUSD Short: Bearish Channel Points Toward 1.1790 DemandHello traders! Here’s my technical outlook on EURUSD (2H) based on the current chart structure. EURUSD was previously trading inside a well-defined ascending channel, where price respected both dynamic support and resistance boundaries while forming consistent higher highs and higher lows. This stru

See all forex ideas
Trade directly on Supercharts through our supported, fully-verified, and user-reviewed brokers.


