if price can go down, abit below entry is best. this looks interesting, if really happens. good to long
Futures market

After NFPLet’s update the analysis based on the new 1-hour chart for Gold Spot/USD (XAU/USD).
Key Observations:
1. Moving Averages (200 MA and 50 MA):
• 200 MA (Blue Line): The price is currently below the 200 MA, indicating a bearish long-term trend.
• 50 MA (Yellow Line): The price is also below the 50 MA, reinforcing the short-term bearish sentiment.
2. Relative Strength Index (RSI):
• The RSI is significantly below 30, indicating oversold conditions. This suggests a potential for a short-term rebound or consolidation.
3. MACD (Moving Average Convergence Divergence):
• The MACD line is below the signal line, and the histogram is showing increasing negative values, indicating strong bearish momentum.
4. Bollinger Bands:
• The price is significantly below the lower Bollinger Band, indicating it is oversold in the short term. This often suggests a potential for a mean reversion back to the middle band (20 MA).
5. Fibonacci Retracement Levels:
• 0.236 (2370.02), 0.382 (2359.69), 0.5 (2351.34), 0.618 (2343.00)
• The price has recently dropped below all significant Fibonacci levels, indicating strong bearish pressure.
6. ATR (Average True Range):
• The ATR indicates an increase in volatility, suggesting that significant price swings may continue in the short term.
Comprehensive Technical Analysis:
1. Current Trend:
• The short-term trend is bearish as indicated by the price being below both the 50 MA and 200 MA.
2. Oversold Conditions:
• The RSI below 30 and the price below the lower Bollinger Band indicate that the market is currently oversold. This suggests a potential for a short-term rebound or consolidation.
3. Key Support and Resistance Levels:
• Resistance: 0.618 Fibonacci level (2343.00), 0.5 Fibonacci level (2351.34), and 0.382 Fibonacci level (2359.69).
• Support: The recent lows around 2315.96.
4. Momentum Analysis:
• The MACD indicates strong bearish momentum, but the oversold RSI suggests this might not last long without a correction.
Potential Buy and Sell Levels:
Buy Levels:
1. Support at Recent Low (2315.96):
• If the price finds support around this level and shows bullish reversal signals, consider entering a buy position.
• Buy Level: 2315.96
• Stop Loss: Below 2300.00 (just below the recent low to avoid false breaks)
• Take Profit: First target at 2343.00 (0.618 Fibonacci level) and second target at 2351.34 (0.5 Fibonacci level)
2. Lower Bollinger Band Area:
• Given the oversold conditions, consider buying near the lower Bollinger Band for a short-term rebound.
• Buy Level: Around 2320.00 (if the lower Bollinger Band is around this level)
• Stop Loss: Below 2310.00 (to account for potential volatility)
• Take Profit: Middle Bollinger Band (approximately 2350.00)
Sell Levels:
1. Resistance at 0.618 Fibonacci Level (2343.00):
• If the price rebounds to this level and faces resistance, consider entering a sell position.
• Sell Level: 2343.00
• Stop Loss: Above 2350.00 (just above the resistance level)
• Take Profit: First target at 2315.96 (recent low)
2. Middle Bollinger Band Area:
• If the price fails to sustain above the middle Bollinger Band, consider entering a sell position.
• Sell Level: Around 2350.00 (if the middle Bollinger Band is around this level)
• Stop Loss: Above 2360.00 (just above the middle Bollinger Band)
• Take Profit: First target at 2315.96 (recent low)
Summary:
• Buy Levels:
• 2315.96 (with stop loss below 2300.00 and take profit at 2343.00 and 2351.34)
• Around 2320.00 (with stop loss below 2310.00 and take profit at 2350.00)
• Sell Levels:
• 2343.00 (with stop loss above 2350.00 and take profit at 2315.96)
• Around 2350.00 (with stop loss above 2360.00 and take profit at 2315.96)

GOLDUSD ( idea )GOLD is sweeping LIQ and It's not enough yet. I am thinking that would to going few down again.

XAUUSD SELLLive Gold Spot to US Dollar rate. Free XAU USD chart with historical data. Top trading ideas and forecasts with technical analysis for world currencies.

After NFPLet’s update the analysis based on the new 1-hour chart for Gold Spot/USD (XAU/USD).
Key Observations:
1. Moving Averages (200 MA and 50 MA):
• 200 MA (Blue Line): The price is currently below the 200 MA, indicating a bearish long-term trend.
• 50 MA (Yellow Line): The price is also below the 50 MA, reinforcing the short-term bearish sentiment.
2. Relative Strength Index (RSI):
• The RSI is significantly below 30, indicating oversold conditions. This suggests a potential for a short-term rebound or consolidation.
3. MACD (Moving Average Convergence Divergence):
• The MACD line is below the signal line, and the histogram is showing increasing negative values, indicating strong bearish momentum.
4. Bollinger Bands:
• The price is significantly below the lower Bollinger Band, indicating it is oversold in the short term. This often suggests a potential for a mean reversion back to the middle band (20 MA).
5. Fibonacci Retracement Levels:
• 0.236 (2370.02), 0.382 (2359.69), 0.5 (2351.34), 0.618 (2343.00)
• The price has recently dropped below all significant Fibonacci levels, indicating strong bearish pressure.
6. ATR (Average True Range):
• The ATR indicates an increase in volatility, suggesting that significant price swings may continue in the short term.
Comprehensive Technical Analysis:
1. Current Trend:
• The short-term trend is bearish as indicated by the price being below both the 50 MA and 200 MA.
2. Oversold Conditions:
• The RSI below 30 and the price below the lower Bollinger Band indicate that the market is currently oversold. This suggests a potential for a short-term rebound or consolidation.
3. Key Support and Resistance Levels:
• Resistance: 0.618 Fibonacci level (2343.00), 0.5 Fibonacci level (2351.34), and 0.382 Fibonacci level (2359.69).
• Support: The recent lows around 2315.96.
4. Momentum Analysis:
• The MACD indicates strong bearish momentum, but the oversold RSI suggests this might not last long without a correction.
Potential Buy and Sell Levels:
Buy Levels:
1. Support at Recent Low (2315.96):
• If the price finds support around this level and shows bullish reversal signals, consider entering a buy position.
• Buy Level: 2315.96
• Stop Loss: Below 2300.00 (just below the recent low to avoid false breaks)
• Take Profit: First target at 2343.00 (0.618 Fibonacci level) and second target at 2351.34 (0.5 Fibonacci level)
2. Lower Bollinger Band Area:
• Given the oversold conditions, consider buying near the lower Bollinger Band for a short-term rebound.
• Buy Level: Around 2320.00 (if the lower Bollinger Band is around this level)
• Stop Loss: Below 2310.00 (to account for potential volatility)
• Take Profit: Middle Bollinger Band (approximately 2350.00)
Sell Levels:
1. Resistance at 0.618 Fibonacci Level (2343.00):
• If the price rebounds to this level and faces resistance, consider entering a sell position.
• Sell Level: 2343.00
• Stop Loss: Above 2350.00 (just above the resistance level)
• Take Profit: First target at 2315.96 (recent low)
2. Middle Bollinger Band Area:
• If the price fails to sustain above the middle Bollinger Band, consider entering a sell position.
• Sell Level: Around 2350.00 (if the middle Bollinger Band is around this level)
• Stop Loss: Above 2360.00 (just above the middle Bollinger Band)
• Take Profit: First target at 2315.96 (recent low)
Summary:
• Buy Levels:
• 2315.96 (with stop loss below 2300.00 and take profit at 2343.00 and 2351.34)
• Around 2320.00 (with stop loss below 2310.00 and take profit at 2350.00)
• Sell Levels:
• 2343.00 (with stop loss above 2350.00 and take profit at 2315.96)
• Around 2350.00 (with stop loss above 2360.00 and take profit at 2315.96)

Closing my Selling order / #47 Profits rowAs discussed on my morning's commentary: "My position: I was on sidelines session or two monitoring the developments however I missed current aggressive #2,387.80 - #2,340's decline as it was delivered in the time when I am off my charts. Regardless if you decide to Trade the news, I do expect upside surprise on NFP numbers and even stronger reaction on Gold to the downside. Even though Bear market has started, Gold still delivers Fundamentally driven aggressive spikes to the upside so protect your orders with strict Risk management".
As I announced that Gold will react strongly to upside surprise on NFP, I have engaged Selling order with #2,337.80 entry point and on NFP aftermath I have closed my Selling order on #2,314.80 on a fine #23 point Profit, extending my results range to #47 Profits and #10 Stop-loss hits regarding December - May cycle. It is indeed brilliant way to end the week and extend my results range. Have a great weekend!

Oil Spills into First Major SupportWTI has plunged more than 17.3% off the April highs with the decline responding to confluent support today at 72.14/93 - a region defined by the objective yearly open and the 2024 low-day close (LDC).
Looking for a reaction down here. . .
Initial resistance now eyed at 75.33 with bearish invalidation now lowered to 77.67 .
A break lower exposes the December LDC at 69.81 backed by the 2023 LDC at 68.527 .
Watch the weekly close here.
Michael Boutros, Sr Technical Strategist
@MBForex

GOLD BUYING(NFP)DXY is bullish and this has an inverse correlations with any currency pair ending with usd.
the price of gold over all, due to the bad negative news coming out about it, is set to go up because its a natural meneral resource.
African countries are lacing strict rulles around the trade of gold with other countries

potential type 1 accumulation on goldkeep an eye on gold on lower timeframes for a buying opportunity as this could be the spring to complete this type 1 on the 1H TF.

1h got 2335 as support but bear need to break 2327 supportsame concept with bullish break out 4h (I will post later)
right now 1H bearish trend need to break 2327 support 1st to validate the bearish indicator
it's not enough to make bottomed indicator while leaving a chance to reversal as bullish divergence later
so hit under 2327 first before retrace up (or no retrace up due powerful 4h and 12h bearish spike and momentum)
add 2355 as bull retrace up target

Sell Ideal - GOLD / XAUUSD GOLD / XAUUSD
--------------------------
In anticipation of potential weakness in the asset, adopting a patient stance is recommended. While a final rally into the $2,400 range seems unlikely at this time, the possibility remains.
However, in addition to remaining vigilant, being prepared to sell the asset is crucial. There may be an attempt to test the commitment of buyers who expressed interest at the $1,800 level at the end of February 2024, potentially supporting earlier buyers. If this scenario unfolds, the $2,000 level will be a key support protected by buyers.
A possible strategy for shorting this asset is to sell upon rejection at the top of the local range (marked in purple on the chart) at $2,369 - $2,371, or when a bearish momentum candle appears, whichever occurs first, for an early entry.
Heed your DD!


GOLD A Fall Expected! SELL!
My dear friends,
Please, find my technical outlook for GOLD below:
The price is coiling around a solid key level - 2361.2
Bias - Bearish
Technical Indicators: Pivot Points High anticipates a potential price reversal.
Super trend shows a clear sell, giving a perfect indicators' convergence.
Goal - 2345.5
About Used Indicators:
The pivot point itself is simply the average of the high, low and closing prices from the previous trading day.
———————————
WISH YOU ALL LUCK

UpdatedHi folks. Try to find a gap an sell. We take the all time high and we acumulate a lot from buysideliquidity.

XAUUSD NFP ANALYSIS AND TRADE LEVEL 7-6-24 (2)XAUUSD NFP DAY ANALYSIS 7-6-24:
Spot Gold Prices and Market Movements
Current Trends: Spot gold prices have surged to $2,387, indicating hawkish market movements. However, with the opening of the UK session, a retracement to a low of $2,340.92 has already been observed.
Upcoming Data: Looking ahead, the release of the Non-Farm Payroll (NFP) data on June 7, 2024, is highly anticipated. Gold trading is expected to be cautious, with high trade volumes and significant numbers.
Market Closures: On Monday, the markets in China and Australia, which have a substantial influence on gold prices, will be closed due to holidays.
Influencing Factors
US Dollar and Treasury Yields: Several factors, such as hawkish Federal Reserve expectations, have revived the demand for the US Dollar across the market. Treasury bond yields have rallied to multi-week highs.
GDP Data and Jobless Claims: Thursday’s revision of GDP data from 1.3% to an estimated 1.6% suggests that jobless claims might increase, which could put pressure on the Dollar. This could affect gold values, potentially pushing them back to the $2,380-$2,400 range.
Heading towards NFP show as of writing XAUUSD SPOT GOLD Prices are crashing to $2338.45 cmp now and as mentioned in our last NFP the factors influencing gold on NFP day
This helped gold price attempt a modest comeback, having incurred steep losses on Wednesday. A surprise uptick in the Core figure will reinforce delayed and less aggressive Fed rate cut expectations, providing extra legs to the US Dollar decline while smashing gold price.
Fundamental Which Might Affect XAUUSD:7-6-24
NFP Scenarios Friday:
• 150,000 or Less: Could trigger USD selloff, boosting gold.
• 200,000 to 250,000: May keep focus on inflation without major USD impact.
• 250,000 or More: Could lead to Fed rate cut, driving USD rally and gold drop
• Crucial jobs report for May. April’s NFP increase led to USD selling pressure.
Upcoming Influences:
The future of gold prices hinges on the forthcoming US Core PCE inflation data, due later in the American trading session on Friday. The Core PCE Price Index is anticipated to rise by 2.8% year-over-year in April, maintaining the same pace as observed in March.
If the Core PCE price index exceeds expectations, it could delay anticipated aggressive Federal Reserve rate cuts. This situation tends to strengthen the US dollar while exerting downward pressure on gold prices.
Conversely, if the Core PCE price index shows unexpected softness, it may increase the likelihood of a Federal Reserve rate cut in September, potentially driving a further increase in gold prices.
Depending on forthcoming economic indicators, US inflation data might propel XAUUSD into the
$2288-$2250 Range or $2400-$2450 range
Technical Level and Analysis:
Buy at:$2323.69-$2306.23-$2286.23-$2261.91
Sell at :$2388.31-$2400.67-$2425.41-$2447.34
⚠️Warning: Do not risk more than 5% of your capital, you might lose your money
🔴Technical Status: XAUUSD: 📌
D1 SMA100-P (2260.90) Buy 🔺
H4 SMA100-P (2368.74) Sell 🔻
H1 SMA100-P (2347.88) Sell🔻
H4 SMA200-P(2351.01) Buy🔺
RSI(14): Status: Oversold
STOCHRSI(14): Status: Oversold
ROC: Status: Buy
William%R: Status: Buy
ATR(14): Status: Buy
SOC: Status: Neutral
⚠️Ongoing Geo-political Tensions: ‼️
Israel – Iran
Russia - Ukraine
US-China Relations
Middle East Instability
Taiwan-China Relations

XAUUSD NFP UPDATE 7-6-24 🚨🚨H1 SMA 100-P $2320.88 Achieved ✅
Buy at $2323.6 Achieved ✅
NFP DATA ++ 272k ( Actual Release )📊📝📝

GOLD: Day 3 breakout traders long in the market, NFP weekHi everyone and welcome to my channel, please don’t forget to support all my work subscribing and liking my post, and for any question leave me a comment, I will be more than happy to help you!
“Trade setups, not movements”
1. DAY OF THE WEEK (Failed Breakout, False Break, Range Expansion)
Monday DAY 1 Opening Range
Tuesday DAY 2 Initial Balance
Wednesday DAY 3 (reset DAY 1) Mid Point Week
Thursday DAY 2
Friday DAY 3 Closing Range ✅ day 2 cycle
2. SIGNAL DAY
First Red Day
First Green Day
3 Days Long Breakout
3 Days Short Breakout
Inside Day
3. WEEKLY TEMPLATE
Pump&Dump ✅
Dump&Pump
Frontside
Backside ✅
4. THESIS:
Long: secondary, this market can keep going lower until news release in NY session, for a NYO or third hour reversal
Short: primary, looking for a pump back up into the yesterday LOD at least, taking a potential market continuation going to stop the LOW, where traders long are in profit since monday.
Please note that the purpose of my analysis is to help me and you hunting the best trade setup for the day, none of my technical aspects are a way to forecast any directional market movement.
Gianni

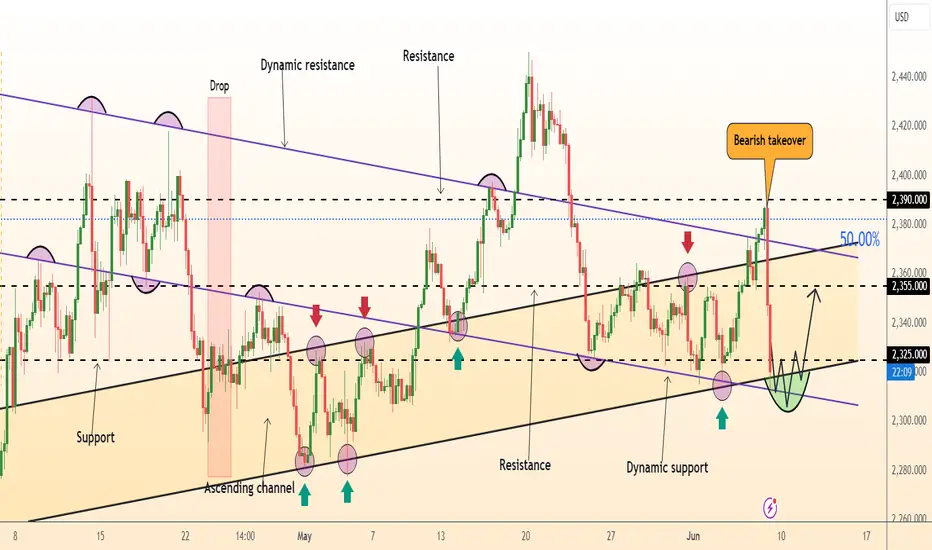
DeGRAM | GOLD pullback from the correction levelGOLD is moving between trend lines near the lower boundary of the ascending channel.
After reaching the 50% retracement level, the price formed a bearish takeover and descended into the channel.
The descending structure is broken, but a new one has not been formed yet.
We expect that a rebound may occur after a retest of the lower channel boundary with a possible drawdown below the previous low.
-------------------
Share your opinion in the comments and support the idea with like. Thanks for your support!
Long gold, target 2350
Gold price plunged by $50 before the data, and there are signs of stopping the decline in the short term. This wave of plunge is very likely to digest the data in advance, so I personally prefer a short-term rise;
Light long position, target around 2350.
If you agree with my point of view, remember to pay attention, and leave a message if you have any questions

Gold Buy (64pips)Gold has been consolidating for almost 2 weeks, we finally got a break and currently on a retest. Today is NFP day we expecting price to continue pushing Gold high, at such high impact news we recommend that you either use proper risk management or stay out of the market. This is only a trade idea and Happy Trading OANDA:XAUUSD FOREXCOM:XAUUSD TVC:DXY

GOLD FORCASTThe current analysis indicates a bearish trend for XAUUSD. A retest of 2355 is expected. If it fails to hold above this level, the price is projected to decline first to 2328 and, if it stabilizes below 2328, continue to 2306. Alternatively, if it stabilizes above 2355, a bullish trend towards 2397 is anticipated. Additionally, the market is expected to be very volatile due to upcoming NFP and Unemployment news.
Key Levels:
Bullish Lines: 2355, 2397, 2412
Bearish Lines: 2328, 2306, 2281

GOLD - Price can turn around and start rise to resistance levelHi guys, this is my overview for XAUUSD, feel free to check it and write your feedback in comments👊
Some time ago price entered to rising channel, where it soon broke $2320 level, which coincided with support area.
Then price continued to grow in channel and later reached $2390 level, which soon broke also and continued move up.
Soon, price left channel and started to decline in pennant, where it broke $2390 level again and fell to support level.
Some time price traded near this level and reached support line of pennant, after which bounced up to resistance line.
But recently, Gold fell back and now trades very close to support line of pennant, so, I think price can little fall.
After this, XAU can turn around and bounce up to $2390 resistance level, exiting from pennant.
If this post is useful to you, you can support me with like/boost and advice in comments❤️
