my xau post on previous tradethis is my trade i entered and posted on previous trade, resistance turned support then pumped.
Futures market

SUGAR/USD ShortSUGAR/USD Short
Minimum entry requirements:
• 1H impulse down below area of value.
• If 2 touch 15 min continuation, 5 min risk entry within it, or reduced risk entry on the break of it.

Gold gann GridHello Dear Traders,
Wish you a good Day,
on The chart important Levels "Horizontal levels" Based Works as Support/Resistance
Watch for Price action around those levels.
also there are gann grid the green/red trends works as close as Channels in your regular Classic analysis.
Trade around the levels and be as close as possible to take action around it.
Produced by Jinny Gann Ar.
Best Regards

Gold UpdateHello,
This is An update to the Good old chart which Calculated from 12 April High..
Amazing it Keeps respecting those lines even if they broke that high!
Jinny Gann GRid, working as your Regular Channels.. You can take help of it by drawing your Regular Channels but this would be more accurate..
Channels shouldn't Be Parallels for Reasons...Discover it
Wish you best of luck

xauusd trade at your own risk1- 15 min coch
2-cover up 15 min fvg
34 hour support zone
NOTE-trade at your own risk no finincal advice

ES Price action Review 6-5 & Over Night 6-6Going over the price action yesterday and this morning. looking for setups and what our plan is for today. no setup no trade

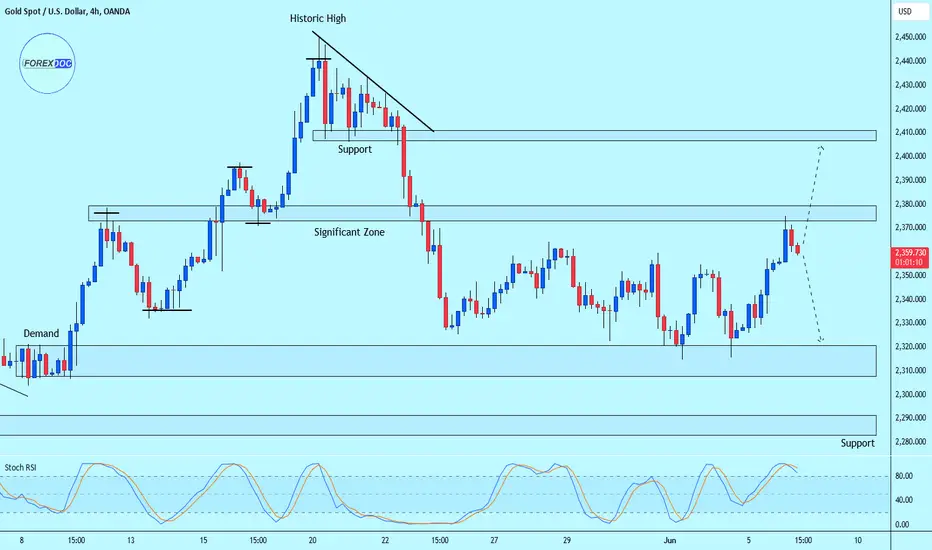
GOLD Consolidation ?Price is consolidating between our zones and it is currently testing 2375 significant zone. I expect to see bearish reaction, but if price breaks this zone, then it will likely continue to go up.
Inverted Yield of 2022 Explained - Till TodayFor our housing loan, many of us, if you are in your 30s today and all the way to 70 years of age, will likely have chosen floating or short-term loan rates rather than longer-term loan rates. However, everything changed in 2022. Now, we are more likely to choose longer-term loan rates over floating rates. Why? Because today, longer-term loan rates are lower than floating rates.
This phenomenon is called an inverted yield curve.
In the 70s and 80s, there was also a period of inverted yields, and different markets moved accordingly as expected. Today, we are seeing an inverted yield once again, and the same markets are moving in a manner similar to those in the 70s and 80s.
We will do a comparison between the 70s and today’s inverted yield. Please let me know what opportunities you see after this tutorial.
2 Year Yield Futures
Ticker: 2YY
Minimum fluctuation:
0.001 Index points (1/10th basis point per annum) = $1.00
10 Year Yield Futures
Ticker: 10Y
Minimum fluctuation:
0.001 Index points (1/10th basis point per annum) = $1.00
Disclaimer:
• What presented here is not a recommendation, please consult your licensed broker.
• Our mission is to create lateral thinking skills for every investor and trader, knowing when to take a calculated risk with market uncertainty and a bolder risk when opportunity arises.
CME Real-time Market Data help identify trading set-ups in real-time and express my market views. If you have futures in your trading portfolio, you can check out on CME Group data plans available that suit your trading needs www.tradingview.com

HelenP. I Gold can rebound down from top part of range to $2330Hi folks today I'm prepared for you Gold analytics. Some days ago price started to decline from the trend line and in a short time declined to the resistance level, after which broke this level and continued to fall. Later, Gold fell to the support level, which coincided with the support zone, and started to trades inside consolidation, where it at once started to grow. But soon, the price turned around and made a correction movement to the support zone, after which tried to grow but failed and fell back. Then XAUUSD repeated this movement and later rebounded up from the support zone to the trend line inside consolidation, and soon broke the trend line as well. After this movement, the price reached the top part of the range and started to decline, therefore I expect that GOLD will reach the trend line, then rebound up to the top part of the consolidation, after which starts to decline to the support level, breaking the trend line. That's why my goal is a 2330 support level. If you like my analytics you may support me with your like/comment ❤️


You found liquidity. Now here is what yo do with it.
In this chart price action I have marked out where previous types of liquidity existed.
At the left you can see there was an uptrend but this uptrend had no factors showing LOW liquidity. Only strong high liquidity. Using the rules below you can mark out liquidity levels and what to expect when price returns to these levels later on.
No indicator can do this for you. This is simple price action structure.
You can implement these rules into marking levels in your price patterns / shapes, if you like using those as well.
Welcome to the coffee shop everybody this is your host and Baristo Eric, and I'm here today to let you guys know about the difference between high liquidity and low liquidity pivots and when I say pivots I mean price levels in the market. I want you to keep in mind that this trick works on all time frames it doesn't matter what time frame you're looking at but it certainly works best if you're comparing the high time frame to the low time frame that you're trading on.
This is a price action trick and strategy that you do not need an indicator for. Which means you can never get this wrong as you long as you follow these rules but the minute you try using an indicator for this you're going to miss out on some important details.
Now obviously there's a few rules that you need to follow when you're looking for high liquidity or low liquidity pivots and in the image above you should be able to see it but in the text below I'll give you my breakdown of the 123 rule that you can really follow to understand what you're looking for.
Here's a few rules to follow:
1. Bullish candles make high pivots
2. Bearish candles make low pivots
3.the length of the Wick of the candle is the trigger to tell you what you're looking for.
You cannot find low or high liquidity in a market during the trend. You can only see it after the trend has finished and you are either currently ranging or you are in the alternate trend meaning you were in a downtrend and now you're in an uptrend or a sideways market. You want to look for these liquidity types in the previous trend but using the strategy in this video you can also find high and low liquidity in arranging markets simply by looking at the ranging market that previously took place.
The trick to finding liquidity in the market goes like this:
Finding Sell Liquidity (Resistance) in previous market moves.
If you were in a downtrend and now it has completed you can look backwards at that downtrend and find all the bullish candles that will reflect the rules you were looking for.
Look at the downtrend and find the bullish candles.
You want the bullish candles that had swing highs and their upper Wick is longer than their lower Wick.
If the previous market was an uptrend you simply wanna do the opposite:
and previously up trending market you wanna find all the bearish candles and those bearish candles need to have a swing low Wick plus the Wick on the bottom must be longer than the Wick on top. These will reflect your SUPPORT levels (Buy Liquidity)
One of the questions often asked is what do you do with these levels once you find them.
Once you find low liquidity levels you wanna mark them this way you can treat them as plausible breakout areas meaning that with low liquidity in these areas price will reach those areas later on and price will continue to move through them because there are very few participants trying to buy or sell in a low liquidity area.
High liquidity area however simply means there is a lot of volume lot of activity and when price reaches back to these levels that price will either stall or reverse at these levels.
High liquidity areas also mean that these are banks and institutions trading at these levels so price can pull away from it retest and then come back to it for a very large move initiated by that same level.

OPEC Secretary-General Affirms Resilient Oil Demand
OPEC Secretary-General Affirms Resilient Oil Demand
OPEC Secretary-General Haitham Al-Ghais stated at the St. Petersburg International Economic Forum on Thursday that oil demand remains resilient. "It's crucial to stay focused on the fundamentals," he emphasized. "Economic growth, supply, and demand are what drive our decisions."
Al-Ghais noted that global demand increased by 2.3 million barrels per day in the first quarter, typically the weakest quarter due to global refinery maintenance. He anticipates continued strong demand in the coming months, particularly with the uptick in summer travel.
Saudi Energy Minister Dismisses Bearish Response to OPEC+ Deal, Confident Market Will Adjust
Saudi Energy Minister Prince Abdulaziz bin Salman dismissed the market's bearish reaction to OPEC+'s decision to gradually phase out voluntary output cuts, expressing confidence that the market will adjust. "Give it a day or two, reality will set in," he stated at the St. Petersburg International Economic Forum on Thursday. He criticized some banks and media outlets for their narratives around the meeting and reaffirmed that OPEC+ made the right decision. "I know that we did the best job," he asserted.
The OPEC+ meeting initially triggered an oil selloff, exacerbated by short selling and movements in the options market, as traders worried about potential oversupply. However, Abdulaziz emphasized that OPEC+ retains the flexibility to pause or reverse production increases based on market conditions.
OIL OUTLOOK
Oil prices increased early as we mentioned, recovering from a four-month low, which was the lowest point since February. This drop was attributed to an unexpected surge in U.S. stockpiles, indicating softer demand than anticipated.
Technically:
The price has stabilized within the bearish zone, having already corrected the previous barrier which is 75.39. This suggests a continuation of the bearish trend, with potential targets at 72.500 and 70.570. A further break below 72.500 could lead the price down to 70.570.
Conversely, if the price stabilizes above 75.400, it may indicate a bullish trend, potentially reaching up to 78.070.
Pivot line: 75.390
Support lines: 72.50, 70.57, 68.12
Resistance lines: 76.80, 78.07, 79.35
The movement range will be between support 70.57 and Resistance 76.80
previous idea:

ES1 to $5,500An inverse head and shoulder has been completed, and I will be expecting a price change to around $5,500.

Gold In Bullish TrendGold is giving us a surprise buy printing new Higher High Higher Low with good confirmation of Bullish Flag reversal pattern. Now we will be taking Good and safe entry depending on the current situation. Thanks
My Positions
Buy Stop : 2376
SL :2327
TP :2326

SILVER Will Go Up From Support! Buy!
Take a look at our analysis for SILVER.
Time Frame: 12h
Current Trend: Bullish
Sentiment: Oversold (based on 7-period RSI)
Forecast: Bullish
The market is approaching a key horizontal level 29.778.
Considering the today's price action, probabilities will be high to see a movement to 31.980.
P.S
The term oversold refers to a condition where an asset has traded lower in price and has the potential for a price bounce.
Overbought refers to market scenarios where the instrument is traded considerably higher than its fair value. Overvaluation is caused by market sentiments when there is positive news.
Like and subscribe and comment my ideas if you enjoy them!

And we are back for another day of tradingThis is what I think will happen today given that we are bearish. Usually the market does not get to buy side or sellside liquidity. Which means that I will not pursue him if he does not respect my strategy. I will not trade

LOOKING TO BUY IN BEFORE THE SELL OFFXAU/USD 15M - Above you will see a trade I am looking at placing on the basis that I feel price is within a corrective wave which I want to see trade us up and into the Supply Zone above.
This is where I feel the correction will come to an end as we will offload on buys in the market and introduce Supply, giving us the S&D flip we want in order to see this market take its next bearish run.
I have marked out a fair value gap above that price has traded down and into perfectly, we are seeing price hover round this area of interest as it is currently failing to break beneath it.
I am wanting to see enough Demand being introduced here to go on and take this market higher again, creating some new highs within the fractal structure of this higher timeframe correction.
My SL has been placed underneath the FVG to give price enough room to breath and my TP has been set just below my target area to ensure that our TP is achievable. Ensure you have confirmation to enter and you are applying safety measures.

3 contracts Short on PlatinumBreakout of trendline | Fib retreacement | Short trend till 966 in order to close the previous inefficiency.

Adding one more contract Short on Platinum in case of break Waiting for the break to short one more contract on PL.
Ready to close the trade once all inefficiencies are covered.

XAUUSD scenarios To remove the orders, we envision two scenarios that are specified in the picture. As mentioned in the previous analysis, the first scenario is more likely, we have to see what decision will happen to the market according to the news and the trading process and the volume of transactions.

SILVER BUYERS WILL DOMINATE THE MARKET|LONG
Hello,Friends!
We are targeting the 30.913 level area with our long trade on SILVER which is based on the fact that the pair is oversold on the BB band scale and is also approaching a support line below thus going us a good entry option.
✅LIKE AND COMMENT MY IDEAS✅

XAUUSD - Bullish TrendXAUUSD will start Bullish Trend?
There is divergence and breakout for Bullish Trend.
Entry, Stop Loss & Take Profit are mentioned.

Gold Bulls Show Strength Amidst Market VolatilityAt the opening of Thursday's session, gold bulls demonstrated their dominance, pushing the gold price to around $2374—a new high for the past nine trading days.
Today's Strategy: Focus on buying opportunities at lower price levels. Key support lies in the $2361-$2356 range, with $2356 serving as the starting point for this morning's upward movement. Other positions are being monitored for optimal entry points.
For more insights and live updates, Click my Profile
