Tram37 SMA calculates the average price over the last 377 periods.
SMA 37 can help identify major trends or reversals, acting as dynamic support/resistance, Useful in low-noise, trending markets. Prices may respect the SMA 377 as a dynamic level, especially in markets where Fibonacci levels are widely watched.
It works better in trending markets than in choppy or range-bound markets, where it may generate false signals.
Chart patterns

Bar Count for XAUThis TradingView indicator labels every other five-minute candle for XAU during the current Beijing session, which runs from 06:00 to 05:00 the next day. It shows the actual bar numbers—1, 3, 5, and so on—only for today’s session; yesterday’s labels are automatically cleared at the new open. The tags appear just below each qualifying candle with no background box, and you can adjust the font size in the settings. In short, it gives you a clean, real-time visual of intraday bar order without clutter

Two-Leg MA BreakoutBased on your indicator code, here's a suggested description for public publishing:
---
# Two-Leg MA Breakout Indicator
A powerful technical analysis tool that identifies high-probability trading opportunities using a two-leg moving average breakout pattern. This indicator detects when price forms a pullback after an initial MA crossover, then continues in the original direction - a pattern that often precedes strong trend continuations.
## Key Features:
- Customizable fast and slow moving averages (EMA/LWMA options)
- Multiple filter options to improve signal quality:
- Trend filter using longer-term MA
- ADX for trend strength confirmation
- Volatility filters using ATR
- RSI momentum filter
- Volume confirmation
- Candlestick pattern validation
- Session time filtering
- Visual trade signals with customizable display options
- Supports both long and short trading strategies
- Alert conditions for automated notifications
Perfect for swing traders and trend followers looking for high-quality entry points in trending markets. The indicator identifies pullback opportunities within established trends for optimal risk/reward entries.
Developed By Sovath

ORB-X v6 (Dashed OR Lines)// ORB-X v6 (Opening Range Breakout + Fibonacci Extensions) by Opskie
// Description:
// This indicator automatically captures the high and low of the first X minutes of the trading session
// and draws them as yellow dashed lines extending into the rest of the day. Alert conditions fire
// when price breaks above or below the opening-range high/low.
// User Inputs:
// • Session Start Hour/Minute: define when your market open begins
// • Range Length: how many minutes after open to form the opening range
//
// Key Benefits:
// • Immediate visual context for where price is trading relative to the opening range
// • Daily reset ensures each new session starts fresh
// • Built‑in alerts for breakout entries

Lot Size (USD)Calculate lot size and stop loss from the actual price to the stop loss that you enter manually. Only for Forex pairs with USD

M's Ultimate Screener V8.5 (Turbo + Smart Zones + Final Fixed)Custom indicator from my trading experience
is built to offer traders a comprehensive view of the market with minimal complexity. It combines multiple technical factors, such as MACD momentum, volume confirmation, RSI strength, moving average trend direction, etc., to generate clear and intuitive signals.
Key Features:
📈 Clear Buy/Sell signals based on multi-confirmation setups
🔥 Works on all timeframes and for all asset classes (stocks, forex, crypto, indices)
🚀 Filters out low-quality trades using volume and trend conditions
📊 Customizable settings to fit different strategies and risk appetites
⚡ Built-in alerts for real-time signal notifications
📅 Designed for day traders, swing traders, and long-term investors


Nexus Scalping System v7.8
Welcome to the Scalping Elite
Gain a market advantage in just a few clicks.
The Nexus Scalping System was created for demanding traders who seek institutional precision in the financial markets. With a targeted win rate between 78% and 82%, it combines the best trend detection and sniper entry technologies.
🔬 Key Features
Ultra-precise Buy/Sell signals based on IPC, QQE, MACD
Automatic TP1 and TP2 with Risk Reward (RR) management
Automatic Stop Loss to secure every trade
Mobile Push and Email Alerts so you never miss an opportunity
No repaint: stable and reliable signals
Optimized for GOLD (XAUUSD) on M15 and H1

Full Breakout + Breakdown Signal with 5 LabelsThis script is a comprehensive breakout and breakdown detector designed for traders who want to monitor both long and short opportunities. It identifies when price breaks above resistance (bullish breakout) or below support (bearish breakdown), using volume confirmation and optional multi-timeframe validation for higher accuracy.
Five distinct signal states are visually displayed directly on the chart as color-coded labels: Breakout, Near Breakout, Neutral, Near Breakdown, and Breakdown. Bullish signals appear above the price bar, while bearish signals are plotted below, making chart interpretation fast and intuitive.
Alerts are integrated for confirmed breakouts and breakdowns, with webhook-ready JSON messages. This makes it ideal for use with automated systems, email alerts, or daily summary scripts.
Market sentiment overlays based on the S&P 500 and Bitcoin trend provide broader context to filter trades during bullish or bearish macro conditions. These are shown via background color shifts based on 50-day moving average crossovers.
All parameters—lookback periods, volume thresholds, and sentiment settings—are fully customizable. Whether you’re trading momentum breakouts or anticipating reversals, this tool provides a clear, visual edge for decision-making.

MACD Divergence IndicatorThis MacD Divergence (redundant?) Indicator identifies bearish and bullish divergence via the histogram of the MacD relative to the price action. This is very useful for using at key levels to identify reversal opportunities. Pair's well with my "Rally Sweep...." scripts.
View my youtube for more information - www.youtube.com

Clarity Strategy: UT Bot + HMA + JCFBV (v6 fixed)The Clarity Strategy filters UT Bot signals with trend, volatility, and candle strength for high-accuracy entries, using dynamic or fixed TP/SL.

Rally Sweep RS w/ Optional BB or Bias + SwingUse Bollinger Band Filter? - This looks for Rally and Sweeps that occur at the upper or lower bollinger band.
Also Use Basis (Bias) Filter? - This is the mid line of the Bollinger Band - often times a great level for price to pullback to and setup for a continuation trade. This turns its filter on or off.
Require Swing Break? - This is creating and using swing points. It has to be beyond the most recent swing levels for a signal to.... signal. The value of the swing level is an adjustable field at the top of the indicator settings.
USE on 1M and 5M charts. Created originally for futures NQ/ES but does appear to be valid on other markets.
USE THIS AT KEY LEVELS FOR REVERSAL - Prior day value area high/low, overnight high low, prior days highs/lows, etc etc.
Use this for continuation when it rallies into a 5M FVG and instantly signals the indicator.
WAIT for the close of the candle to enter.
View my youtube for more information
www.youtube.com

Multi 10 Symbol Scanner Table V1Script Summary: "Multi 10 Symbol Scanner Table V1"
This TradingView indicator acts as a powerful market scanner dashboard. Instead of plotting signals on your main price chart, its primary purpose is to display a table summarizing the technical status of up to 10 different assets (stocks, crypto, forex pairs, etc.) that you choose.
Think of it as a watchlist on steroids. It analyzes each symbol you enter based on a consistent set of rules you define and presents the results side-by-side in the table for quick comparison.
Here's what the table shows for each symbol you add:
Symbol: The ticker name of the asset being scanned.
Actual Price: The current market price of that asset.
Price vs. MAs: Indicates the short-term trend based on whether the price (on the chart's current timeframe) is above two moving average lines ("Above Both"), below them ("Below Both"), or in between ("Mixed"). This column is color-coded (Green/Red/Gray).
RSI Value: Shows the current RSI (Relative Strength Index) number, a measure of momentum (calculated on the chart's current timeframe).
RSI Status: Tells you if the RSI is currently "Overbought," "Oversold," or "Neutral" based on the levels you set. This column is color-coded (Red/Green/Gray).
SIG NOW: A combined "immediate signal" based on the Price vs. MAs and RSI Status conditions (calculated on the chart's current timeframe). It shows "BUY," "SELL," or "NEUTRAL" and is color-coded (Green/Red/Gray).
ALERT: Flags unusual trading volume activity (calculated on the chart's current timeframe). It shows "SPIKE" for high volume, "DUMP" for low volume, or "NONE." This column is color-coded (Orange/Purple/Gray).
LTS (TF1), LTS (TF2), LTS (TF3): These three columns show separate Long-Term Signals for each asset. Each signal is calculated independently using Bollinger Bands on a different, higher timeframe that you specify (e.g., Daily, Weekly, Monthly). It shows "BUY," "SELL," or "NEUTRAL" along with the price at which that signal occurred on that specific higher timeframe. These columns are also color-coded (Green/Red/Gray).
In essence: This script lets you monitor multiple assets simultaneously from one place, checking their short-term trend, momentum, volume activity, and longer-term signals across three different time perspectives, all updated in real-time within the table.
Important Note: This script only displays information in the table. It does not plot any lines or signals on your main chart, nor does it generate built-in TradingView alerts. It's purely a visual dashboard for scanning.
How to Adjust the Script Settings
You can customize the scanner through its "Settings" panel in TradingView. Here’s how to adjust each part:
1. Symbols (Enter Ticker IDs like 'BINANCE:BTCUSDT')
Symbol 1 to Symbol 10: These are the 10 slots where you enter the assets you want to scan.
How to Enter: You need the full Ticker ID, often including the exchange prefix. Examples: NASDAQ:AAPL, BINANCE:BTCUSDT, FX:EURUSD, NYSE:GME. You can find these using TradingView's symbol search.
Leaving Blank: If you don't need all 10 slots, just leave the extra ones blank. The table will only show rows for the symbols you've entered.
2. Indicator Settings (Chart Timeframe)
These settings define the rules for the analysis performed using the timeframe of the chart you currently have open. These rules are applied to all symbols in your list for the "Price vs MAs," "RSI," "SIG NOW," and "ALERT" columns.
MA Source: Choose which price point (Close, Open, High, Low, etc.) the moving averages should be based on. (Default: Close)
Short MA Period: Set the number of bars for the shorter-term moving average. A smaller number reacts faster. (Default: 20)
Long MA Period: Set the number of bars for the longer-term moving average. A larger number shows a smoother trend. (Default: 50)
RSI Source: Choose which price point the RSI momentum calculation should use. (Default: Close)
RSI Period: Set the number of bars for the RSI calculation. (Default: 14)
RSI Overbought Level: The RSI level above which an asset is considered "Overbought" in the table. (Default: 70)
RSI Oversold Level: The RSI level below which an asset is considered "Oversold" in the table. (Default: 30)
SIG NOW RSI Buy Min: The minimum RSI value required (along with price being above MAs) to show a "BUY" signal in the "SIG NOW" column. (Default: 55)
SIG NOW RSI Sell Max: The maximum RSI value required (along with price being below MAs) to show a "SELL" signal in the "SIG NOW" column. (Default: 45)
Volume Lookback (LBV): How many bars (on the chart's timeframe) to look back to calculate the average volume for the Spike/Dump alerts. (Default: 3)
Volume MA Type: The type of averaging method used for the volume calculation. (Default: EMA)
3. Volume Alert Settings
These control the sensitivity of the "ALERT" column (Spike/Dump detection) for all symbols.
Volume Alert Sensitivity: Choose a preset:
"Normal": Standard thresholds.
"Sensitive": Easier to trigger alerts.
"Highly Sensitive": Easiest to trigger alerts.
"Custom": Uses the manual multipliers below.
Custom Spike Multiplier (>1): (Only used if Sensitivity is "Custom") Volume must be this many times greater than average to trigger SPIKE. (e.g., 1.5 = 50% higher).
Custom Dump Multiplier (<1): (Only used if Sensitivity is "Custom") Volume must be this many times smaller than average to trigger DUMP. (e.g., 0.7 = 30% lower).
4. Long Term Signal (LTS) Settings
These settings control the calculations for the three independent "LTS" columns in the table. Each LTS column analyzes data from a specific higher timeframe you choose.
LTS Timeframe 1 / 2 / 3: Select the higher timeframes (e.g., 'D' for Daily, 'W' for Weekly, 'M' for Monthly) for each of the three LTS calculations. These will determine the data used for the corresponding LTS columns in the table.
LTS BB Source: The price source used for the Bollinger Band calculation on the selected LTS timeframes. (Default: Close)
LTS BB Length: The period (number of bars on the chosen LTS timeframe) used for the Bollinger Band calculation. (Default: 20)
LTS BB StdDev: The standard deviation multiplier for the Bollinger Bands used in the LTS calculations. (Default: 2.0)
5. Table Settings
These control the appearance of the scanner table itself.
Table Position: Choose which corner or side of the chart the table should appear on.
Decimal Places (Non-Price): How many decimal places to show for values like the RSI number in the table.
Table Text Size: Adjust the font size inside the table cells ("tiny", "small", "normal", "large", "huge").
By adjusting these settings, you can tailor the scanner to focus on the assets, timeframes, and technical conditions that matter most to your trading strategy. Remember to enter valid ticker symbols for the assets you want to track.
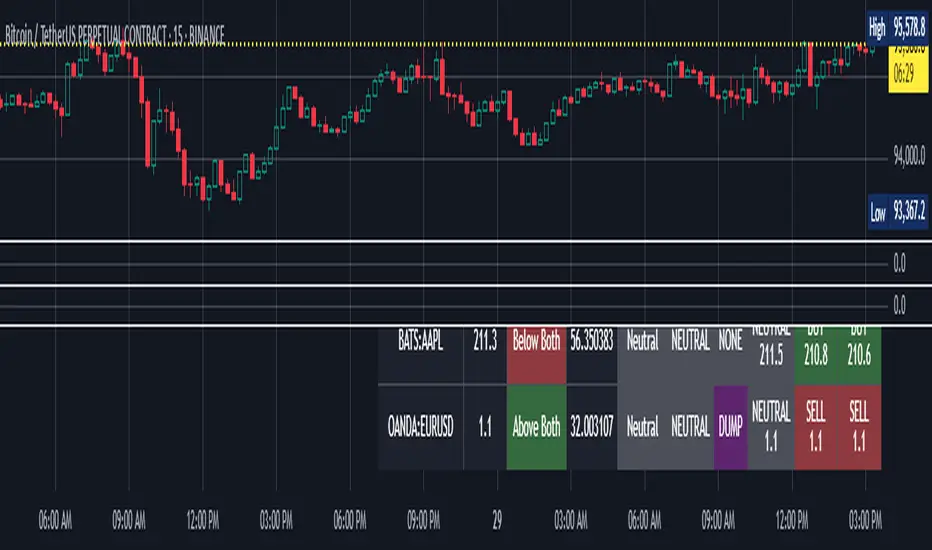
Chart Plotter & Scanner Table V1Script Summary: "Chart Plotter & Scanner Table V1"
This TradingView indicator is designed to give you a comprehensive analysis of the single stock, crypto, or asset currently displayed on your chart. It does this in two main ways:
Visual Signals on the Chart: It draws helpful information directly onto your price chart:
Trend Lines: Plots two moving average lines (one short-term, one long-term) to help you visualize the current price trend.
Buy/Sell Markers ("SIG NOW"): Shows triangle markers below the price (green for potential Buy) or above the price (red for potential Sell) when specific conditions related to price trend and momentum (RSI) are met.
Volume Activity Markers ("ALERT"): Displays small labels ("S" for Spike, "D" for Dump) when the trading volume is unusually high or low compared to its recent average, indicating potentially significant market activity.
Long-Term Signal Markers ("LTS"): Shows small shapes (circles, diamonds, squares) to indicate potential long-term Buy or Sell signals derived from analyzing price action on up to three different, higher timeframes (like Daily, Weekly, Monthly) that you choose.
Status Summary Table: It displays a neat table on your chart (you choose the corner) that acts like a dashboard, summarizing the key findings for the current asset:
Symbol & Price: Shows the ticker symbol and the latest price.
Price vs. Trend: Tells you if the current price is above both trend lines ("Above Both"), below both ("Below Both"), or in between ("Mixed"), with color-coding (Green/Red/Gray).
Momentum (RSI): Shows the current RSI value and its status ("Overbought", "Oversold", or "Neutral"), with color-coding (Red/Green/Gray).
Immediate Signal ("SIG NOW"): Displays the current Buy, Sell, or Neutral status based on the combined trend and momentum rules, with color-coding (Green/Red/Gray).
Volume Alert ("ALERT"): Shows if there's a volume Spike, Dump, or None, with color-coding (Orange/Purple/Gray).
Long-Term Signals (LTS): Shows the Buy, Sell, or Neutral status calculated from each of the three chosen higher timeframes, including the price at which the signal occurred on that timeframe, with color-coding (Green/Red/Gray).
Essentially, this script combines short-term trend and momentum analysis with volume activity monitoring and longer-term perspective signals, presenting the information clearly on your chart and in a summary table for quick assessment. It also allows you to create TradingView alerts based on these signals.
How to Adjust the Script Settings
You can customize how this script works through its "Settings" panel in TradingView. Here’s a breakdown of each section:
1. Indicator Settings (Chart Timeframe)
These settings control the main calculations done on your current chart's timeframe.
MA Source: Choose which price point (Close, Open, High, Low, etc.) the moving averages should be based on. (Default: Close)
Short MA Period: Set the number of bars for the shorter-term moving average. A smaller number makes it react faster to price changes. (Default: 20)
Long MA Period: Set the number of bars for the longer-term moving average. A larger number shows a smoother, longer-term trend. (Default: 50)
RSI Source: Choose which price point the RSI momentum calculation should use. (Default: Close)
RSI Period: Set the number of bars for the RSI calculation. (Default: 14)
RSI Overbought Level: The RSI level above which the asset is considered potentially "Overbought". (Default: 70)
RSI Oversold Level: The RSI level below which the asset is considered potentially "Oversold". (Default: 30)
SIG NOW RSI Buy Min: The minimum RSI value required (along with price being above MAs) to trigger a "SIG NOW" Buy signal. (Default: 55)
SIG NOW RSI Sell Max: The maximum RSI value required (along with price being below MAs) to trigger a "SIG NOW" Sell signal. (Default: 45)
Volume Lookback (LBV): How many bars to look back to calculate the average volume for the Spike/Dump alerts. (Default: 3)
Volume MA Type: The type of averaging method used for the volume calculation (EMA is generally preferred for responsiveness). (Default: EMA)
2. Volume Alert Settings
These control how sensitive the Volume Spike/Dump alerts are.
Volume Alert Sensitivity: Choose a preset sensitivity level:
"Normal": Standard thresholds for spike/dump detection.
"Sensitive": Requires less deviation from the average volume to trigger an alert.
"Highly Sensitive": Triggers alerts on even smaller volume deviations.
"Custom": Ignores the presets and uses the manual multipliers below.
Custom Spike Multiplier (>1): (Only used if Sensitivity is "Custom") How many times greater than the average volume the current volume must be to trigger a SPIKE. (e.g., 1.5 means 50% higher).
Custom Dump Multiplier (<1): (Only used if Sensitivity is "Custom") How many times smaller than the average volume the current volume must be to trigger a DUMP. (e.g., 0.7 means 30% lower).
3. Long Term Signal (LTS) Settings
These settings control the calculations for the three independent Long-Term Signals, which look at higher timeframes.
LTS Timeframe 1/2/3: Select the higher timeframes (e.g., 'D' for Daily, 'W' for Weekly, 'M' for Monthly) for each of the three LTS calculations.
LTS BB Source: The price source used for the Bollinger Band calculation on the LTS timeframes. (Default: Close)
LTS BB Length: The period (number of bars on the LTS timeframe) used for the Bollinger Band calculation. (Default: 20)
LTS BB StdDev: The standard deviation multiplier for the Bollinger Bands used in the LTS calculation. (Default: 2.0)
4. Plotting Settings
These control what is visually displayed on the price chart itself.
Plot MAs?: Checkbox to show or hide the two moving average lines.
Plot SIG NOW Markers?: Checkbox to show or hide the green/red triangle Buy/Sell markers.
Plot ALERT Markers?: Checkbox to show or hide the "S" / "D" volume Spike/Dump labels.
Plot LTS Markers?: Checkbox to show or hide the long-term signal markers (circles, diamonds, squares).
Plot LTS Markers For: Dropdown to choose whether to show markers for only LTS TF1, TF2, TF3, or "All" of them.
5. Table Settings
These control the appearance and content of the summary table.
Show Status Table?: Checkbox to show or hide the entire summary table.
Table Position: Choose which corner or side of the chart the table should appear on.
Decimal Places (Non-Price): How many decimal places to show for values like the RSI number in the table.
Table Text Size: Adjust the font size inside the table cells.
Setting Up Alerts:
This script creates the conditions for alerts. To actually receive notifications:
Click the "Alert" button (clock icon) in TradingView's top toolbar or right-click on the chart.
In the "Condition" dropdown, select the script name ("Chart Plotter & Scanner Table V1").
You will see a list of available alert conditions created by the script (e.g., "SIG NOW Buy Alert", "RSI Overbought Alert", "LTS TF1 Buy Alert", etc.). Choose the one you want.
Configure the rest of the alert settings (Options, Actions, Message) as desired.
Click "Create". Repeat for any other signals you want alerts for.
By adjusting these settings, you can fine-tune the indicator to match your trading style, the specific asset you are analyzing, and the timeframes you are interested in.

RESHAthey are algorithmically generated liquidity clusters based on historical tick data, volatility shifts, and order flow sensitivity.
The algorithm identifies price congestion points where institutional activity or large-volume reactions occurred, not visible through conventional technical indicators. The closer and denser the zones, the higher the probability of a reaction, reversal, or acceleration from that area.


PoiBoxPOI Box — Smart Money Concepts (SMC) Tool
This indicator identifies Points of Interest (POI) based on Smart Money Concepts. It analyzes market structure shifts, detects inducement and liquidity sweeps, and dynamically calculates POI zones using ATR-based logic across multiple timeframes.
Key Features:
Time Range Selection: Define the range of candles (X1 to X2) for localized structure analysis.
Automatic High/Low Detection: Finds key structure points (highest high and lowest low).
Dynamic POI Calculation: Calculates POI zones relative to ATR values across M1 to Monthly timeframes.
QM (Quasimodo) Detection: Automatically marks Quasimodo reaction zones after liquidity grabs and market structure breaks.
Visual Labels: Structure points are marked (H, L, H.H, L.L) for easy identification of market shifts.
Dashboard Display: Shows zone height, closest ATR timeframe, trigger timeframe, and POI values.
Customizable Settings: Full control over label colors, box extension settings, and visibility options.
Update Notes:
Added automatic QM detection and labeling.
Mode selection is now automatic based on structure shifts.
Disclaimer:
This script is for educational purposes only. It is not intended as financial advice. Please conduct your own analysis before making trading decisions.


Dragon Hunter sub chartTrading system , best time frame is 3-5 minutes. blue color is up trend, red color is down trend , please follow the trends always.

ZLEMA + Custom Momentum Cross v6.6 [CP Base]This script uses Zema for 9, 20, 50 which can be configured. Also, displays Zema of 15 min to show the 15min trend.
Also, uses Momentum code from ChartPrime.
When both momentum and zema alignment is there, we can trade.

Breakout Patterns Detector: Triangle & Wedge [Splirus]This indicator identifies Breakout Patterns such as Ascending Triangles , Descending Triangles , Symmetric Triangles , Ascending Wedges , and Descending Wedges , using candlestick charts and Trendlines. It provides visual cues, stop-loss (SL), and take-profit (TP) levels, alongside a detailed dashboard to evaluate performance. The indicator supports two alert modes: Manual Mode for trader notifications and Bot Mode for automated trading signals.
To achieve optimal results, users are encouraged to experiment with indicator parameters and analyze the dashboard summary to find the perfect configuration for each timeframe, pair, and market condition.
Pattern Identification
The indicator detects the following breakout patterns based on pivot highs and lows:
Ascending Triangle : Flat upper trendline, rising lower trendline.
Descending Triangle : Flat lower trendline, declining upper trendline.
Symmetric Triangle : Converging trendlines with similar slopes (within a user-defined threshold).
Ascending Wedge : Both trendlines slope upward, converging.
Descending Wedge : Both trendlines slope downward, converging.
Patterns are identified using configurable left and right bars for small and big patterns, with slope thresholds normalized by ATR. A trend confirmation filter ensures breakouts align with market direction, and users can adjust breakout confirmation bars to validate signals.
The goal is to fine-tune these settings to suit specific timeframes and pairs, as each combination may require a unique setup for optimal performance.
Stop-Loss Calculation
Stop-loss levels are calculated dynamically based on pattern type and breakout direction:
Symmetric Triangle : SL is set at the first pivot of the opposite trendline, adjusted by a buffer percentage.
Ascending/Descending Triangle : SL is placed at the breakout trendline’s price, plus the buffer.
Ascending/Descending Wedge : SL is set at the second pivot of the opposite trendline, adjusted by the buffer.
The indicator calculates leverage based on a user-defined risk tolerance percentage. Users should adjust the SL buffer and risk tolerance to balance risk and reward, monitoring the dashboard to assess how these settings impact performance across different timeframes and pairs.
Take-Profit Calculation
Three take-profit levels ( TP1 , TP2 , TP3 ) are calculated using pattern height and user-defined multipliers:
For Ascending/Descending Triangles, height is the difference between the max and min prices within the pattern.
For Symmetric Triangles and Wedges, height is the vertical distance between trendlines at the pattern’s start.
TP levels are set as:
TP1 = Breakout price ± (Height × TP1 Multiplier).
TP2 = Breakout price ± (Height × TP2 Multiplier).
TP3 = Breakout price ± (Height × TP3 Multiplier, with a 1.5x adjustment for Wedges).
Experiment with TP multipliers to optimize the risk-reward ratio, using the dashboard to evaluate TP hit rates and overall profitability for each configuration.
Symmetric Triangle:
Ascending/Descending Wedge:
Ascending/Descending Triangles:
Finding the Perfect Configuration
The indicator’s dashboard provides a comprehensive summary of performance metrics, including total trades, TP1/TP2/TP3 hits, SL hits, profit/loss percentages, and win rates for bullish, bearish, and combined trades. These metrics are crucial for identifying the ideal parameter settings:
Timeframe and Pair Variability : Each timeframe (e.g., 15m, 30min, 1H, 4H, Daily) and pair (e.g., BTC/USD, EUR/USD) behaves differently. Adjust parameters like left/right bars, minimum pattern length, and breakout confirmation bars to match the volatility and trend characteristics of the chosen pair and timeframe.
Parameter Tuning : Modify slope thresholds, trend confirmation filters, and bars inside the pattern to filter out false breakouts. For example, a higher breakout confirmation bar setting may reduce signals but increase reliability on longer timeframes.
Dashboard Analysis : Focus on the dashboard’s win rate, profit/loss ratio, and TP/SL hit frequencies. A “Perfect” win rate (>66%) or high TP hit rate indicates a strong configuration. If the SL hit rate is high, consider tightening the trend confirmation filter or increasing the SL buffer.
Iterative Testing : Test different combinations of settings (e.g., small vs. big patterns, aggressive vs. conservative breakout confirmation) and compare dashboard results over time. The goal is to find a balance where the indicator consistently delivers high win rates and profitability for your specific trading setup.
Alert Modes
The indicator supports two alert modes to suit different trading styles:
Manual Mode : Generates alerts for breakouts with entry price, SL, TP1/TP2/TP3, and leverage, tailored for Crypto or Forex markets. Use this mode to manually evaluate signals while refining configurations.
Bot Mode : Sends automated trading signals. To avoid conflicts, Bot Mode ensures no short position alert is triggered while a long position is active, and vice versa. This mode is ideal once you’ve identified an optimal configuration via the dashboard.
Additional Features
Historical Patterns : Displays past trendlines with customizable transparency and extension, helping users analyze how patterns performed under different settings.
Customizable Settings : Adjust pattern size, breakout confirmation, trend filters, and visual preferences (colors, dashboard location) to match your trading style.
Market Compatibility : Supports Crypto and Forex markets across all timeframes, but requires careful tuning for each market type.
Usage Notes
Start with default settings and monitor the dashboard to establish a baseline performance for your chosen timeframe and pair.
Gradually adjust one parameter at a time (e.g., left/right bars, TP multipliers) and compare dashboard results to identify improvements.
Use historical pattern analysis to understand how past breakouts performed under different configurations, guiding your optimization process.
Once a high win rate and profitability are achieved, consider automating trades with Bot Mode for consistent execution.
Disclaimer
This indicator is intended for educational purposes only and should not be considered financial advice. Trading involves significant risk, and past performance is not indicative of future results. Users are strongly advised to thoroughly test and validate the indicator’s signals in a demo environment before using it in live trading. The author is not responsible for any financial losses incurred while using this indicator. Always conduct your own research and consult with a qualified financial advisor before making trading decisions.

AlphaTrend (PRO)AlphaTrend is an advanced trading indicator that leverages proprietary tools, real-time data, and custom metrics to give traders a competitive edge. Designed for all experience levels, it works instantly—no advanced charting skills required.
🔍 How It Works
At the core of AlphaTrend is Dynamic Reversion Bands (not shown) — a sophisticated real-time system that adapts to price action by automatically adjusting to evolving market conditions.
These bands act like a roadmap, helping traders identify:
Mean reversion trade opportunities
Trend strength
Emotion-driven market conditions (like FOMO)
The system is rooted in Mean Reversion Theory:
If an asset's price deviates significantly from its historical average, it tends to “revert” back to that average over time. Traders can use this behavior to spot potential buying or selling opportunities:
Overbought Conditions: If the price moves too far above the mean, it may signal a pullback—traders might sell or short.
Oversold Conditions: If the price drops well below the mean, it may be undervalued—traders might buy in anticipation of a bounce.
⚪🟡🔴🟡⚪ Dynamic DOTS
AlphaTrend visualizes market overextension through dynamic DOTS:
White DOTS = Mild conditions
Yellow DOTS = Moderate conditions
Red DOTS = Extreme conditions
These DOTS update in real time as the candle is forming—appearing, disappearing, and shifting color based on current intensity levels. Once the candle closes, however, the DOTS do not repaint. This ensures clarity and confidence in every signal.
This is crucial, as many indicators repaint and revise data after the fact, undermining traders’ trust. With AlphaTrend, once a candle closes, the data remains permanently fixed.
📊 Adaptability and Market Insight
AlphaTrend adapts to any timeframe, but performs best on longer-duration candles, where signals are fewer but more reliable. Multi-interval displays (e.g., 1hr, 4hr, Daily) are highly recommended. It works very well on lower timeframes too. Excellent for day traders as well as swing traders.
The tool also integrates several intuitive market overlays:
Auto-generated support and resistance levels
Real-time supply and demand zones
Money flow tracking from institutions and banks
⚠️ FOMO Candles
FOMO stands for Fear of Missing Out—a key emotional driver in volatile markets. AlphaTrend identifies FOMO candles, which change color (customizable by the user) to indicate potential emotionally irrational buying or selling activity.
Although these conditions can persist short-term due to macroeconomic or geopolitical catalysts, they often lack sustainability. FOMO candles serve as an early warning system, signaling caution and highlighting potential trend reversals.
💰 Institutional Money Flow
AlphaTrend tracks the flow of money from major institutions and banks, highlighting when significant capital enters or exits the market. These flows appear as blue and yellow plots in the lower panel of the chart and help traders distinguish between moves driven by retail traders and those driven by “smart money.”
🔑 Key Features
✅ Dynamic Reversion Bands – Proprietary, real-time indicators that adapt to price behavior and highlight overbought/oversold conditions.
✅ Dynamic DOTS – Real-time visual indicators that shift based on buying/selling intensity. DOTS do not repaint after a candle closes.
✅ Multi-Timeframe Adaptability – Works across all timeframes. Longer durations provide more accurate, reliable signals. Multi-interval chart setups are recommended.
✅ Support & Resistance Mapping – Automatically identifies critical price levels (works with 5m, 15m, 30m, 1H, 4H, and custom intervals).
✅ FOMO Candles – Highlight emotionally driven price moves that often precede reversals.
✅ Supply & Demand Zones – Auto-populated zones that reinforce support and resistance areas.
✅ Institutional Money Flow Plots – Reveal whether major financial players are entering or exiting a trade.
✅ Universal Compatibility – Supports stocks, crypto, forex, and commodities.
✅ User-Friendly & Customizable – Plug-and-play design with extensive customization options.
🚀 How to Gain Access
📩 Reach Out to the Author: Visit our profile and send a direct message.
💳 Purchase & Unlock: After payment, DM the author your TradingView username + payment email. Access will be granted within 48 hours. Add to favorites and search for it in the invite-only section.
📈 Start Trading: Add AlphaTrend to your charts and you're ready to go!
Trade smarter, not harder — let AlphaTrend’s intelligent design give you the edge you need.
>>>>>>>>>>>>>>>>>
⚖️ Legal Disclaimer
By accessing or using the AlphaTrend stock indicator (“the Software”), you (“the User”) agree to the following terms:
Authorized Use:
The AlphaTrend indicator is intended for personal use only, specifically for trading stocks, commodities, or other financial instruments.
Restrictions on Use:
You may not reproduce, redistribute, sublicense, sell, or otherwise distribute the AlphaTrend indicator, its source code, or any derivative in any format or method—electronic, mechanical, or otherwise.
Legal Enforcement:
Unauthorized use or distribution constitutes a violation of intellectual property rights and is subject to civil and/or criminal penalties. The AlphaTrend creator reserves all legal rights and remedies.
By using the software, you affirm that you have read, understood, and agree to these terms.
📌 Risk Disclosure
Past performance is not indicative of future results. All investments involve risk, and there is no guarantee any strategy or indicator mentioned will be suitable or profitable.
Changing market conditions may render parts of this content outdated. This indicator is not a substitute for personalized financial advice. Please consult a qualified professional before making investment decisions.


Bullet007 CE/PE Algo StrategyFully automated algo indicator with entry exit, support resistance, long short .enjoy the automated trading with BUllet007algo indicator.
