USDSEK Price forecastingUSDSEK price action has completed two touches on a potential expanding formation whilst forming a structure within in the form of an ascending channel. The potential third touch on the ascending aligns with the potential third touch on he outer expanding structure..Will be watching price action closely for potential shorts .
USDSEK trade ideas

USDSEK: Bearish ABCD Visible on the MonthlyThis ABCD could be looked at as a bit of a double top too but i would target the C level for both in this short.

USDSEK - Let's sit & wait...USDSEK - Let's sit & wait...
Most favourite plan to do on the weekend is my weekend analysis. The market is close, going through higher TF, getting into the zone and ready to crush another week of trading!
USDSEK - Another trading pair I occasionally trade. I feel the behaviour of SEK is very interesting, i'd say I do trade relatively small on this pair but the risk/rewards are great. For now we are waiting for a break to either direction and this is a similar theme on all FX pairs I am looking at. When the market are these conditions I usually add alerts and perhaps limit orders.
Key Tip: Don't forget to follow your trade plan and if you don't have one MAKE ONE!
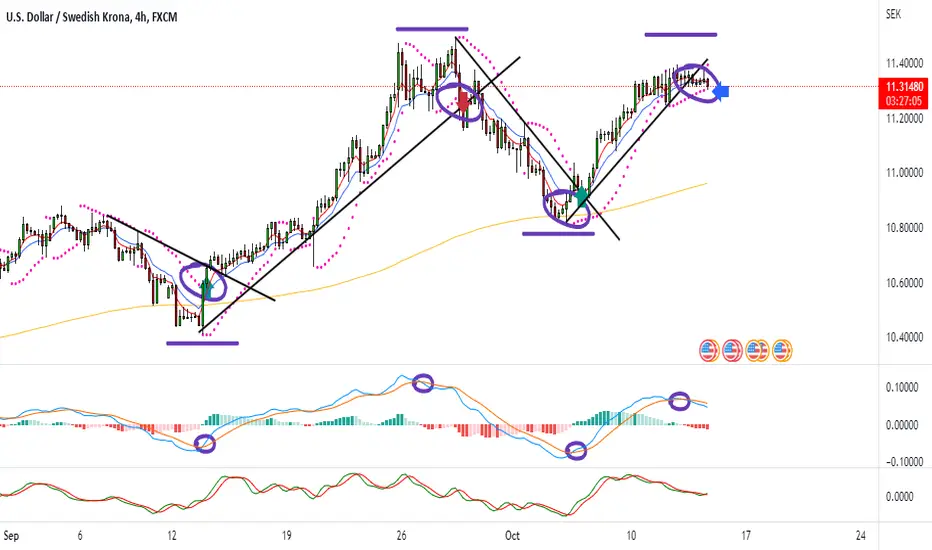
Trade Journal


short entryBearish
1.bearish trend
2.descending trend line as resistance
3.Broke major support
4.Bearish engulfing


USDSEK BULLISH REVERSAL WEDGE PATTERNUSDSEK Bullish Reversal Wedge Pattern formation. Entry on basis of breakage.

USDSEK bullish continuationHere we have a great zone in the RSI for accumulation of the long position. The blue box on the RSI has held since May 2021. Not fading this move yet. I predict bullish continuation for this chart. Perhaps the price will fall below support, but until we see a bearish regime change on the RSI, this trend continues.

long entryseries of HH and HL
formation of Bullish harami candle
indicates a new HL with a long entry

usdsek usdsek is going on taking support trendline now it get reject from its previous and ath high so lets seeeeeee

USDSEKThe market is creating LH and LL. Also the market is in a bearish trend with respect to daily timeframe.

Intelligent Trading Academy - USDSEK FX FTM H4 SELLFrom recent analysis we are seeing further weakness. We have HIGH IMPACT inflation data out in the US at 1:30pm today so expect extra volatility.
USDSEK On the most critical 7-year ResistanceThe USDSEK pair has been rising parabolically all year due to the well-known fundamental reasons empowering the USD amidst the high inflation. The price has finally reached though a technical level that we have to consider as it has been forming long-term tops over the past 7 years.
As you see on this 1W chart, the Resistance we are referring to is the Higher Highs trend-line that started after the April 13 2015 High. Every Higher High after that, was formed on every +0.5 Fibonacci extension (1.5, 2.5) and two weeks ago, the 3.5 Fib was reached and strongly rejected the price, again exactly on the Higher Highs trend-line.
However since last week, the price resumed the uptrend and is again about to test that strong Resistance cluster. As long as it closes below, it remains a good long-term sell opportunity. If fundamentals continue to have their way though, then this 7 pattern will be invalidated and buying will remain the only option, in which case the 4.5 Fib will be our target.
-------------------------------------------------------------------------------
** Please LIKE 👍, SUBSCRIBE ✅, SHARE 🙌 and COMMENT ✍ if you enjoy this idea! Also share your ideas and charts in the comments section below! This is best way to keep it relevant, support me, keep the content here free and allow the idea to reach as many people as possible. **
-------------------------------------------------------------------------------
You may also TELL ME 🙋♀️🙋♂️ in the comments section which symbol you want me to analyze next and on which time-frame. The one with the most posts will be published tomorrow! 👏🎁
-------------------------------------------------------------------------------
👇 👇 👇 👇 👇 👇
💸💸💸💸💸💸
👇 👇 👇 👇 👇 👇


Reversal set for last week’s worst performing pairs? USD/SEKBy the close of last week's trading session, the top 3 worst performing currency pairs came out to be the USD/PKR (-4.91%), NZD/USD (-2.61%), and USD/SEK (-2.04%).
To help determine the direction that these pairs will take this week, we will use the Hacolt Indicator (Vervoort Heiken-Ashi Longterm Candlestick Oscillator). Will the pairs continue to slide, or are they primed for a rebound in response to the huge selloffs?
The Hacolt Indicator helps to confirm the strength of trends. When the indicator presents green, the market is expected to trend upward, and when it is red, it is expected to trend downwards. It can also be used as a trend switch signal, suggesting a potential turnaround or a pullback on the current trend.
Starting with the USD/PKR, just like the USD/SEK, the Hacolt Indicator shows a green bullish signal. However, strong resistance at 240.00 created a double top formation on the daily timeframe, which resulted in last week’s downward move for the pair. The price may head towards 224.00 and even 217.50 if the Hacolt indicator gives a red bearish signal this week.
For the NZD/USD, the Hacolt Indicator, on the other hand, shows a red signal which indicates that the pair is still on a downtrend. The trading candle last Friday also ended closing below the 0.5626 support area, which may suggest that the price for this week for the NZD/USD would likely continue going down, potentially targeting the lows from March 2020 at 0.5469.
Lastly, the USD/SEK, and the Hacolt Indicator shows a green signal on the daily timeframe, possibly indicating that the uptrend is still in favor. This indication contrasts with the current downside move in the candles. If the Hacolt Indicator gives a bearish red signal this week, we might see the price retesting the 10.80 price level. A final target might be around the 10.45 support area. Overall, the trend is still bullish though, so look out for support formation in key psychological area around 11.00.

USD/SEK Short until new year at least1 hour short.
Maybe Im a little too early. But hey.
- USD might be over extended here.
- Seasonality
- Small heads and shoulder
Tight stop and see if it can break the smaller trend line and then carry on further down. The idea is that we will see some counter-trend move until new year.
Seasonally it can be a bit more risk on.


Intelligent Trading Academy - USDSEK FX FTM H4 BUYDollar bulls in charge can take this to new heights...............a long call is the way to go!

A short term traid on USD SEK. Head and Shoulder? I am long term bullish on USDSEK.
But might see a pullback soon with a head and shoulder forming + a trend line resistence.

USDSEK Pull-back in September but bullish long-termWe haven't updated the USDSEK pair for over 2 months and on the long-term it still looks bullish. This chart is on the 1D time-frame, where the price reached again the 2.5 Fibonacci extension as on the July 12 High. With the 1D RSI hitting the Lower Highs trend-line twice, which is the level where all price Highs have been made since November 24 2021, it is very probable that this is the new High of the current bullish sequence.
All Highs then pulled back to at least the 1D MA50 (blue trend-line), with the Buy Zone since November 10 2021 being within the MA50 and the 1D MA100 (green trend-line). The 1D RSI has again a Zone indicating where we can buy the pair after the pull-back is completed.
--------------------------------------------------------------------------------------------------------
** Please support this idea with your likes and comments, it is the best way to keep it relevant and support me. **
--------------------------------------------------------------------------------------------------------

USDSEK Bullish flag break out? The USDSEK has been in a bit of a tight range lately, but it looks like there could be a breakout coming. From a 4h chart perspective, the USDSEK looks like it could break out to the upside.
Could it be possible to go up to 10,90 or more from here?


USD/SEK Long from 61.8% Fibo and Dynamic Trendline | BUYThe USD/SEK comes from a Strong Uptrend where see the price harmonically makes Swing every time higher, following the Swing Trading strategy from the manual. In The last Period, the price after a Pullback on the 61.8% Fibonacci had a strong Bullish impulse and meanwhile the stochastic it's just exited from the oversold, and the RSI already in Bullish our clues are for a new Long setup looking at the price reaching around the value $11.00
