


Will History Repeat Itself? $580 Target For SPY By Early MayThe market has been in the doldrums since finding support after a nasty wave of selling that caused AMEX:SPY to decline by an additional 15% in a matter of days. Since we’ve been chopping around in this $65 range, we have seen some sharp swings both ways, but little sense of direction. i think tha

/
The best trades require research, then commitment.
$0 forever, no credit card needed
Photo: Jimmy Chin ©
Where the world does markets
Join 100 million traders and investors taking the future into their own hands.

Is Meta The Most Undervalued Stock In The Magnificent 7?In a recent post on key investment trends for the next decade, we highlighted the addictiveness and pervasiveness of social media as a critical long-term shift. Today, we're buying Meta Platforms NASDAQ:META which we believe represents an exceptional investment opportunity.
The Financials
META's

Bitcoin Cycle Update – Are We Nearing the Peak?Check out this BTCUSDT chart – we’re at GETTEX:92K today, and seems like things are heating up!
▸We’ve seen a Cycle Bottom in late 2022 - early 2023, followed by strong Bull runs in 2023 and 2024.
▸Those Consolidation phases (sideways channels) gave us the perfect setup for massive

GBPJPY Bullish Breakout – Watch for Momentum Towards 194.60GBPJPY has broken out of a descending wedge and is now retesting the breakout zone near 189.50–189.80. This area aligns with previous structure support and the wedge's upper boundary. Price action indicates bullish momentum is resuming.
🔑 Key Levels:
Current Price: 189.66
Breakout Level: ~189.50

VIX, the paroxysm of fear is behind us The international equity market suffered a bearish shock between the beginning of February and the beginning of April, against the backdrop of the trade war. The trade war known as “reciprocal tariffs” initiated by the Trump Administration caused the MSCI World stock index to fall by over 20%.
Now,

GOLD may enter accumulation when the market lacks impact Spot OANDA:XAUUSD prices were broadly steady in Asian trade on Friday (April 25) after a sharp rise in the previous trading day. The current price of gold is around $3,341/ounce, down from the $3,371 price target that readers noted in yesterday's edition. Spot gold prices jumped on Thursday, snapp


I am Slightly bullish BUT waiting for more dataFollowing the ideas from earlier in the week, I’m currently waiting on price action to give me more clarity. The market has been pushing higher for the past two days, and while there’s potential for a retracement, it could also be setting up for a continuation to the upside.
I’ll wait until the mar

Oil Short: Ending Diagonal and Rising WedgeI propose that Oil is a good short candidate because of what I am seeing:
1. Rising Wedge
2. Ending Diagonal within the Rising Wedge
I propose 3 entry points for shorting but mention that if you are shorting at the top of the trendline, to cater for false breakout, meaning more allowance in your st

Market Analysis: Gold Extends Record RunMarket Analysis: Gold Extends Record Run
Gold price started a fresh surge above the $3,250 resistance level.
Important Takeaways for Gold Price Analysis Today
- Gold price started a fresh surge and traded to a new record high at $3,384 against the US Dollar.
- A key bullish trend line is form

See all editors' picks ideas
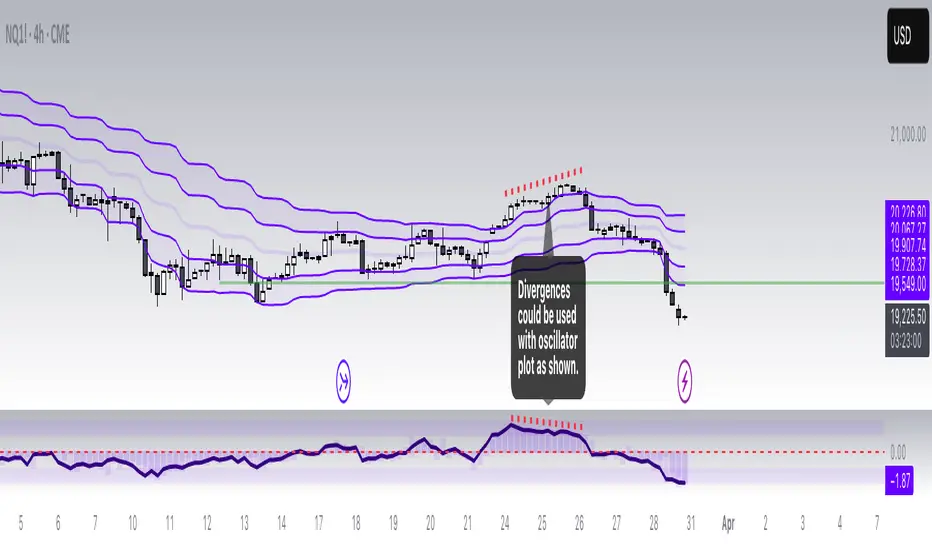
Elastic Volume-Weighted Student-T TensionOverview
The Elastic Volume-Weighted Student-T Tension Bands indicator dynamically adapts to market conditions using an advanced statistical model based on the Student-T distribution. Unlike traditional Bollinger Bands or Keltner Channels, this indicator leverages elastic volume-weighted averaging
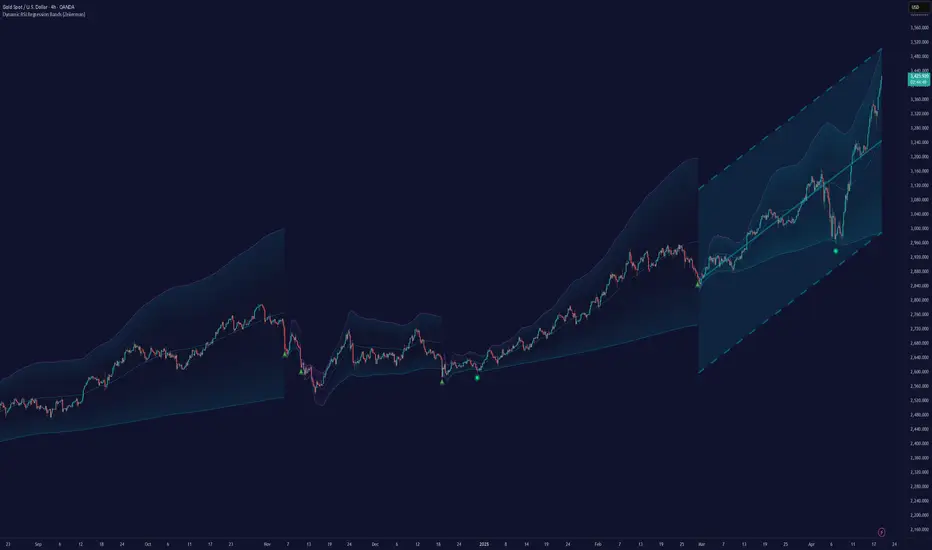
Dynamic RSI Regression Bands (Zeiierman)█ Overview
The Dynamic RSI Regression Bands (Zeiierman) is a regression channel tool that dynamically resets based on RSI overbought and oversold conditions. It adapts to trend shifts in real time, creating a highly responsive regression framework that visualizes market sentiment and directional
The Mayan CalendarThis indicator displays the current date in the Mayan Calendar, based on real-time UTC time. It calculates and presents:
🌀 Long Count (Baktun.Katun.Tun.Uinal.Kin) – A linear count of days since the Mayan epoch (August 11, 3114 BCE).
🔮 Tzolk'in Date – A 260-day sacred cycle combining a number (1–

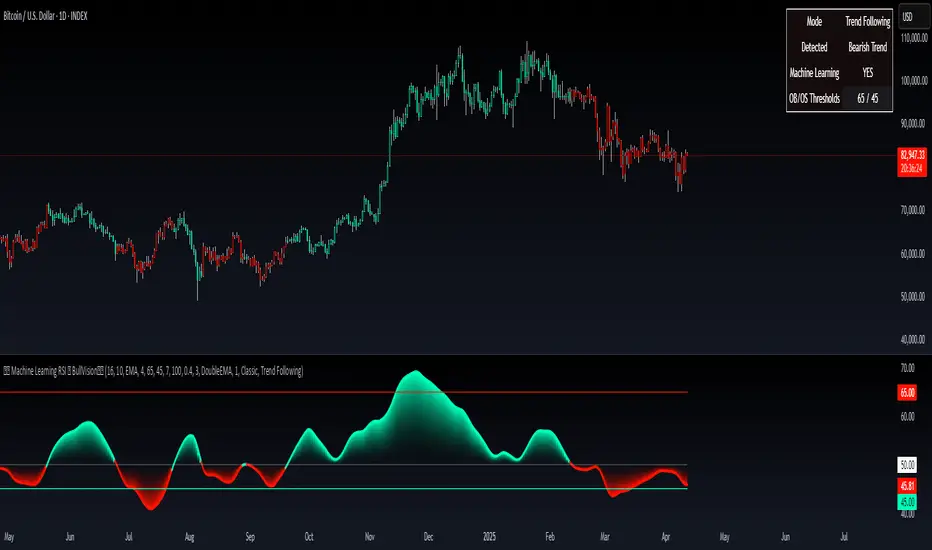
Machine Learning RSI ║ BullVisionOverview:
Introducing the Machine Learning RSI with KNN Adaptation – a cutting-edge momentum indicator that blends the classic Relative Strength Index (RSI) with machine learning principles. By leveraging K-Nearest Neighbors (KNN), this indicator aims at identifying historical patterns that resembl
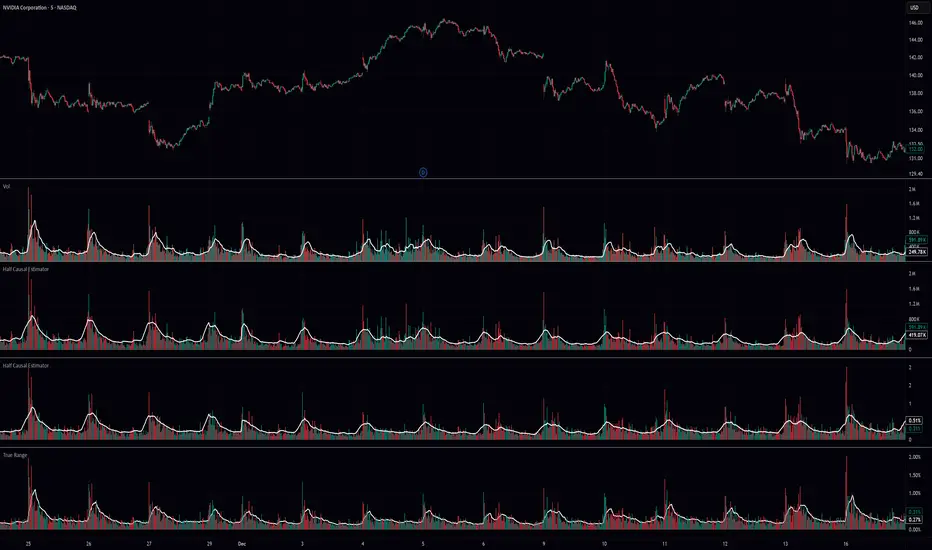
Half Causal EstimatorOverview
The Half Causal Estimator is a specialized filtering method that provides responsive averages of market variables (volume, true range, or price change) with significantly reduced time delay compared to traditional moving averages. It employs a hybrid approach that leverages both historica
BIN Based Support and Resistance [SS]This indicator presents a version of an alternative way to determine support and resistance, using a method called "Bins".
Bins provide for a flexible and interesting way to determine support and resistance levels.
First off, let's discuss BINS:
Bins are ranges or containers into which your

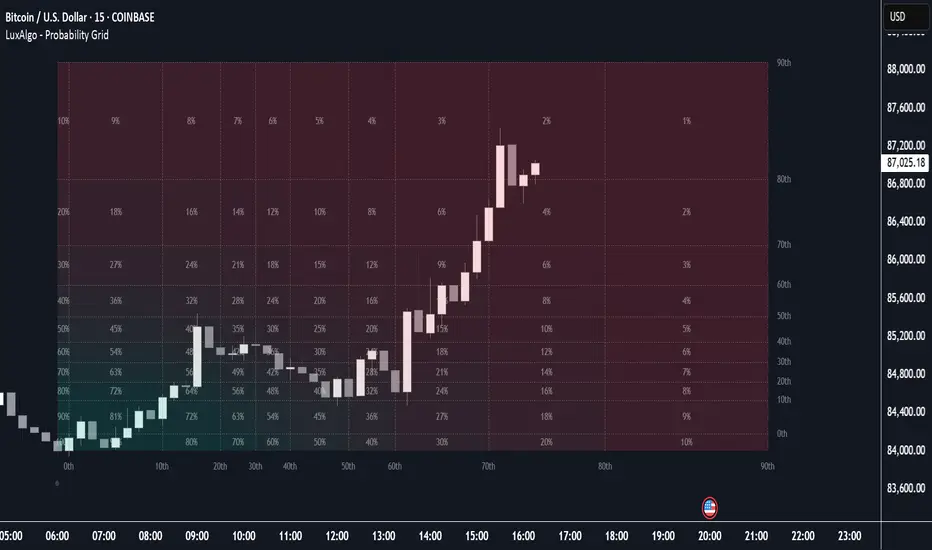
Probability Grid [LuxAlgo]The Probability Grid tool allows traders to see the probability of where and when the next reversal would occur, it displays a 10x10 grid and/or dashboard with the probability of the next reversal occurring beyond each cell or within each cell.
🔶 USAGE
By default, the tool displays deciles
Correlation Heatmap█ OVERVIEW
This indicator creates a correlation matrix for a user-specified list of symbols based on their time-aligned weekly or monthly price returns. It calculates the Pearson correlation coefficient for each possible symbol pair, and it displays the results in a symmetric table with heatmap

Tetris with Auto-PlayThis indicator is implemented in Pine Script™ v6 and serves as a demonstration of TradingView's capabilities. The core concept is to simulate a classic Tetris game by creating a grid-based environment and managing game state entirely within Pine Script.
Key Technical Aspects:
Grid Representation:

Log Regression Oscillator Channel [BigBeluga]
This unique overlay tool blends logarithmic trend analysis with dynamic oscillator behavior. It projects RSI, MFI, or Stochastic lines directly into a log regression channel on the price chart — offering an intuitive way to detect overbought/oversold momentum within the broader price structure.

See all indicators and strategies
News didn't load
Looks like that didn't go very well. Let's try again.
Community trends
WC: 27.46 Target: 1800-2400 MOASS: 47k-100K: LETS GO!GME is in a great position to RUN from a technical perspective
Since the April low, GME has seen price improvement of 30%+..right in line with our prediction that May/June will see MAJOR VOLUME and potentially EXPLOSIVE PRICE IMPROVEMENT (no crystal balls and no guarantees people..smh)
Will GME

$NVDA one more leg lower $58-76 targetNASDAQ:NVDA bounced off the lows at $86 but is now finding resistance, I think it's likely that we turn lower next week and start falling towards the targets below.
I think it's very likely that we make it down to the lower supports at $63-58 before we see a sustainable bounce form.
Let's see how

TslaKing of the Meme....
Abysmal quarter and guidance yet stock is holding 😆...
Keep it simple, I think tsla will test its 200ma this week at 291, from there we should see a reactionary pullback.. As long a 275 holds, then 315-318 is next up ..
Below 275 and 250 comes next ..
The full measure mo

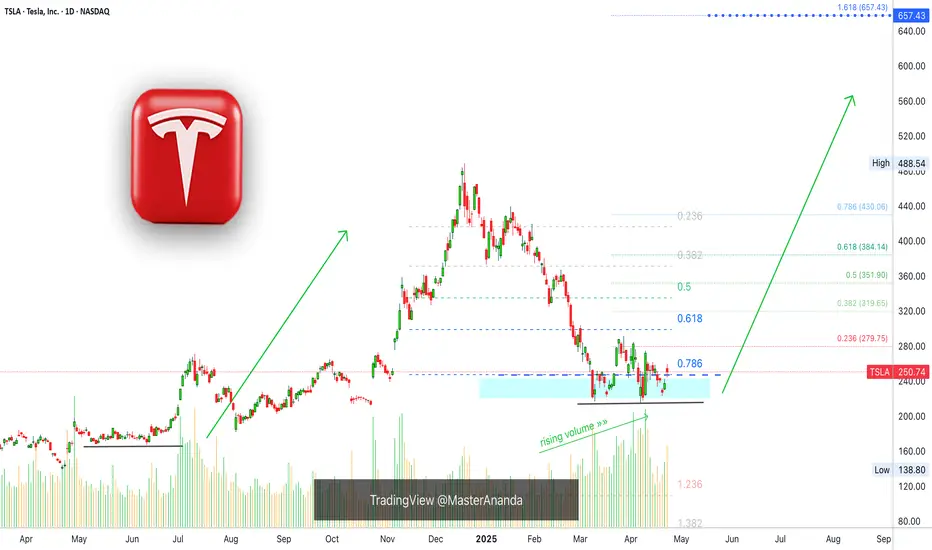
Tesla Finds Support, 657 Next Easy High & All-Time HighTesla is looking pretty good right now, support has been found. The correction amounted to -55.5%. It started in mid December 2024 and the first low was hit in March 2025.
Since March TSLA has been in the process of forming a bottom.
The action moved below 0.786 Fib. retracement level in relation

The Case for NVDA to 40As a prereq to this post it would be good to read my post on SMCI. In that I link to all the real time forecasts in SMCI of the methods we're using for the NVDA forecast.
And somewhat lay the groundwork for this post.
Click the post to read in full.
===#
So let's start with the big overview.

A Long-term Bullish Trend ?With an upcoming Earnings report we can observe rather uncertain future behavior.
But since the trend has been bearish for a longer period of time and the price is "nearly" at the same position which was achieved for the first time in early April in 2019, we can, mostly based only on the technical

LCID - Could Be About To EXPLODE!Technical work through of my bullish bias for LCID.
Enjoy 👍.
Not advice

TESLA Will Collapse! SELL!
My dear subscribers,
TESLA looks like it will make a good move, and here are the details:
The market is trading on 284.90 pivot level.
Bias - Bearish
My Stop Loss - 295.68
Technical Indicators: Both Super Trend & Pivot HL indicate a highly probable Bearish continuation.
Target - 265.94
Abou

Google stock oscillates below $170 after earnings releaseGoogle's stock managed to post a bullish gap of more than 3% in the last session, shortly after the company announced its quarterly results. Initially, it was reported that total sales for the last published quarter reached $90.23 billion, compared to the expected $89.12 billion. In addition, the co

See all stocks ideas
Tomorrow
RVTYRevvity, Inc.
Actual
—
Estimate
0.95
USD
Tomorrow
DPZDomino's Pizza Inc
Actual
—
Estimate
4.06
USD
Tomorrow
BKUBankUnited, Inc.
Actual
—
Estimate
0.75
USD
Tomorrow
ROPRoper Technologies, Inc.
Actual
—
Estimate
4.74
USD
Tomorrow
ARLPAlliance Resource Partners, L.P.
Actual
—
Estimate
0.50
USD
Tomorrow
FLICThe First of Long Island Corporation
Actual
—
Estimate
0.21
USD
Tomorrow
NOVASunnova Energy International Inc.
Actual
—
Estimate
−0.89
USD
Tomorrow
VFSVinFast Auto Ltd.
Actual
—
Estimate
−0.26
USD
See more events
Community trends
BITCOIN Breakout Confirmed - Is $106K the Next Stop?COINBASE:BTCUSD is displaying strong bullish momentum after breaking decisively above the key $90,000 level. This breakout occurred after a well-defined double bottom formed around the major support zone near $74,000. The inability to create a new low and the sharp rejection from that zone confirme

BTC - Golden Pocket Confluence + FVG Sweep = Long SetupA highly refined scenario blending Fibonacci confluence with liquidity principles, setting up a controlled bullish play.
---
1. Golden Pocket + FVG Confluence — Critical Demand Zone
The blue highlighted area represents a strong confluence:
- FVG (Fair Value Gap): Imbalance left by aggressive

TradeCityPro | Bitcoin Daily Analysis #73👋 Welcome to TradeCity Pro!
In this analysis, I want to give you a complete review of Bitcoin. There are just a few days left until the monthly candle closes, and it’s been a while since I analyzed higher timeframes for you, so it’s a good time to do that now.
📅 Monthly Timeframe
In the monthl

Bullish Crypto: Top Altcoins Choice —Your Pick (Session 4)You are back!
Are you back are you?
I am getting many new Altcoins requests so let's do a new Top Altcoins Choice session, Your Pick.
Look at this weekly Bitcoin chart, what do you see?
Today is Friday and the session is full green. The action is happening at the top of the candle.
» Can Bitcoi

XRP - Bulls Preparing to Push Towards $2.50XRP has maintained a bullish tone after completing a significant gap fill, currently consolidating around $2.18. The previous impulsive move left behind an unmitigated imbalance below, suggesting that the market could be preparing for a controlled retracement. The overall structure remains bullish,

BITCOIN → Consolidation or reversal? Why is $ 95000 important?BINANCE:BTCUSD held up quite strongly during the tariff war and largely weathered the storm, while the stock market and indices were in free fall. The improvement in the fundamental situation has once again heightened interest in the asset among traders and investors.
Earlier, I pointed out th

BITCOIN - Price can exit from wedge and rise to $100K levelHi guys, this is my overview for BTCUSDT, feel free to check it and write your feedback in comments👊
Some days ago price reached resistance line of triangle and then, in a short time, declined to $80300 level.
Price broke $92000 level and then some time traded inside triangle, where it reached thi

Ethereum (ETH/USDT) – Bullish Momentum Building Toward targetHello guys...
Ethereum has broken out of its long-term descending channel and is currently trading inside a smaller ascending channel, showing strong bullish momentum. After a "fake breakout" below major support around $1,400, ETH quickly reclaimed higher levels, suggesting a bear trap.
Currently,

SUI/USDT 26/04/2025 Analyzing trade!Hello guys this is my analysis on SUI/USDT I took a short breakout trade from the old range

Bitcoin: The Path To 109K Is Now Open.In my previous article I describe the potential breakout if 88K was compromised. I pointed out, the compound double bottom in the 74 to 78K area implied a greater probability of price breaking out, it was just a matter of catalyst. IF anything this possibility should have told you that swing trade s

See all crypto ideas
Bullish Setup on Gold: Correction hints continuation opportunityOANDA:XAUUSD is trading within a well-defined ascending channel, signaling strong bullish momentum. The price has consistently formed higher highs and higher lows, which aligns with the continuation of the uptrend. The recent pullback appears to be a healthy correction within the overall uptrend ,

GOLD - Price can continue to move up inside rising channelHi guys, this is my overview for XAUUSD, feel free to check it and write your feedback in comments👊
Long time price rising near the support line, but later it made a correction movement, breaking this line.
Then price had a sharp impulse that confirmed bullish structure and started to grow inside

GOLD(XAUUSD) -Weekly Forecast,Technical Analysis & Trading IdeasMidterm forecast:
2772.38 is a major support, while this level is not broken, the Midterm wave will be uptrend.
TVC:GOLD OANDA:XAUUSD
Technical analysis:
A trough is formed in daily chart at 2956.50 on 04/07/2025, so more gains to resistance(s) 3357.00, 3500.00 and more heights is expecte

GOLD 1H CHART ROUTE MAP & TRADING PLAN FOR THE WEEKHey Everyone,
Please see our updated 1h chart levels and targets for the coming week.
We are seeing price play between two weighted levels with a gap above at 3344 and a gap below at 3306. We will need to see ema5 cross and lock on either weighted level to determine the next range. EMA5 is laggin

XAUUSD COT and Liquidity AnalysisHey what up traders welcome to the COT data and Liquidity report. It's always good to go with those who move the market here is what I see in their cards. I share my COT - order flow views every weekend.
🎯 Non Commercials reduced their longs exposure by more then 50K. Its seem to me like the momen

GOLD → A false breakdown of support will lead to growthFX:XAUUSD is trading within the range of 3370-3270. Since the opening of the session, the price has lost its potential for further decline. There is no news on Friday, so after retesting the liquidity and support zone of 3283-3270, the price is likely to return to growth.
Gold stabilizes near

Gold (XAUUSD) 4H Chart AnalysisGold (XAUUSD) 4H Chart Analysis – Textbook Reversal Setup Unfolding 📈✨
Traders, let's break down what's happening on the Gold 4-hour chart right now because this is a very high-probability setup you’ll want on your radar.
🧠 What We're Seeing:
After a strong bullish rally, Gold topped around $3,50

(XAU/USD) 1H Chart: Long Setup Targeting 3,500 with Key Support Entry Point: Suggested near 3,301.51 USD (marked with the purple support zone).
Stop Loss Zone: Below 3,266.87 to 3,221.67 USD (marked in blue and purple). This is where you limit your loss if the trade goes wrong.
First Target (Target Point One): 3,376.65 USD.
Final Target (EA Target Point): 3,5

#XAUUSD: We are up 1040+ pips from our previous setup! Gold has risen from 3268 to 3364, helping us make substantial positive gains. However, after reaching the $3364 region, the price dropped around 3310 and has since been fluctuating between 3310 and 3340, making it challenging to trade. There’s a possibility that the price might touch 3400 once again

XAU/USD SIGNAL ANALYSIS LONG SETUP | GO AND CHECK THE CAPTIONHello dear Traders 👋
XAU/USD Trading Signals Technical Analysis Setup 👇
• Trade Setup 📈
📊 • Entry Zone: 3,310 – 3,320
🔺 • Take Profit 1 (TP1): 3,340
🔺 • Take Profit 2 (TP2): 3,350
🔺 • Take Profit 3 (TP3): 3,366
⭕ • Stop Loss (SL): 3,290
Technical Analysis Setup:
• Strong bullish reaction from key

See all futures ideas
EURUSD - Bullish Shift after IFVG? This chart outlines a clean sequence of bullish intent where institutional accumulation is visible through structure, inefficiency, and reactive zones.
---
1. Support Zone Holds — Demand Confirmed
The previous resistance area has now clearly flipped into support , marked by multiple wicks reje

#EURUSD: Our Last Trade Mitigated Early, Now Swing Trade Active?EURUSD, in our previous recommendation, advised everyone to sell swing trades. However, the price was mitigated by a narrow margin. The DXY index suggests further price growth in the coming weeks. Please ensure you manage your risk while trading. This is our concept only and does not guarantee the m

GBPCHF - Bull No More!Hello TradingView Family / Fellow Traders. This is Richard, also known as theSignalyst.
📈From a medium-term perspective, GBPCHF has been bullish trading within the rising channel marked in blue.
This week, GBPCHF has been approaching the upper bound of its channel.
Moreover, the red zone around

EUR/USD Bearish Setup Targeting Key Support Levels | 2H Chart AThe EUR/USD pair is currently trading around 1.13619 on the 2-hour chart. After a period of consolidation, the price appears to be weakening below a key horizontal support zone.
If the current level fails to hold, we could see a strong bearish move targeting the next supports at 1.11955, 1.10380, a


“GBP/USD in Danger! Massive Drop Near Key Resistance!”GBP/USD is fast approaching a massive resistance zone (1.3550 – 1.3650) and showing clear signs of bullish exhaustion.
All technical indicators are flashing warning signals for a potential sharp drop!
Fundamental Drivers:
• UK’s economy is struggling under persistent inflation pressures.
• The Fe


EURUSD 4H EUR/USD Analysis
In the previous analysis , the market movement was predicted with high precision, and the market moved exactly according to the forecast.
However, surprisingly, it did not receive the attention it deserved.
Now, the market has reached a level where, similar to gold, many participa

GBPUSD COT and Liquidity AnalysisHey what up traders welcome to the COT data and Liquidity report. It's always good to go with those who move the market here is what I see in their cards. I share my COT - order flow views every weekend.
🎯 Non Commercials added significant longs and closed shorts at the same time. So for that reas

NEXT WEEK EURUSD ANALYSIS SIGNAL UPDATE > GO AND READ THECAPTAINBaddy dears friends 👋🏼
(EURUSD) trading signals technical analysis satup👇🏼
I think now (EURUSD) ready for(SELL)trade ( EURUSD ) SELL zone
( TRADE SATUP) 👇🏼
ENTRY POINT (1.13650) to (1.13600) 📊
FIRST TP (1.13350)📊
2ND TARGET (1.13000) 📊
LAST TARGET (1.12750) 📊
STOP LOOS (1.13950)❌
Ta

See all forex ideas
| EUR | USD | GBP | JPY | CHF | ||||
|---|---|---|---|---|---|---|---|---|
| EUR | - | - | - | - | - | - | - | |
| USD | - | - | - | - | - | - | - | |
| GBP | - | - | - | - | - | - | - | |
| JPY | - | - | - | - | - | - | - | |
| CHF | - | - | - | - | - | - | - | |
| AUD | - | - | - | - | - | - | - | |
| CNY | - | - | - | - | - | - | - | |
| CAD | - | - | - | - | - | - | - |
Trade directly on the supercharts through our supported, fully-verified and user-reviewed brokers.


