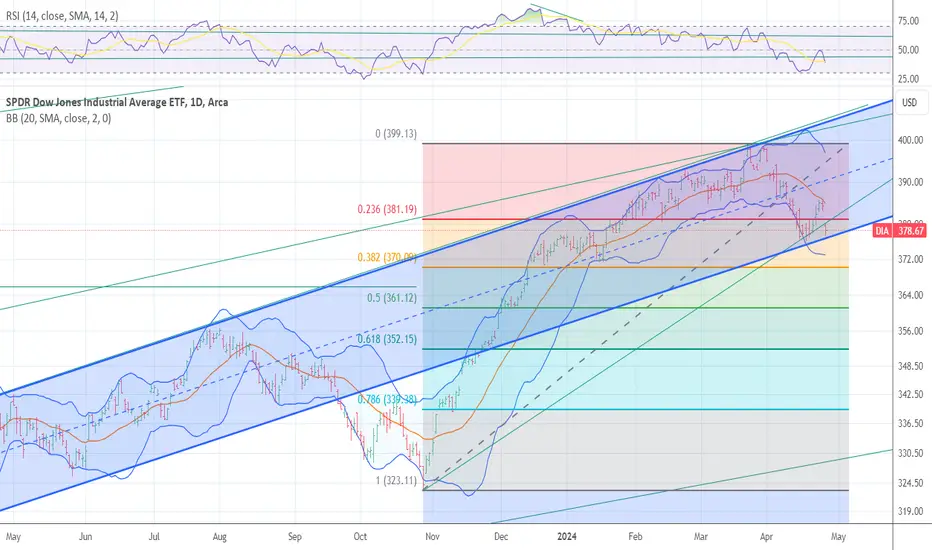
QQQ - Bull, < 1WInstrument: QQQ
Direction: Long
Time Frame: 1W
Upper Target: 100DSMA
Lower Stop: ~413 (New Rel Low)
Reference Weekly Monday Journal for basis.
ETF market

Looking for 515 if money flow breaks outPrice action needs to breakout of the descending wedge/triangle. If AD and money flow continues to rise and breakout of resistances spy can head to 515 level

Ibit bullish supply zoneI think here ibit its very bullish from here but also its too much risky anyway this with Hong Kong etf maybe can force the market price to go up

SPY just has a small gap to fill, then it's Chocolate Bananas!Before the massive sell off, SPY just had a small gap that needs attention. Then, plop plop plop. Chocolate Banana time

This is why I am taking on long calls the channel The chart posted is in a well defined channel that is parallel we are now retesting it . if we were to Break it . that would be BAD thing . But if we break it and close back above that that would be a GOOD thing .We had the Vix cycle peak come in within 1.5 days of the 4/15/4/17 and we are setting up for Moves in Both directions . Trade it this way
TLT to $86 and 20 year yield to 5.2% by 5/3/24?TLT to $86 and 20 year yield to 5.2% by 5/3/24? I think the current break out by long bonds into the 5%'s has enough momentum to take the 20 year to 5.2% and TLT to $86. Bought into TMV on 4/24/24 and will hold until we reverse. The PCE report on 4/26/24 will confirm this move or invalidate it.

SPY THIS WEEK OUTLOOKI will go short if we reject at around 520-521
Spy is out of its channel range and will try to reclaim it today.
If we break above it and retest it, then its a short term long.
If rejected and stays below 520-521 then its bearish to 516, 512, 490
the correction to 490 will come, just don't know when.

nasdaq gains mopped up and retracingi really like sqqq for reliable intraday swings that involve a sell heavy market that is retracing to highs. the environment in this index and risk assets such as in tech make sqqq an attractive play on this timeframe where a large inverse gain from a gap down in the underlying asset has faded into consolidation in the intermediate term.

$SPY Does it Need a Bigger Correction?I have zoomed out to larger timeframes on AMEX:SPY to come up with some larger / longer timeframes. Here is what I started with; the weekly chart (shown) then zoomed out to the Monthly Chart (not shown) to draw the February 2009 trendline. I came back to the weekly to find the March 2020 trend. I then looked that the latest run starting in October 2023. That trend line is almost parabolic and was unsustainable.
I am not making any prediction here, but it would be prudent to have a plan for a larger correction. I have horizontal lines near the top of the chart that were drawn using the daily chart and it is possible that one of them (or none) could be support areas. It is all to be determined. Keep an open mind. Corrections can happen in price or time or a combination of both.
I would like to point out that on any of the charts that I post I am only correct about 50% of the time. My posts are more about self-accountability than anything else. However, I do hope that you find some value in the technical aspect of the posts.
Thanks for looking.

QQQ Scalping Zones 4/25Premarket levels have been working pretty good. Come join the team and bank!!
Upside Targets:
*419.98 - 421.07 - 422.90
Downside Targets:
*418.55 - 417.29 - 415.22
Daily Trend Tracker
*DXY - Bullish - *VIX - Bullish - *US10Y - Bullish

SPY My Opinion! BUY!
My dear friends,
My technical analysis for SPY is below:
The market is trading on 495.10 pivot level.
Bias - Bullish
Technical Indicators: Both Super Trend & Pivot HL indicate a highly probable Bullish continuation.
Target - 505.99
About Used Indicators:
A pivot point is a technical analysis indicator, or calculations, used to determine the overall trend of the market over different time frames.
———————————
WISH YOU ALL LUCK

Does ARK Innovation Have Downside Risk?The ARK Innovation ETF has chopped in a range for the last two years, and some traders may expect a push back to longer-term lows.
The first pattern on today’s chart is the rounded top in February and March. It was slightly below the peak of December 2023. The lower monthly high may suggest bears remain in control over the longer term.
A sharp drop in early April followed the topping pattern. That may add to the possibility of sellers taking control.
Second, Wednesday’s bounce retraced about half the decline. A lower high at this spot could confirm a downward move has begun. Prices also stalled at the February 5 low. Has old support become new resistance?
Next, ARKK is back below its 200-day simple moving average.
Finally, MACD has been falling.
Standardized Performances for ETF mentioned above:
ARK Innovation ETF (ARKK):
1-year: +24.2%
5-years: +1.97%
Since Inception: +11.35%
(As of March 28, 2024)
Performance data shown reflects past performance and is no guarantee of future performance. The information provided is not meant to predict or project the performance of a specific investment or investment strategy and current performance may be lower or higher than the performance data shown. Accordingly, this information should not be relied upon when making an investment decision.
Exchange Traded Funds (“ETFs”) are subject to management fees and other expenses. Before making investment decisions, investors should carefully read information found in the prospectus or summary prospectus, if available, including investment objectives, risks, charges, and expenses. Click here to find the prospectus.
TradeStation has, for decades, advanced the trading industry, providing access to stocks, options and futures. See our Overview for more.
Past performance, whether actual or indicated by historical tests of strategies, is no guarantee of future performance or success. There is a possibility that you may sustain a loss equal to or greater than your entire investment regardless of which asset class you trade (equities, options or futures); therefore, you should not invest or risk money that you cannot afford to lose. Online trading is not suitable for all investors. View the document titled Characteristics and Risks of Standardized Options at www.TradeStation.com . Before trading any asset class, customers must read the relevant risk disclosure statements on www.TradeStation.com . System access and trade placement and execution may be delayed or fail due to market volatility and volume, quote delays, system and software errors, Internet traffic, outages and other factors.
Securities and futures trading is offered to self-directed customers by TradeStation Securities, Inc., a broker-dealer registered with the Securities and Exchange Commission and a futures commission merchant licensed with the Commodity Futures Trading Commission). TradeStation Securities is a member of the Financial Industry Regulatory Authority, the National Futures Association, and a number of exchanges.
TradeStation Securities, Inc. and TradeStation Technologies, Inc. are each wholly owned subsidiaries of TradeStation Group, Inc., both operating, and providing products and services, under the TradeStation brand and trademark. When applying for, or purchasing, accounts, subscriptions, products and services, it is important that you know which company you will be dealing with. Visit www.TradeStation.com for further important information explaining what this means.

Hi! It's been a while :)In the last few years, I got hit by a car while riding my motorcycle, graduated uni, and visited Korea for the first time in a decade. So, nothing much.
(>Blog, feel free to skip this part.)
I barely had time to breathe, so I liquidated everything and completely exited the market (and bought a used Porsche). But I always missed trading (and making money), and my long break had me deep in FOMO.
I never stopped charting, but never found anything fun enough to write about. NVDA up, TSLA down, etc. The usual. My friends loved making money off my charts, but it wasn't nearly as exciting as it used to be.
But as I took a look back on my charts today, I felt proud of my more recent predictions - and horribly embarrassed at my old posts. I'm still young, but I cringe at the younger me. He did his best, but he was still growing. He was so sure. So haughty. So... stupid.
The more I learn, the more I realize I don't know; and that nobody around me knows either. It's a bit crushing. The people who do know keep it all to themselves, and there are NEVER free lunches. But with a bit of dumb luck and a whole lot of courage, the stock market still feels a little less casino and a little more Glengarry Glen Ross.
Anyways, back to the stocks.
www.newtraderu.com
You have to admit, it's a little similar, isn't it? Those who are familiar with this image probably remember it from 2016~17 when it was shared quite frequently online, long before trading became popularized via RH/BTC/GME.
This pattern is visible in quite a lot of stocks. I've seen it time and time again. Now that you've seen it, you'll see it everywhere as well. I chose an ETF, to show that even in a diversified and actively managed portfolio, this pattern is still present. It's pure market psychology, and it's scarily accurate. Only if the cheat sheet showed what happened after... what a shame.
But we do know. Refer to BITSTAMP:BTCUSD .
I missed this. Thanks for reading my obnoxiously long post.
ark-funds.com
might be useful to you if you want to see more examples.

✏️ Weekly Report: Weak Bounce & Weak $META MARKET OVERVIEW
A weak bounce in the market this week, which lifted stocks modestly off their lows though most stocks are struggling to recover a significant portion of their recent losses.
Tonight, Meta Platforms ( NASDAQ:META ) is adding more downside pressure on growth stocks after it announced weak guidance numbers and the stock collapsed $75 lower in afterhours trading.
Let’s start the charts with Nasdaq-100 above (QQQ)
––––––––––––––––––––––––––––––––––––––––––––––––––––
NASDAQ:META
NASDAQ:SMTC
Constructive pattern. Closed just above the $33 buy point, however I would like to see more volume pick up from here.
NASDAQ:MSFT
The stock needs strong earnings today to get past $431 would be a place to open a position. However, slicing through the support level at $395 is a sell short point for aggressive traders
GOOGL
Massive weekly Cup with Handle base. Earnings are coming today. Technical buy place is $160.25 if earnings are good and we have good volume.
NASDAQ:KLAC
This company reports earnings tomorrow. A move above the $687 is a buy point. However, weak earnings below $680 is a logical short.
NASDAQ:NVDA
Bounced to the 50D SMA (red) and turned down. Aggressive play for the intraday traders is a move over the $880 on a strong volume.
NYSE:GS
GS is just a little bit extended over the proper buy point. If the market starts rallying this could be a good short trade. I would be extra tight with stops here (around $414 level) if I was to play this.
BINANCE:BTCUSD
Bitcoin is performing a tight pivot. Over the blue line is a technical buy point (if we have good volume too)


For the doomsday peopleYeah, I could see it. Dunno if it'll happen, but I definitely see it.
Good setup for a pullback in the least. Given how Feds are at the moment, what stops a crash?

xlu
#xlu AMEX:XLU Utilities are starting to rotate, moving opposite to AMEX:SPY #spy #trader #investor #stockmarket

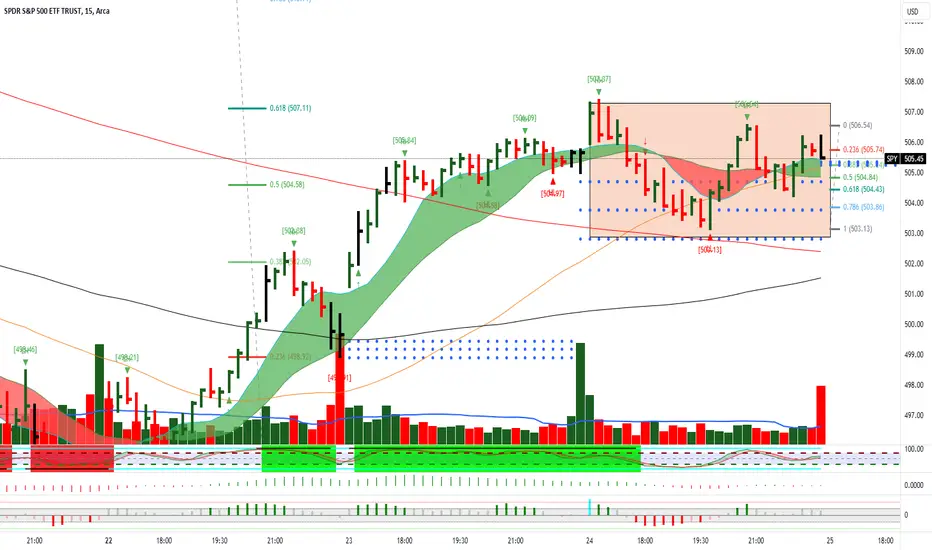
$SPY April 25, 2024AMEX:SPY April 25, 2024
15 Minutes.
As expected, AMEX:SPY managed to hold 502 levels.
Foe the day holding 504 levels I expect 507 to cross towards 510 levels as initial target.
If 504 is broken on downside I expect 501-502 as target. So, I feel not much worth shorting today.
Based on opening 15 minutes today should be a trending day one sided.
Moving averages have converged.
How ever I will go long only above 514-515 levels.
SMH: Ain't over till its overThis is a follow-up on my Mar 9 post on NASDAQ:NVDA and I feel using the NASDAQ:SMH would explain overall market picture better. I struggled with how to frame this post as it is a combination of zooming into lower fractals and zooming out to higher fractals and hope this weekly chart helps.
In the immediate short-term, markets are oversold and you can spot the ABCD down completions in the 30M fractal. This is likely to be a short-term bounce into week end, month end to test 30M overhead neckline resistance.
In the weekly and daily chart, the overhead neckline resistance can be seen as the white dotted overhead resistance (representing extreme price volume action). Big picture wise, there are multiple ABCD completions for the SMH and its key component stocks which implies we should look at the Nov'21 to Oct'22 downturn guide the downside projection.
This would imply a downside projection to c.$164 with the $224 level as an invalidation level.

$TLT - Trade of the decade. NASDAQ:TLT runs inverse to the 10YTreassury note. The gap just below $85 should be filled when the 10Y goes back to 4.9%. When the gap closes and yields come back down, NASDAQ:TLT will be the place to park your money... NFA.

Ok, time to draw some pretty picturesWhy can't we just go higher from here? Everybody seems so negative -- and indeed I'm more neutral than bullish right now but $480 is just as possible as $530 and we really just have to wait out earnings season to see which way we get smacked first. I was bullish (then netflix happened) then bearish (then explosions over the weekend) then bullish (then people seem to be selling on any good news) so now bearish leaning again (in the short term). But the fact remains that there were rumors we were going to get another rate hike and so any rallying last thurs/fri faded downward, but though things haven't been great this week, I think it's fair to say most people aren't worried we'll get a rate hike in July anymore.
It's pretty terrible long term though -- we could actually succeed in a soft landing. But we could also crash. And equally likely but unknown until recently, we could just have stagflation for a while. Things are kind of weird right now and wall st seems nervous to get excited about anything. But I think for the common man, recession is off the table.
A lot of caution, please.

$KWEB - Breaking out!AMEX:KWEB A convincing descending wedge breakout on KWEB. This will lift NYSE:BABA NASDAQ:JD NASDAQ:PDD $BIDU.
Targets:
$32
$36
Risk:
$24

QQQ Forecast!QQQ has made the similar pattern to 2023, and 2021 which increases the risk of more correction!
Which scenario is more likely to happen???
