BUY spx500 set upWaiting for the market to break out of the zone again. currently on the 1hr/4hr we are seeing a double bottom set up so once it breaks out of the zone that is our final confirmation for the bull run.
Market indices

EGX30 - Indecisive MovesAfter the completion of the corrective move in 1-may-24, the market made its 1,2 waves.. but wave 3 wasn't impulsive as usual and failed to reach 1.618 (as of today) and due to low price movements and poor price action, we could be on the verge of forming complex correction (ABC - WXY) move
breaking the divergence of the line drawn with the RSI and reaching 1.618 of wave 1, means we will continue the upward movement, however; falling further and lower volume proves the formation of complex correction move.

BANK NIFTY INTRADAY LEVELS FOR 30 MAY 2024BUY ABOVE - 48660
SL - 48540
TARGETS - 48860,49050,49290
SELL BELOW - 48400
SL - 48660
TARGETS - 48250,48110,47990
NO TRADE ZONE - 48400 to 48660
Previous Day High - 49050
Previous Day Low - 48400
Based on price action major support & resistance's are here, the red lines acts as resistances, the green lines acts as supports. If the price breaks the support/resistance, it will move to the next support/resistance line. White lines indicates previous day high & low, high acts as a resistance & low acts as a support for next day.
Trendlines are also significant to price action. If the price is above/below the trendlines, can expect an UP/DOWN with aggressive move.
Please NOTE: this levels are for intraday trading only.
Disclaimer - All information on this page is for educational purposes only,
we are not SEBI Registered, Please consult a SEBI registered financial advisor for your financial matters before investing And taking any decision. We are not responsible for any profit/loss you made.
Request your support and engagement by liking and commenting & follow to provide encouragement
HAPPY TRADING 👍

NIFTY INTRADAY LEVELS FOR 30 MAY 2024BUY ABOVE - 22760
SL - 22700
TARGETS - 22800,22850,22900
SELL BELOW - 22700
SL - 22760
TARGETS - 22640,22590,22550
NO TRADE ZONE - 22700 to 22760
Previous Day High - 22850
Previous Day Low - 22700
Based on price action major support & resistance's are here, the red lines acts as resistances, the green lines acts as supports. If the price breaks the support/resistance, it will move to the next support/resistance line. White lines indicates previous day high & low, high acts as a resistance & low acts as a support for next day.
Trendlines are also significant to price action. If the price is above/below the trendlines, can expect an UP/DOWN with aggressive move.
Please NOTE: this levels are for intraday trading only.
Disclaimer - All information on this page is for educational purposes only,
we are not SEBI Registered, Please consult a SEBI registered financial advisor for your financial matters before investing And taking any decision. We are not responsible for any profit/loss you made.
Request your support and engagement by liking and commenting & follow to provide encouragement
HAPPY TRADING 👍

Sine Curves and NasdaqSharing a quick chart art analysis of sine curves over the Nasdaq.
If this kind of pattern continues, we should see the start of a sideways move over to the second half of the sine curve after which, the move to the top continues. If the pattern holds true, we can expect a retracement in the 40% to 30% range sometime in an 18 month timeline.
Short and BTFD on the transition across during the Summer
Long in the Autumn for the final leg up
Note that the first two sine curves complete on a 2 year schedule and are part of a similar inflation regime. This current sine curve looks set to extend to 4 years with significant inflationary attributes.
I think this is interesting because it is not a click bate doom scenario nor is it a full guns blazing BTFD scenario.
Anyhoo... it's chart art. Take it for what it is.

SPX500, a new ATH?! After finding a new ATH on Thursday May 23, the price of the S&P500 fell by 2%.
I remain long on the SPX500.
A nice bullish setup has taken shape:
Back in the OTE zone
Rebound on H1 Order Block
I think a new ATH is quite feasible over the next few days/weeks.
Feel free to subscribe and put a boost on this post if you enjoyed my analysis, and tell me what you think!
Happy trading and a great week :)

BANKNIFTY: Trading Plan for 30-May-2024
Gap Up Opening:
If BANKNIFTY opens above 48,600 and sustains this level for the first trading hour, traders should consider buying with a stop-loss at 48,500, targeting 48,975-49,043. If prices do not sustain the opening level and break the last session's low, expect a drop to 48,272-48,216.
Flat Opening:
For a flat opening, if prices face resistance at 48,562 and trade lower, targets would be 48,300-48,272-48,216. Conversely, if BANKNIFTY trades above 48,600 and finds support at 48,550, closing any hourly candle above 48,600 without breaking the previous low, it can target 48,757-48,975-49,053.
Gap Down Opening:
In the event of a gap down opening below 48,450, prices may initially drop to 48,272-48,216 and find support, potentially leading to a bounce back. If support fails and prices drop further, buyers may participate at 48,077-47,914. On the other hand, if prices quickly regain 48,550 and sustain, expect a bounce back towards 48,757 and potential sideways trading, with further targets at 48,975-49,053 above 48,770.
Conclusion:
Key levels (48,600, 48,562, 48,450) should be monitored closely with adherence to price action signals. Applying stop-loss strategies will help manage risk effectively.
Disclaimer:
This plan is for educational purposes and should not be considered financial advice. Market conditions can be highly volatile, and traders are encouraged to perform their own analysis and consult with a professional financial advisor before executing any trades.

Dollar BULLISH from the DAY TRENDLINE!!!!!!!!!!????1.Dollar retested exactly from the Day trendline.
2.If this support line broken we may dollar free fall from 104 to 103 nearly thousand pips.
3.According weekly timeframe dollar is still bullish, for a confirmation it has to break the previous resistance and consolidation.
4.Both the supports and resistance need more volume to break. I hope upcoming weeks news will impact the dollar and decide the direction.

NIFTY: Trading Plan for 30-May-2024
Gap Up Opening:
If NIFTY opens above 22,750 and sustains this level for the first trading hour, it is likely to target 22,816-22,834. Resistance may be encountered at these levels, leading to sideways trading. Should the price trade above 22,834, a sharp upward movement towards 22,897-22,900 can be expected. However, if the price fails to sustain the gap up and trades below 22,700, support is likely near 22,669-22,650, from where an upward move could resume.
Flat Opening:
In the event of a flat opening, if NIFTY sustains above 22,700 without breaking the previous session's low of 22,685, a buying opportunity is present with a stop-loss at the low for targets of 22,816-22,834. Fresh short trades should be considered only if the price starts trading below 22,669 after rejection at 22,700, with downside targets of 22,572-22,539.
Gap Down Opening:
Should NIFTY open below 22,650, a short trade can be considered if the price action confirms rejection at 22,700, targeting 22,572-22,539. If the price falls below 22,500, further downside to 22,314 may occur. Buying is recommended only if NIFTY regains the 22,700 level and sustains for a few hourly candles above this range.
Conclusion:
Traders should carefully monitor key levels (22,750, 22,700, 22,650) and react based on price action confirmations. Implementing strict stop-loss measures is crucial to manage risk.
Disclaimer:
This plan is for educational purposes and should not be considered financial advice. Market conditions can change rapidly, and traders are advised to conduct their own analysis and consult with a professional financial advisor before making any trading decisions.

DOW JONES: Correction completed. Time for a new High.Dow Jones may have turned red on its 1D technical outlook (RSI = 35.469, MACD = -17.010, ADX = 38.217) but it is only neutral on 1W (RSI = 52.498) suggesting that on the long run, these are strong buy levels from a R/R perspective. Two weeks ago we called the current pullback to 38,550 as a possibility but now it is time to turn bullish again. As you can see, on the 1W timeframe, there are striking resemblances with the Channel Up of March 2023 and in today's terms we are on the May's 2023 corrective wave. We expect at least a +13.67% rise from the recent bottom and our target sits slightly under that level (TP = 42,000).
See how our prior idea has worked out:
## If you like our free content follow our profile to get more daily ideas. ##
## Comments and likes are greatly appreciated. ##

J225 - BUYJ225 Moving in Bullish Parallel Channel with making HH and HL at 4H TF.
Price is at lower trend line of Channel and Fib 79% completed here.

Copy //@version=4
study("Custom MA Crossover Indicator with 100 Point Target", shorttitle="MA Crossover w/ 100pt Target", overlay=true)
// User-defined input for moving averages
shortMA = input(10, minval=1, title="Short MA Period")
longMA = input(100, minval=1, title="Long MA Period")
target_1 = input(50, minval=1, title="Target_1")
target_2 = input(100, minval=1, title="Target_2")
// User-defined input for the start and end times with default values
startTimeInput = input(12, title="Start Time for Session(UTC, in hours)", minval=0, maxval=23)
endTimeInput = input(17, title="End Time Session (UTC, in hours)", minval=0, maxval=23)
// Convert the input hours to minutes from midnight
startTime = startTimeInput * 60
endTime = endTimeInput * 60
// Function to convert the current exchange time to UTC time in minutes
toUTCTime(exchangeTime) =>
exchangeTimeInMinutes = exchangeTime / 60000
// Adjust for UTC time
utcTime = exchangeTimeInMinutes % 1440
utcTime
// Get the current time in UTC in minutes from midnight
utcTime = toUTCTime(time)
// Check if the current UTC time is within any of the allowed timeframes
//isAllowedTimeAsia = (utcTime >= startTimeAsia and utcTime < endTimeAsia)
isAllowedTime = (utcTime >= startTime and utcTime < endTime)
// Apply yellow background color during the allowed time range
bgcolor(isAllowedTime ? color.yellow : na, transp=90)
// Calculating moving averages
shortMAValue = sma(close, shortMA)
longMAValue = sma(close, longMA)
// Plotting the MAs
plot(shortMAValue, title="Short MA", color=color.blue)
plot(longMAValue, title="Long MA", color=color.red)
// Tracking buy and sell signals
var float buyEntryPrice_1 = na
var float buyEntryPrice_2 = na
var float sellEntryPrice_1 = na
var float sellEntryPrice_2 = na
// Logic for Buy and Sell signals
buySignal = crossover(shortMAValue, longMAValue) and isAllowedTime
sellSignal = crossunder(shortMAValue, longMAValue) and isAllowedTime
// Update last buy and sell signal values
if (buySignal)
buyEntryPrice_1 := close
buyEntryPrice_2 := close
else if (sellSignal)
sellEntryPrice_1 := close
sellEntryPrice_2 := close
// Apply background color for entry candles
barcolor(buySignal or sellSignal ? color.yellow :na)
/// Creating buy and sell labels
if (buySignal)
label.new(bar_index, low, text="BUY", style=label.style_label_up, color=color.green, textcolor=color.white, yloc=yloc.belowbar)
if (sellSignal)
label.new(bar_index, high, text="SELL", style=label.style_label_down, color=color.red, textcolor=color.white, yloc=yloc.abovebar)
// Creating labels for 100-point movement
if (not na(buyEntryPrice_1) and close >= buyEntryPrice_1 + target_1)
label.new(bar_index, high, text=tostring(target_1), style=label.style_label_down, color=color.green, textcolor=color.white, yloc=yloc.abovebar)
buyEntryPrice_1 := na // Reset after label is created
if (not na(buyEntryPrice_2) and close >= buyEntryPrice_2 + target_2)
label.new(bar_index, high, text=tostring(target_2), style=label.style_label_down, color=color.green, textcolor=color.white, yloc=yloc.abovebar)
buyEntryPrice_2 := na // Reset after label is created
if (not na(sellEntryPrice_1) and close <= sellEntryPrice_1 - target_1)
label.new(bar_index, low, text=tostring(target_1), style=label.style_label_up, color=color.red, textcolor=color.white, yloc=yloc.belowbar)
sellEntryPrice_1 := na // Reset after label is created
if (not na(sellEntryPrice_2) and close <= sellEntryPrice_2 - target_2)
label.new(bar_index, low, text=tostring(target_2), style=label.style_label_up, color=color.red, textcolor=color.white, yloc=yloc.belowbar)
sellEntryPrice_2 := na // Reset after label is created

US30 Bullish Outlook: Key Targets and Order Flow InsightsGreetings, Traders!
Brief Description🖊️:
At the moment, I am expecting a bullish switch in institutional order flow for US30, which will push the price upwards. The price originates from a daily bullish order block, and I am looking for this to support the price, leading to a bullish draw upon confirmation.
Things I Have Seen👀:
Bullish Support Zone📈: The price is currently supported by a daily bullish order block, indicating a potential upward movement. Price may also look to respect the rejection block and use that as a support to continue the bullish narrative.
Engineered Liquidity🔄: Along the way, my anticipation is to absorb all the engineered trendline liquidity that has been presented.
Bullish Targets📉:
H1 Bearish Order Block: The primary target for this bullish move.
What's Important Now❗
To confirm the anticipated bullish draw, we need to observe the price action and look for supportive signals at the daily bullish order block. Stay tuned for real-time developments and further insights.
Kind Regards,
The_Architect

Us30 long Us30 looking for correction buy momentum...still in bearish trend but correction needed at this moment... this long entry is important for trend continuation

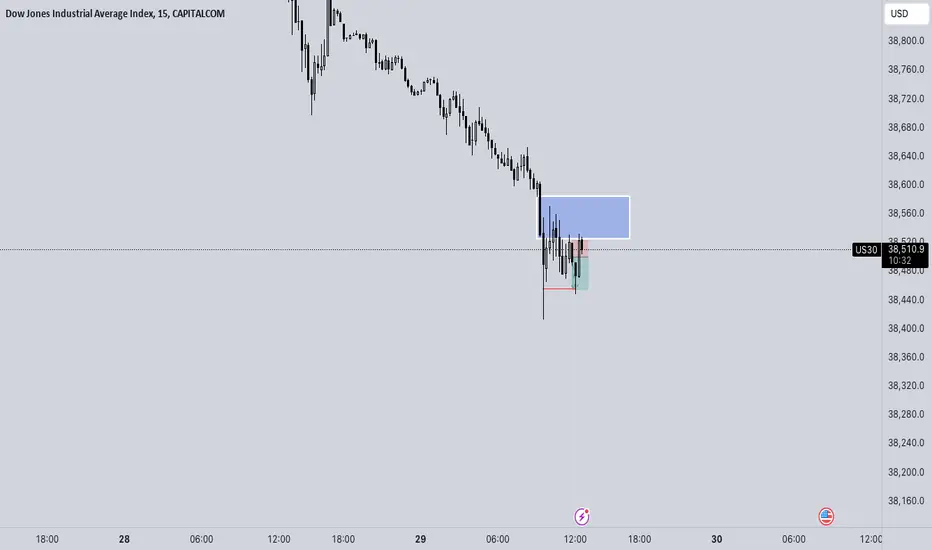
US 30 short - scalp trade Taken a short scalp on US 30. Entered at 38500 targeting the 1min OB (red line)
Entry 38500
TP 38455
SL 38523
Looking to see how we react from the 15min FVG (blue box).
IF we fail to break above the highs expect us to continue lower and hunt the daily sellside liquidity
IF we hold the current highs expect the FVG to act as an inverted FVG and send prices higher towards 38640
PLAN....BE PATIENT AND EXECUTE. LET THE MARKET SHOW YOU ITS HAND AND FOLLOW IT.
Stay safe and never risk more than 1-5% of your capital per trade. The following analysis is merely a price action based analysis and does not constitute financial advice in any form.
Dollar index long viewThe dollar index is well positioned to initiate new a one-month bullish consolidation. With the Fibonacci setting, both previous pullbacks were stopped near the 61.8% level, and additional support for the bullish option is the growing trend line. Based on that, we can expect the dollar index to start a new bullish consolidation with the main target at 107.00.

SPX 500 (longer view) Yes i was bearish and wrong in the past.Didn't expect new ATH on the previous charts!!!
If you look at the leg down starting in 2022, this was just a correction of the bull market (and yes i thought the beginning of the bear, but was wrong)
Now my vision what the chart is telling, is that probably we're creating a M-pattern
Maybe the BTC chart was giving the future of the SPX500.
Why if you take a look at the btc chart we could see a nice 5 elliot wave structure (in green) with after an ABC correction wave (in blue). Almost same like SPX500.
We could make a double top around 4831, when we cros that target we could go till 5156 (same like the btc chart) MEANING on the btc chart we had a 6,90% from the first high and the ATH.
IF we do that on the SPX500 that target from the ATH would be around 5156 (bears becomes bulls) (really think spx could hit this, the end of the big bull market)
BUT if we could cross that target the next and ultimate target would be around 5515 (this target is taking from the FIB 61.8° (the coronalow and the FIB 61.8°)
On the monthly chart we could see big bearish divergence (the blue and red arrow)
The big buy oppertunity for me is the coronalow around the 2222 (the bleu mark), but maybe already on the trendline around 2669 (also bleu mark)
Just be prepared, what went up needs to come down and zoom out, it's not like the most people are thinking: it's only going up up up. If you zoom out, you would see this is not a normal healthy chart. a chart what will bring pain,tears and white flags
Kind regards

DXY death-slide but will Regain value. BTC BULLS up next Smart money red trendline different from regression trend. Smart money contraction shows a stop at POI means downtrend then BTC moves up in BULL POWER.
DXY same pattern but in different volume


US Dollar at Key SupportThe USD decline settled into key support last week at 104.15/36- a region defined by the December high-close (HC), the 38.2% Fibonacci retracement of the December rally, the measured head-and-shoulders objective of the April breakdown, and the 200-day moving average. Note uptrend slope support also converges on this threshold over the next few weeks and the immediate focus is possible price inflection off this zone with the bears vulnerable while above.
Topside resistance is eyed at the 105 -handle and is backed 105.58/63 – a region defined by the 61.8% retracement of the recent decline, the January 2023 high, and the March high-day close (HDC). A breach / close above this threshold would be needed to suggest a more significant low was registered last week and shift the focus back towards the yearly HDC at 106.37 .
A break / close below this key support zone would suggest a larger trend reversal is underway with such a scenario exposing the 2023 yearly open at 103.49 . Key longer-term support remains unchanged at 102.75/99 .
Bottom line : The US Dollar is responding to confluent uptrend support with the weekly opening-range taking shape just above- looking for evidence of an exhaustion low here. From at trading standpoint, a good region to reduce short-exposure / lower protective stops – losses should be limited to 104.15 IF the broader uptrend is to remain viable. Ultimately, a close above 105.63 would be needed to mark resumption of the broader uptrend.
Michael Boutros
@MBForex

Bullish Dow JonesUS30 been bearish for bout 1 week and half, Price now reaching a bullish key level. We are goin to monitor price action on low timeframe and waiting for bulls to kick in.


NAS100 SELL 1 HOUR TIME FRAMESTRONG SUPPLY ZONE
Price has to feel the gap below
Expecting a 5:1 reward,
Let's see!
