SPX - Bearish TrendSPX is in Bearish Trend as there is little divergence and its making Harmonic Pattern which shows it will make reversal.
Market indices


Nifty closing this week looks like Calm before the storm.FII, DII and Retail investors are all awaiting Exit Polls and Actual results of election to follow thereafter. We have already discussed the best and the worst case scenarios. The candle formed today is Doji exhibiting indecisiveness. The support at which Nifty is standing is Mid channel. The other support which has been taken is 50 days EMA. Right now everything looks in balance. Lot of overpriced stocks corrected. Lot of underpriced stocks which gave good results exceled. Many more underpriced Banking and IT stocks are looking like value buys. Many overvalued Psu stocks look like them might again run further in case of expected results. Everything looks like it is on a tipping point. + or - 5 to 10% move depending on results is a definite possibility. DIIs have been buying all the way. FIIs have been selling all the way. Perfect recipe for a thriller to unfold next week. Everything is on a standstill. This weekend might be a calm before the storm.
Nifty Supports: 22392, 22057, 21827, 21712 and 21221. (Worst case scenario 17597 in case the expected results are not seen in election).
Nifty Resistances: 22672, 22829, 23140, 23226 and 23398. (Best case scenario between 23500-23600).

DXYToday's market is focused on the April PCE inflation report, which could influence future Fed rate cuts. Better-than-expected CPI data earlier this month has lifted investor hopes for a favorable PCE outcome. Major indices show mixed movements, with gains in technology and communication services sectors

Banknifty in buy zone49400 above green candle close means and
then if break that green candle high
.banknifty target is 50790

VIX under 10 area VIX is rebounding but in my view it will target under 10 in july before retesting 30

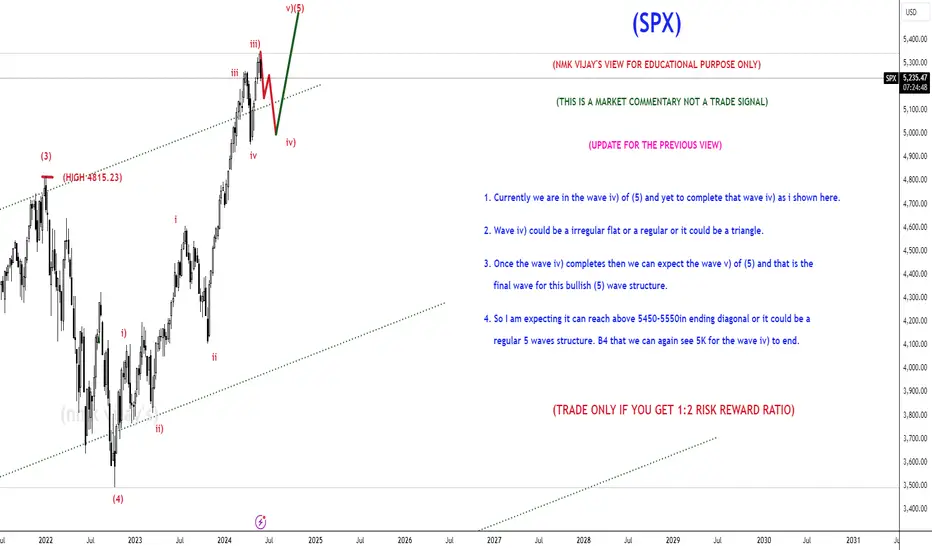
SPX; 5k to reach for wave iv) and v) of (5) to 5550?DISCLAIMER : All labelling and wave counts done by me by manually and i will keep change according to the LIVE MARKET PRICE ACTION. So don't bias, hope on my trade plans...try to learn and make your own strategy...Following is not that much easy...I AM NOT RESPONSIBLE FOR ANY LOSSES IF U TOOK THE TRADE ACCORDING TO MY TRADE PLANS....THANKS LOT..CHEERS
USNAS100 (Futures Slip Amid Rate-Cut Uncertainty)Futures Slip Amid Rate-Cut Uncertainty
Uncertainty over how long the Federal Reserve will maintain elevated interest rates weighed on U.S. stock index futures on Thursday. Investors remained cautious ahead of crucial economic data that could provide insights into the state of the economy.
Technical Analysis:
As mentioned in the previous analysis, the price dropped. Today, we anticipate the GDP report, which is expected to be bullish for the indices, with a projected growth of 1.2%. However, if the GDP exceeds 1.2%, it could lead to a decline towards 18,550 as the first bearish target.
Conversely, a bullish scenario will be activated if the price stabilizes above 18,820, targeting 18,940.
Pivot Line: 18735
Resistance Levels: 18820, 18940, 19100
Support Levels: 18550, 18440, 18250
Today's range is expected to be between the support at 18440 and the resistance at 19,100.
previous idea:

EGX30 Possible Scenarios EGX30 Possible Scenarios :
1. Bullish scenario following the blue lines.
2. bearish scenario following the black lines.


review for SPXOn smal
With Magic_xD indicator
Gann level for downwards correction
It came true for 2 angles
End of 2nd cycle to 5158.58
Goodluck

Nasdaq buy setup institutional tactics hello traders this is my nas100 buy setup
risk reward 1:10
the system: institutional tactics
if you like this deal hit the like button follow comment subscribe and show some love ❤️
wish you good luck and good trading
i would like to have conversation and share our ideas and know you good people
remember the flow state is important
Flow , Glow and know and never blow

31 May Friday Banknifty leval intraday (15min)Red selling zone and green buying zone level learning and education purpose only
Like share comment and follow
Note:-
DISCLAIMER
"Stock market investment/trading is subject to market risk do not trade or investment without proper knowledge or without help of your financial advisor.
Any information shared on this platform is purely for educational and information purpose. We are not responsible for your gain or losses."

USNAS100 (Falling Pressure...)Technical Analysis
The price dropped by approximately 1.30%, as mentioned in the previous analysis.
Currently, the price will trade between 18,435 and 18,550 until a breakout occurs.
Bearish Scenario: Stability below 18,435 will likely lead to a drop towards 18,250.
Bullish Scenario: The price must break above 18,550 and stabilize to reach 18,650 and 18,735.
The Nasdaq continues to experience bearish pressure.
Pivot Line: 18500
Resistance Levels: 18650, 18735, 18820
Support Levels: 18340, 18250, 18110
Today's range is expected to be between the support at 18230 and the resistance at 18650.
previous idea:

Nifty Daily Chart Support and resistance
Support @ 21492 as previous day low
Thriced attemp and cover now closed near low
Resistance @ 21834 as all time high
option chain data support 21500 / 21400 / 21300 / 21000 (weekly expiry)


S&P 500 (future model)?A warning, this is a big possibility!
BTW the red target 5152 is taking from the btc chart.that one is crossed.
On the M-chart we have a bearish divergence!
So like we had on the top of jan 2018 and the top from sept 2018.
Also from the top of sept 2018 and jan 2020, we can see a bearish divergence (blue and red arrow), you could also see what happened next.
So now the question is this a big warning and will this be just a pull back or the beginning of a bear market?
My idea is IF we cross the last ATH at 4824 (dotted red line) and we cross the uptrend channel at the bottom around 4525 (black lines), than and only than the bear market will be in (IMO).
IF not we will get a wave 5 up and that one will go to 5515 (IMO).
That target is taking from the FIBonacci on the coronalow and the fib 61.8° pullback.
Why pullback? People are speaking about a bear market in 2022 but it wasn't, that was just a pullback in the still lasting bull market.
IF we're going down there are 3 potential buy zones.
We have to see IF and HOW spx is going down.
I still believe in blue point 2 and even 3 (buying zones)
Buy zone 1 will be the double bottom + fib 61.8° and good bounce will be there.
Everybody will becoming a bull again, because that was the bottom and after a shake out and fool the bulls again for the next and final bottom at 2 or maybe 3 (the coronalow)
YES i was wrong in the past and now again but just take this in consideration!!!
also keep in mind this is a Monthly chart, it will take time

BNF 15 min - Next expiryMarket being volatile giving unexpected behaviour in short time frame than the long one. After analysing the price behaviour in long time frame, this picture comes out in my mind, predicting next week price movements. Only observation and no active participation!

SPx (US Futures Dip Ahead of PCE Data with Technical) US Futures Dip Ahead of PCE Data
US stock futures edged lower on Friday as investors braced for the April PCE price index report, the Federal Reserve's preferred inflation gauge.
Technical Analyse:
The price dropped by approximately 0.27% from yesterday and reached our target, as mentioned in the previous analysis.
For today, the price is expected to move between 5240 and 5220 until a breakout occurs. Bearish pressure remains , and stability below 5220 will likely support a further decline to 5192, with 5168 as the next target. Conversely, stability above 5240 will suggest an attempt to reach 5260.
Pivot Line: 5226
Resistance Levels: 5260, 5284, 5320
Support Levels: 5193, 5168, 5114
Today’s expected trading range is between the support at 5168 and the resistance at 5262.
previous idea:

Levels discussed on 31st May Livestream31st May
DXY: Core PCE release today, Looking for reaction at 105 resistance
NZDUSD: Sell 0.6070 SL 20 TP 75
AUDUSD: Buy 0.6660 SL 20 TP 50
USDJPY: Buy 157.10 SL 30 TP 80
GBPUSD: Sell 1.2680 SL 20 TP 75 (Hesitation at 1.2345)
EURUSD: Sell 1.0780 SL 20 TP 50
USDCHF: Sel 0.9090 SL 20 TP 65
USDCAD: Buy 1.3690 SL 30 TP 40
Gold: Slight downside from 2338 to 2328

NAS100: First red day on the backside moveHi everyone and welcome to my channel, please don’t forget to support all my work subscribing and liking my post, and for any question leave me a comment, I will be more than happy to help you!
“Trade setups, not movements”
1. DAY OF THE WEEK (Failed Breakout, False Break, Range Expansion)
Monday DAY 1 Opening Range
Tuesday DAY 2 Initial Balance
Wednesday DAY 3 (reset DAY 1) Mid Point Week
Thursday DAY 2 ✅ Day 3 cycle
Friday DAY 3 Closing Range
2. SIGNAL DAY
First Red Day ✅
First Green Day
3 Days Long Breakout
3 Days Short Breakout
Inside Day
3. WEEKLY TEMPLATE
Pump&Dump ✅
Dump&Pump
Frontside
Backside ✅
4. THESIS:
Long: N/A I'm not interested in any long setup, neither counter trending the backside on Thursday
Short: primary, market on the backside move, dumping down with nice bearish momentum. Lower low placed into the LOW, looking for a sell high opportunity at 9:30am NYO or 10:01am after major red news release.
Please note that the purpose of my analysis is to help me and you hunting the best trade setup for the day, none of my technical aspects are a way to forecast any directional market movement.
Gianni

SPX Neatural to Bearish The giant for now is neatural to bearish, the biggest reason that it was up was duo to NVIDIA adding 20 points to this
However i was never comfortable trading SPX or the equivalent US500 cause i don't like surprises, but for those who do trade it, well, here it is, figure this out

S&P500 I Bullish Bounced ?Based on the H4 chart analysis, we can see that the price is falling to our buy entry at 5209.43, which is an overlap support
Our take profit will be at 5269.10, a pullback resistance.
The stop loss will be placed at 5169.62, which is an overlap support level.
High Risk Investment Warning
Trading Forex/CFDs on margin carries a high level of risk and may not be suitable for all investors. Leverage can work against you.
Stratos Markets Limited (www.fxcm.com):
CFDs are complex instruments and come with a high risk of losing money rapidly due to leverage. 68% of retail investor accounts lose money when trading CFDs with this provider. You should consider whether you understand how CFDs work and whether you can afford to take the high risk of losing your money.
Stratos Europe Ltd, previously FXCM EU Ltd (www.fxcm.com):
CFDs are complex instruments and come with a high risk of losing money rapidly due to leverage. 70% of retail investor accounts lose money when trading CFDs with this provider. You should consider whether you understand how CFDs work and whether you can afford to take the high risk of losing your money.
Stratos Trading Pty. Limited (www.fxcm.com):
Trading FX/CFDs carries significant risks. FXCM AU (AFSL 309763), please read the Financial Services Guide, Product Disclosure Statement, Target Market Determination and Terms of Business at www.fxcm.com
Stratos Global LLC (www.fxcm.com):
Losses can exceed deposits.
Please be advised that the information presented on TradingView is provided to FXCM (‘Company’, ‘we’) by a third-party provider (‘TFA Global Pte Ltd’). Please be reminded that you are solely responsible for the trading decisions on your account. There is a very high degree of risk involved in trading. Any information and/or content is intended entirely for research, educational and informational purposes only and does not constitute investment or consultation advice or investment strategy. The information is not tailored to the investment needs of any specific person and therefore does not involve a consideration of any of the investment objectives, financial situation or needs of any viewer that may receive it. Kindly also note that past performance is not a reliable indicator of future results. Actual results may differ materially from those anticipated in forward-looking or past performance statements. We assume no liability as to the accuracy or completeness of any of the information and/or content provided herein and the Company cannot be held responsible for any omission, mistake nor for any loss or damage including without limitation to any loss of profit which may arise from reliance on any information supplied by TFA Global Pte Ltd.
The speaker(s) is neither an employee, agent nor representative of FXCM and is therefore acting independently. The opinions given are their own, constitute general market commentary, and do not constitute the opinion or advice of FXCM or any form of personal or investment advice. FXCM neither endorses nor guarantees offerings of third party speakers, nor is FXCM responsible for the content, veracity or opinions of third-party speakers, presenters or participants.
