48500 Sting Bank Nifty could face big bears at 48500. The next stop and retrace level could be the 50% retracement and could consolidate for big moves on expiry tomorrow. Again will wait to get a feel of the intend of big hands before jumping into trades.
Market indices

Buying HK33HKD Oanda On An Up TrendRising demand for HK33HKD over several days on the Daily Time Frame based on the 6EMA.
I bought HK33HKD on both my FTMO 10K Challenge Phase One and on my Oanda Main Account.
Discount offered by seller at 6EMA on 4H Time Frame.
Initial SL set is wide, because I want to give myself more time if I am losing, to decide if I want to exit for a small loss or win instead of having it as a full blown 1R loss.
By setting my SL wide initially, my risk per pip becomes significantly smaller.
Besides, I am risking about 10% per trade(based on my previous account size).
If all is well, I will start trading 50$ SGD per trade next month.
All is well = My account size reach 1k SGD(currently sitting on 906$ SGD) and that it is a new month.
0950SGT
20052024
Feeling groggy.
Add : Now, instead of analysing the Daily Time Frame, first. I analysis the entry time frame first. Why? Because over the years I realised that i missed out on alot of opportunities that are better than the ones I am waiting for, because I analyse my watch list selections on the Daily Time Frame first.
By doing a top down analysis, I miss out on strong trends that are not visible on the Daily Time Frame, because price could be in a range on the Daily, but it has yet to reach the Daily's Major S&R levels. And so, the trend on the entry time frame is tradable, but I missed it because I have already eliminated it during my selection phase.
TLDR So, I am doing a bottoms up analysis from now on because I am missing out on trending opportunities on the lower time frame that is not visible on the higher time frame.
0954SGT
20052024

NIFTYBANK: Lag or Lead?NIFTYBANK usually, prints first then takes the broader market with it, either up or down. This time it is stuck below the halfway back point, just about that.
That feeds well both the bulls and bears.
Bears: Bears can take home the point the entire rise post the fall is stalled below the 0.50% and hence any further loss of upside from here and revisit 47600, can potentially mean start of next leg lower, watch the PIP picture
Bulls: Bulls can take home, the fact that trendline support, inverted hammer, ability to stay incrementally higher, not ABC but next five wave moves in motion.
That is the two sides of the same coin.
Clearly, the trendline is the one that we would like to respect and hence as long as that is held, the scope for upside probe is to be the option.
Also, as the days unfold, the point on trendline, incrementally creeps up and that has to be kept in mind.
Suffice to place 47800-48400 range, close either side opens up the scope for further move.

NIFTY: Rhymes and Rhythms - Khata Khat! The test day was more interesting than the actual days of trading.
The system risk is so huge, we see service providers on rotation, put the traders more specifically at risk. It was the day of ICICI Direct on Friday, shut almost near one hour. Hopefully, authorities will take note of the same.
The political memes of Khata Khat, can stay for some more time, it is the speculative urge, what next in the UPPER circuit that is the real cause for worry. There are many extended spaces.
Point to note and remember, market is a place there is always rotation, persistence and reversals happening and unfolding all the time.
Since start of April the market has moved three candles of green three candles of red, this is the fourth time, save two occasions one marked in circle another the testing day.
There are rhythms and that rhymes the market. Can one extend that and conclude next is three candles down, if that is as simple as it sounds, everybody would have taken home the money bags.
End of Five Phases, usually markets should re-think and reassess, that is what we expect markets to do today. Also, the risk to pierce the higher area, is not with the reward, hence calibrated moves are the order, with a scope for downward risk than upward reward.
Simply, put the new range is 22330-22630 we are in the middle, intra-day 22530-22550-580 should ideally cap, with a possibility to test the lower end of 22350-400.
Supports 22480-22450-22380-22340
Supply: 22565-22595-22628

US30 is not slowing down for anyone...We will not go below 39570 in the short term, Watch the levels 41000, 41140, 41430. All three targets will hit. US30's bullish momentum is only building up not slowing down. Load up 39570-39700 and Thank me later :)

Is DXY still bullish?My major trend was not broken either Friday nor Today.. I am still accessing whether DXY is still bullish. There some signs that DXY wants to to turn bearish. But I have not seen any confirmation and will wait on my trend to be broken before changing my bios. Let me know what you think.. Have dxy turn bearish?

Dxy analysis for the week Dxy already hit tp1 and is now consolidating in a zone where it’s either creating a higher low (#2) of a bearish Elliot wave structure or expanding higher to break the range for its target of liquidity resting above the x and d legs of the harmonic
Keeping eyes on it
Correlation to keep In mind is:
If Dxy bullish then
Xxxusd pairs bearish
USDxxx pairs bullish
And vice versa

nas100 drops after a bullish momentumthere is volume behind the first fair value gap take short partials at 18640,5 for safe entries,possibly at 18707.3 for sniper entry reminder always risk 10% of your money...sl:18722.2

CHART BREAKDOWN US30: Key Levels, Targets and Thoughts!🎯Brief Description🖊️:
The chart provides insights into critical market levels, emphasizing an essential supply zone (medium-risk sell zone) spanning from 39600 to 39570, respectively, are highlighted.
Things I Have Seen👀:
Medium-Risk Buy Zone🟠: Noted between 39600 and 39570, suggesting another area with moderate risk for potential buying positions.
Bullish Targets📈:
39700: Possible retracement area.
39850: Possible retracement area.
40100: Area with a lot of liquidity.
What's Important Now❗
Currently, the crucial approach is to wait and observe the price action at this level. We need to assess how the market reacts before considering any decisive moves. Stay observant and responsive to real-time developments in the market.

CHART BREAKDOWN NASDAQ: Key Levels, Targets and Thoughts!🎯Brief Description🖊️:
The chart provides insights into critical market levels, emphasizing an essential demand zone (low-risk buy zone) spanning from 18330 to 18315, respectively, are highlighted.
Things I Have Seen👀:
Important Demand Zone🟢: Identified between 18330 and 18315, serving as a low-risk buy.
Bullish Targets📈:
18400: Possible retracement area.
18500: Possible retracement area.
18580: Possible retracement area.
18670: Area with a lot of liquidity.
What's Important Now❗
Currently, the crucial approach is to wait and observe the price action at this level. We need to assess how the market reacts before considering any decisive moves. Stay observant and responsive to real-time developments in the market.

S&P500 is benefiting from the bearish momentum on DXYHey Traders, in today's trading session we are monitoring US500 for a buying opportunity around 5250 zone, US500 is trading in an uptrend and currently is in a correction phase in which it is approaching the trend at 5250 support and resistance area.
Trade safe, Joe.

2024-05-20 - a daily price action after hour update - daxGood Evening and I hope you are well.
overall market comment
Markets moved mostly sideways today but commodities are on a tear, except for Oil. We can expect more volatility on the commodities side, since they are in play and everyone want’s some. Be humble to net get caught on the wrong side and have strong momentum on your side. For stock indexes I expect either another leg up which could start tomorrow or a bigger pull-back to the daily 20 ema.
dax
comment: Tight trading range 18800 - 18890. Absolutely neutral inside that range. Bulls only managed to get to around 50% pull-back from ath to 18700, which is weak but since bears could not even close the gap to Friday, that’s even more pathetic. Expecting more sideways until the triangle from the right shoulders breaks.
current market cycle: trading range - bulls broke 19000 but no follow through.
key levels: 18700 - 19000 - below 18700 is 18400 next.
bull case: Bulls keeping this at the highs and 300 points above the daily 20ema. As long as they keep this above 18700, they are in full control and higher highs are possible. For tomorrow I expect they will close the gap to 18850 and try higher again. The small bear trend line is their next resistance.
bear case: Bears kept it below the 50% pb most recent low to high. Market formed a head & shoulders pattern which fails more than it breaks down. It’s a continuation pattern and bears do not have the odds on their side here. They need to close the gap to 18792 and then retest 18700. For now I can’t see the market breaking that level without any catalyst.
short term: Bearish below 18880 and bullish above for test of 19000 or higher. Head & Shoulders break down confirmed with 15m close below 18700 for target 18400 or lower.
medium-long term: My long term outlook stays bearish and I expect at least a -20% correction in 2024. Medium term is 17100 while I think we can touch the big bull trend line starting 2022-10 around 16700 in 2024. —unchanged
trade of the day: Long from the EU open was ok, since bears could not close the gap to Friday. Bullish enough for target 18900ish.

Using S5TH (spx stocks above 200dma) as an oscillator timing cycPretty cool feature. You can use the 9month moving average in S5TH (spx stocks above the 200dma) to time the market cycle. Figure out the upward momentum (with help of game theory and TNX cycle). In practice and theory peoples options should be predictable because everyone act in their self-interest, seeking safety (hypothetical riskfree) and potential.
I use this as an oschilator (like RSI).. above 50% reading is bull market (because more than 50% stocks above it's 200dma).
This thing points to bull market to at least like 2025 summer. Worth noting that business cycle and TNX patterns are key here.

S&P500: Wait for the ideal level to rebuy.The S&P500 index is neutral on its 1D technical outlook (RSI = 44.135, MACD = 2.270, ADX = 26.567) despite the fact that it made a new All Time High, in fact turning the former R level into S. The uptrend is being supported by the 4H MA50 since the May 2nd breakout and the Channel Up presents a new low risk buy opportunity close to the 4H MA100, ideally when the 4H RSI approaches the 30.000 limit. We will wait for the opportunity to go long and target the top of the Channel Up (TP = 5,400).
See how our prior idea has worked out:
## If you like our free content follow our profile to get more daily ideas. ##
## Comments and likes are greatly appreciated. ##

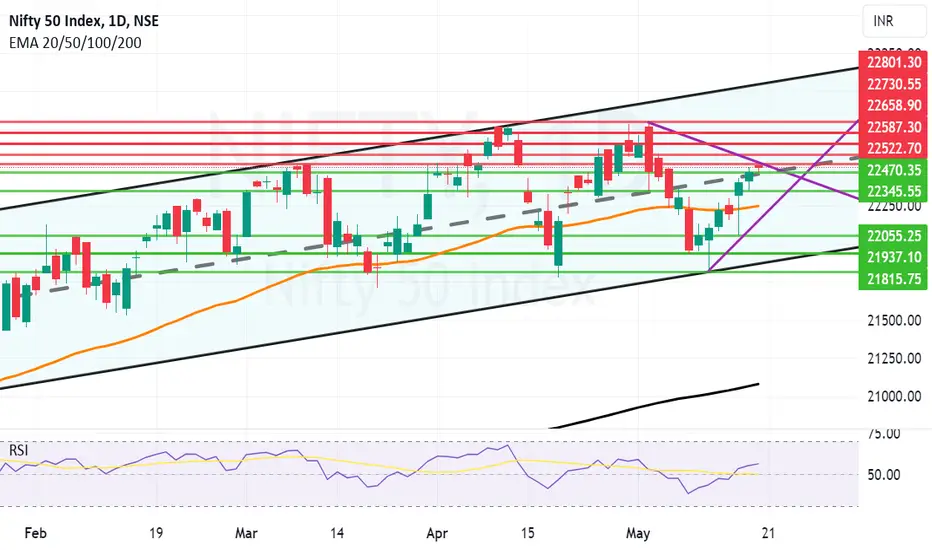
Good move ahead if mid channel support is held by NiftyGood move ahead for Nifty can hold the levels of 22470 and give a closing above 22522. Incase we get a closing above 22522 the resistances ahead will be 22587, 22658, 22730 and 22800+. In case Nifty gives a closing below 22470 the supports will be at 22345, 22246 and 22055. 22522 is however a strong trendline resistance and gap up opening and holding above it is the way to overcome it faster. Shadow of the candle is positive for the beginning of the week.
5500 Deutche Bank? How do you suppose?We are at a very powerful trend line resistance area and I'm not bearish. If we break 5150 on the s&p500 I'll become very bearish. I'm already bullish SQQQ and UVIX, UVXY, VXXB Long VIX ETNs.
