GDAXI Germany 40 showed false breakoutGermany 40 seems false breakout, it's a great time to try short position, or cut some your stocks long positions.
Market indices

GDAXI Germany 40 showed false breakoutGermany 40 seems false breakout, it's a great time to try short position, or cut some your stocks long positions.

GERMANY 30/40 DE30/40 Robbery Plan To make and take moneyMy Dear Robbers / Traders,
This is our master plan to Heist GERMANY 30/40 Bank based on Thief Trading style Technical Analysis.. kindly please follow the plan I have mentioned in the chart. Our target is Red Zone that is High risk Dangerous level Police Force is waiting for our arrival, Market is overbought / Consolidation / Trend Reversal at the level Bearish Robbers / Traders gain the strength. Be safe and be careful and Be rich.
Note: If you've got a lot of money you can get out right away otherwise you can join with a swing trade robbers and continue the heist plan,
Loot and escape on the target 🎯 Swing Traders Plz Book the partial sum of money Use Trailing Stop To Protect Looted Money and wait for next breakout of dynamic level / Order Block, Once it is cleared we can continue our heist plan to next new target it will update after the Breakouts.
support our robbery plan we can easily make money & take money 💰💵 Join your hands with US. Loot Everything in this market everyday.


JSE Top 40It's Been a Long Time, Glad to be Back! 🚀
Hey TradingView fam! After a long hiatus, I'm excited to dive back into the charts with you all. Today, my focus is on the JSE Top 40. With upcoming elections in South Africa and approximately 130 other countries going to the polls this year, we're bound to see some market volatility. But will this lead to a bear market? In my personal opinion, it's a no. Let's break it down. 📉➡️📈
Weekly Chart Analysis:
When looking at the weekly chart, which aligns well with long-term investing, the current market structure is very bullish. We have equal highs sitting at 75,921.75, and the price is currently in a supply level heading into the South African elections. With loadshedding expected to kick back in post-elections, this could fuel Rand hedge stocks in the index. The continued devaluation of the Rand is likely, given the weak economic growth and poor management of state resources.
What Does This Mean?
My bet is on the USD-denominated bonds hurting balance sheets, and we might see an Eskom bailout announced within the next few years. It’s still unclear how much diesel Eskom is burning to keep the lights on, but this could significantly impact the market. We could see prices hit all-time highs and then retreat to the 67,500 region, which should provide a decent entry with a target set at the 84,650 region.
If there's a risk-off event in global markets, let it fall to 57,675 before switching to the daily chart for entries. 📊🔄
Elections Around the World 🌍
Did you know that around 130 countries are having elections this year? From major economies to emerging markets, this will surely add an extra layer of excitement and unpredictability to the trading environment. Buckle up, it's going to be an interesting ride! 🎢
Final Thoughts
The blend of political events, economic challenges, and market dynamics makes this an intriguing time for the JSE Top 40. Keep your eyes on the charts, stay informed, and let's navigate these waters together.
Disclaimer: This post is for educational purposes only and does not constitute financial advice. Always do your own research before making any investment decisions. 📚💡
Happy trading, everyone! Let's make this year a profitable one. 🌟

USD come back strongerI have 2 alternative movement for DXY. Looking for bullish an impulsive move upwards.

Big Movements to the upside.After a bearish landslide of a week, DJ will be looking to correct itself. Expect the bulls to make a massive upclimb. Especially after the PDH has been crushed. I keep it simple, block out the noice. Trade my zones and watch the movement explore. Peace traders $

Melt-up in securitiesHaving handled the decline, the markets now seem to be on the verge of a melt-up. We are already seeing it in European securities and industrials. However, I think the risk reward is best in Nasdaq, where I think we will trade at least 15% by the end of Q3. Looking at some data, it seems that fund managers are again underinvested in equities, which limits the downside.
I would position with a tactical long in NDQ-futures. With a risk/reward of 5 - risking 10% of my capital.

Another Perspective: "a great place to exit"Not financial advise, and anything could happen, but there is historically an 80% probability that this breaks down.
The US Government and the Federal reserve have made some grave errors. Same mistakes over and over.
This one looks real to me. Not a correction. Not a dip to buy. It's a maelstorm from hell.
In real dollar terms, we touched 2021 highs here and rejected.
Because people are slow to respond, it will be a very slow motion event I suspect.
At this point, we have a setup likely to dip. You can check out here, let it drop, and buy back in if your greedy fingers want more more more. But if you're looking for safety, I think we are likely on the brink of something seriously salty. If there is a catalyst - a geopolitical event, or bank failures... If consumer confidence in the financial system is poisoned. Maybe by bots running in china suggesting people take their money out of the bank, then the world will go to shit. If the top in 2021 invoked terror in you, then you see it here in 2024. Divide the market by uscpi - it's a double top in real dollars. US gov't is going to spend today and take it from all of us tomorrow in inflation.
"The things that surprised me the most were the things that had not happened in my lifetime."
I don't know what happens next, but I'm very sure that things are gonna get weird.

LONG IDEAMarket has shifted favoring longs. Targets and annotations made in the chart. 18581.4 possible targets.
Key levels and annotations made on the chart.
Once the stop level of 18443.9 is breached, the idea is invalidated and no trades for the day
As usual, manage risk and conserve capital.
Risk engaged minimized to half following a loss on the previous idea.

BullishPrepare for higher highs.Dont mess this up.
HH and HL it's that simple, risk very little and keep the larger picture in mind.

3 Day and 1 Day chart of the NDX PSA
I really don't post much anymore at but I do trade.
This is PSA is showing you that will maybe happening.
The two percent down and up routine leaves you with a daily doji but the Heiken Ashi candle on the left paints a most honest picture. One day chart on left.
Market was strong on open today NYSE TICK was 800 to 1000 and was very positive on open, and this was the dumped on. Market and then returned like it never happened. Not normal price action.
The Nikkei USD contract NKD1 didn't even move as the NDX sold off 2% it usually moves in sympathy with US Indices and usually more volatile.
Since at the end of the day the NDX closed flat. They always know.
Bottom line that one day Heiken Ashi is very negative, not that a spinning top - doji is positive.
The 3 day chart shows clearly there is divergence on my indicator to boot.
If we get to a good sell off we can return to 17688 there is a fair value gap to fill there, and is close to the .618 Fib level on daily.

TIME TO SELL NASDAQ TIME TO SELL NASDAQ
Price finally reached weekly bearish selling zone (Akka in Spanish "area de ventas").
I expect a strong sell towards SMA 30 @ W1 changing weekly tendency from strong bullish into strong bearish.
TP areas will be triangle cuspid and 50-61.8%

DXY - Weekly Forecast - 03 June 2024We can go both ways, so i've pasted by view, there is also a video that walks through it.
My longer term view over the next few months is bullish on DXY

DX - Weekly Forecast - 02 June 2024Weekly forecast of DXY for 02 June 2024, i think we can go either way and that represents opportunities on both sides with tight stops.

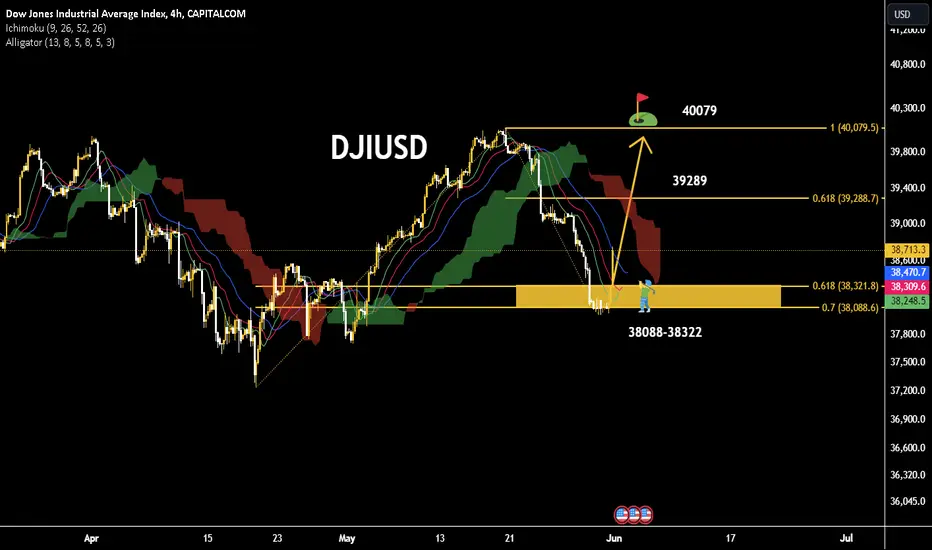
NEW IDEA FOR DOWJONES The increase in the Dow Jones index due to the increase in profits from the income of companies
By examining the trend in the four-hour time frame, the Dow Jones index, having an important support interval in the range of 38,322-38,088, can increase to the previous ceiling resistance in the range of 40,079, in the meantime, the 61.8% Fibo resistance will be seen at 39,289.
SPX GANN ANALYSISNow reverse for correction for target at 5284.25 then 5295.75
then supposed for reverse
staying above 5295.75 means reverse of downwards move

S&P 500 Daily Chart Analysis For Week of May 31, 2024Technical Analysis and Outlook:
In the shortened trading week, the S&P 500 hit our expected resistance level of 5323 and promptly fell as part of the renewed upward movement toward the support level of 5257 and the nearby support level of 5221. A solid upward bounce is on its way to target our newly identified key resistance level of 5323 for the upcoming trading week.

Weekly Analysis of UK100 Butterfly 🦋 the detail is shown in the above Idea.
I made this Idea based on Candlestick Analysis and Harmonic pattern using Fibonacci tools.
In the context of financial markets, the phrase " pull back to last golden level and flying UK100 butterfly to next golden level at 8320 " suggests a potential upward movement in the UK100 index, possibly after a period of consolidation or retracement.
Traders and investors may interpret this as a signal to anticipate a bullish momentum, aiming for a target level around 8320.
It highlights the importance of identifying key support and resistance levels, and the potential for significant price movements.
As with any market analysis, it's crucial to consider risk management strategies before making trading decisions at black circular region .


Powerful compressionIndex is compressing inside symmetrical triangle and going to explode soon
In hourly chart index is moving between 1H SMA50 and 1H SMA200 for some time
I suppose it will break down because of last bearish engulfing candle on weekly chart


