23500?Yesterday's high and low could be the range you want to look for. Let us see what the big hands have in store for Nifty. Will prefer to wait and watch before entering positions as US saw a good sell off from ATH and it was sudden.
Market indices

SPX in daily chartHello everyone
(an update for my last idea of SPX)
I do not agree that SPX rally has been over and and this correction is the start of a reversal trend although I accept every surprise in this market.
One of tricky ways that most of traders chose is to walk in the middle line and talk about both bullish and bearish scenarios in the same time.
It really works for an analyst but far from a trader thought and strategy (who really gets the real positions).
To be honest, you can not trader if just stand in this middle line and I am sure you have to chose your side (Bull or Bear) and also estimate all countertrends and minimize your lost (Minor SL) and enter the position finally.
For this reason I always chose my side even if it is incorrect and just try to lower my damage as little as I can and leave my position (never interfere in your positions before SL touches) until time shows me all.
Thanks


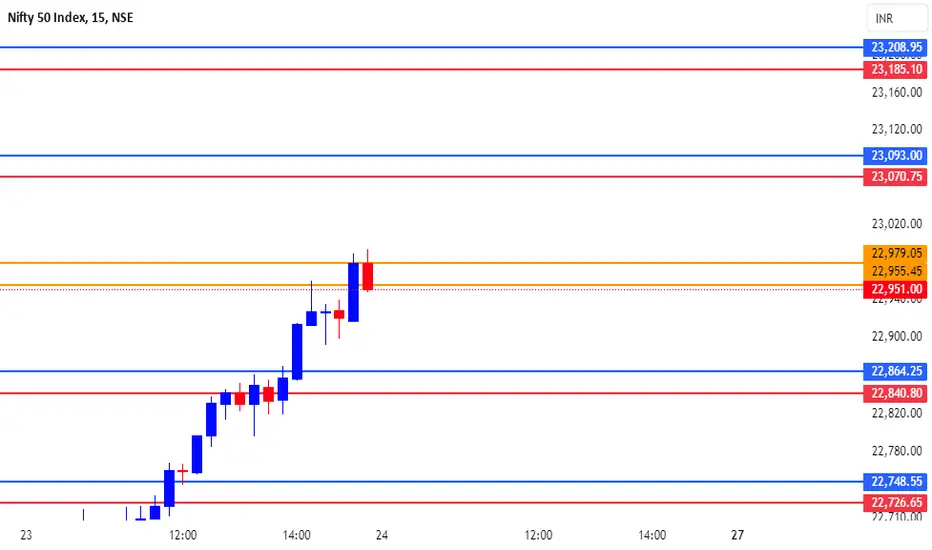
NIFTY TRADING LEVELS FOR 24-05-2024Explanation:
This is a very useful trading system. This means that you should not take a trade blindly, but rather that there is another confirmation to take the trade you can use this for perfect entry and perfect exit
This trading opportunity is based on volume, previous price, and price range , are included
Entry/Exit point's:
- It has very easy entry and exit points
- In this pair of lines with two colors are given (RED AND BLUE)
- In this the blue line is used to take long entry and the red line is used to take short entry (But it is all based on a more conformation from your trading plan)
Stop Loss/Take Profit:
Stop Loss
- According to this, if you take a long trade, its stop loss will be the red line just below ( A trade can exit either when the price crosses the red line or the 5 minute candlestick crosses the red line. (This can be done according to your preference) )
- A short entry should use the opposite rules to a long entry
Take Profit
-When you take a long entry according to the profit to be booked is on the next red line above. ( Or if there are other reasons, it can be a safe exit )
- Opposite rules for booking profit on long entry are to book profit on short trade. ( The blue line above is the stop loss of short entry )
Timeframe:
According to this, the time frame you should use while taking trades is 5 minutes time frames . (5 minute time frame works well in this)
Risk Disclaimer:
Trading carries significant risk and is not suitable for all traders. You may lose some or all of your capital in a matter of minutes or hours. Market conditions can change rapidly, and prices can move against you quickly. You may not always be able to exit at a favorable price, and you may be required to hold a position overnight, exposing yourself to additional risk. Day trading involves high risk, high leverage, and high stakes, and you should only trade with funds you can afford to lose. Please carefully consider your financial situation, risk tolerance, and trading objectives before engaging in day trading.
Engagement:
Share your insights, ask questions, and learn from others in the community. Whether you're a seasoned pro or just starting out, we're all in this together.
What's your take on the current market conditions? Which trading strategies are working for you? Let's discuss and help each other grow as traders!
Comment below and let's get the conversation started!
Original Content:
This trading setup is the result of my own innovation and expertise, and is not based on any publicly available information or third-party systems. It is a reflection of my dedication to developing a competitive edge in the markets.
BANKNIFTY Today Intraday Levels
No Price Action
No Support and Resistance
No Indicators
No Moving Averages
Not Gann levels These levels are purely based on mathematics.
If it is useful please give your comment.

NIFTYBANK: Merry Bouzu!Maribouzu candles are warning to the current trend and tell the next trend that is in motion.
NIFTYBANK produced one such yesterday (leaving very minor wicks).
Similar Maribouzu did appear on 29 April and the markets celeberated, but slowly the decent gave way all the gains.
Will that be the case this time also?
1. The rise is from the lowest point of trend-line
2. Last time when it rallied from that trend line the price action moved from 46579 to the near 50 K, that sense we have room to move past the 50 K.
3. What the other side, US interest rates spike, US dollar ascends, Asian Markets weak, so the up move can be challenged.
4. The supply becomes support and vice versa. We get to the new range 47300-48300.
5. NIFTYBANK true to its nature, takes U turn from the extremes and we are not in the extremes we are at the middle.
6. Some profit taking is in order, but any close today below 48500 frustrates the up move.
Support 48550-48350
Supply 48830-48930-49150

NIFTY: The ploy in the plot! It was there for all to see; we simply chose to ignore it.
1. Huge shorts by FII (one can debate the internals, but the psyche was there once certain levels are broken the short covering to ensure, the volume spike post the break of ATH supports this)
2. The 400 plus is the ploy played to trap the opposition, PM statements, is clear that if the market is factoring this point, then the adjustments will have to be made. You won't get any more admissions like this.
3. Now it all depends on the Exit polls and actual polls, we will do that one day before that.
4. Continue to believe, this week close candle is important, and that has happened too fast to the discomfort of many including us.
5. Confluence of resistance ranging from 23108-23260 suggest that would be difficult to cross, while bears need min close below the previous ATH that is 22800.
6. We circle around and move with higher base is the first impression. However, do not believe that the short covering is done and dusted, they are done part and moved into safer places of individual stocks.
7. A cursory look of the graph suggests that the price action remains within the channel and more so above the Mid of the Channel and recent move below that a failed one. What is interesting to see is the supply line drawn with the previous highs and the channel one both are close.
8. Optically looks good to enter, but as always, the dips are safer than just jumping buy.
Circling the 22800-23100 range for the day.

Nifty 50 - Skewed TringleSkewed Triangle
If a very strong trend takes place, we could face a Skewed Triangle, its wave D is longer than wave B. So. It’s the only type of triangle, which has a direction towards the main trend. This pattern is rare and we should mark it as the last possible scenario. The following Nifty 50 chart represents a Skewed Triangle, which pushed the price higher into the fifth wave.

a change in the market for the summerstocks, commodities + crypto all are dropping, the big boys pulling money out even the safe heaven gold because its time for the DXY to break out out here, its been like over a year and the news is in favour for the DXY yet its down. now all the technical's and fundamental's are set in stone
its time for the DXY to rip

eaasy trade on NAS100this one seems better than US30 but i like both and put both trades on, tap the area and go up , comfy stop loss and bigger tp . based off the other technicals ( i explained on my YT ) for stocks this trade lines up with everything.

stocks for a pull back?vix broke above the key resistance its up from here, little sell to continue up for the week i believe. has GAP to fill on 5 min TF. lets see!

easy trade on da dirty 30entry from here is a big balls play, simple analysis. your best entry will be after the break then retest of the trendline. suuuper simple lets see!

SPX500 - Bullish Stancehe SPX500 has undergone a consolidation phase after a bullish trend, displaying choppy price movements. Notable patterns emerged, including a triple top formation with bearish divergence followed by an ascending triangle, indicating a potential continuation of the uptrend. Amidst cautious trading sentiments, a failed breakout from the triangle pattern hinted at a possible rectangle formation, supporting bullish continuation. Currently, the market has broken above the triple top, presenting a favorable opportunity for long positions, either immediately or upon a retest of the support level. With minimal resistance ahead, traders can consider riding the bullish momentum until signs of bearishness materialize, thereby capitalizing on the prevailing uptrend.

Bullish bounce off pullback support?NAS100 is falling towards a support level which is a pullback support and could potentially bounce from this level to our take profit.
Entry: 18,427.71
Why we like it:
There is a pullback support level.
Stop loss: 18,149.88
Why we like it:
There is an overlap support level which lines up with the 50% Fibonacci retracement.
Take profit: 18,899.05
Why we like it:
There is a pullback resistance.
Please be advised that the information presented on TradingView is provided to Vantage (‘Vantage Global Limited’, ‘we’) by a third-party provider (‘Everest Fortune Group’). Please be reminded that you are solely responsible for the trading decisions on your account. There is a very high degree of risk involved in trading. Any information and/or content is intended entirely for research, educational and informational purposes only and does not constitute investment or consultation advice or investment strategy. The information is not tailored to the investment needs of any specific person and therefore does not involve a consideration of any of the investment objectives, financial situation or needs of any viewer that may receive it. Kindly also note that past performance is not a reliable indicator of future results. Actual results may differ materially from those anticipated in forward-looking or past performance statements. We assume no liability as to the accuracy or completeness of any of the information and/or content provided herein and the Company cannot be held responsible for any omission, mistake nor for any loss or damage including without limitation to any loss of profit which may arise from reliance on any information supplied by Everest Fortune Group.

DXY Bull FlagDXY will be an important watch moving forward along with TNX. DXY had been weakening for a while but looks ready to come roaring back. This will put a lot of pressure on stocks and other things such as the Yen. Bank of Japan will have to intervene again eventually if this is a real sell off.

DXY SETUPExpecting the market to move as noted. Using SMC and price action makes it easy to understand the market

DXY STRUCTURE Hi guys, as we look forward concerning market movements this is what we will be looking at for the coming week, stat tuned for more update, do well to like share and follow, stay safe stay sound.

VIX Paths Moving ForwardWe got a nice volatility spike today and more pressure from the ever rising treasury yields. We coukd see a higher VIX spike soon if it doesn't get shut down at resistance shortly above.
I typically prefer to use VX instead of VIX, but VIZ can be good sometimes. People say you can't use TA on VIX and I disagree. However, TA on VX is typically better than on VIX. Should be watching both.

ATH Breakout for Nifty but has the rally got more steam?Major ATH All Time high Breakout for Nifty today however Nifty could not cross the much coveted level of 23K. Can Nifty do to it tomorrow? has it got the steam? RSI is high indicating that Nifty is getting overbought and valuations of a lot of stocks are very pricey. However there might still be opportunity left in a few Large cap stock specially IT, Banking and Finance space which have fallen out of favour of investors lately. Valuations in some PSU, Mid and Small Case space are questionable currently and we advise keeping a strict trailing stop loss wherever you have good profit.
Remember nobody has ever become a pauper by booking profits. Keep strict trailing Stop Losses. They are best friends. Loss in Profit is ok but Profit to loss is not ok.
Nifty Major Supports levels: 22784, 22507 and 22298.
Major Future resistance levels: 22293, 23060, 23208 and 23407.

#DXY#dollar_index
#Update
According to the previous analysis, the second scenario that was mentioned can be completed in the area of 107 to 109 movement units...
But according to the structure, I found it necessary to do this update, because according to the type of movement behavior, we should see a movement towards the ceiling.
1- This movement wave can at least return 100% of the wave, which is the red box range.
2- If a failure occurs, the 1.272 and 1.618 targets will be activated.
Therefore, the post will be updated up to 100% if necessary.
3- This upward movement will form the big B wave, which will then have to wait for the big C, which will have a sharp break and acceleration. Therefore, this wave should be a triple wave.
4-According to the analysis of #gold, ( HERE )there is a big super cycle in gold for the next step of its growth, which we should probably witness big changes.

TNX Bull FlagTNX has a short term bull flag and had a big gain today. Looks like it is ready to breakout and head for trendline resistance above. If that trendline gives, things actually get really scary.

CHART BREAKDOWN NASDAQ: Key Levels, Targets and Thoughts!🎯Brief Description🖊️:
The chart provides insights into critical market levels, emphasizing an essential demand zone (low-risk buy zone) spanning from 18330 to 18315. Additionally, medium-risk sell zone between 18870-18920, respectively, are highlighted.
Things I Have Seen👀:
Important Demand Zone🟢: Identified between 18330 and 18315, serving as a low-risk buy.
Medium-Risk Sell Zone🟠: Noted between 18870 and 18920, suggesting another area with moderate risk for potential selling positions.
Bearish Targets📉:
18850: Possible retracement area.
18700: Possible retracement area.
18500: Area with laying low liquidity.
Ultimate Target: 18330- Essential Demand Zone
Bullish Targets📈:
18400: Possible retracement area.
18500: Possible retracement area.
18580: Possible retracement area.
18670: Area with a lot of liquidity.
What's Important Now❗
Currently, the crucial approach is to wait and observe the price action at this level. We need to assess how the market reacts before considering any decisive moves. Stay observant and responsive to real-time developments in the market.

2024-05-23 - a daily price action after hour update - daxGood Evening and I hope you are well.
overall market comment
If bears can get follow through selling tomorrow and trap bulls below the breakout levels, we could see acceleration of this selling. If bulls manage to BTFD and make money with it again, this madness continues for new highs I guess.
dax
comment: Another break of the neckline but bears need follow through. There are at least 3 measured move targets to around 18400-18450 so this will be the magnet for tomorrow. Invalid above 18760.
current market cycle: trading range
key levels: 18400 - 18800
bull case: Bulls closed right at yesterdays close 18750 but US session closed below the neckline. Bulls are in deep trouble tomorrow if they can’t pump this above 18700 early again. Below 18600, 18400 will come fast.
bear case: 18400. Invalid above 18760. No ifs buts whatnots here. Weekly close below 18400 and next week will be a bull slaughter.
short term: Still Bearish - 18400ish was not hit today but if we hit it tomorrow, you read it here first.
medium-long term: My long term outlook stays bearish and I expect at least a -20% correction in 2024. Medium term is 17100 while I think we can touch the big bull trend line starting 2022-10 around 16700 in 2024. —unchanged
trade of the day: 18800 was clear resistance and shorting with a reasonable 20-30 point stop was an amazing trade today. Second best was the retest of the open for another short at the 1h 20ema.
