Bearish on the DollarBuy side liquidity was swept as price tapped into a 4H FVG. We have resting sell side liquidity below which may be the next draw om liquidity. This spells bullishness for XXXUSD pairs
Market indices

Dow Jones D1 | Overlap support at 50% Fibonacci retracementDow Jones (US30) is trading close to an overlap support and could potentially bounce off this level to climb higher.
Buy entry is at 43,330.55 which is an overlap support that aligns with the 50.0% Fibonacci retracement.
Stop loss is at 42,800.00 which is a level that lies underneath a pullback support and the 61.8% Fibonacci retracement.
Take profit is at 44,325.14 which is an overlap resistance that aligns with the 61.8% Fibonacci retracement.
High Risk Investment Warning
Trading Forex/CFDs on margin carries a high level of risk and may not be suitable for all investors. Leverage can work against you.
Stratos Markets Limited (www.fxcm.com):
CFDs are complex instruments and come with a high risk of losing money rapidly due to leverage. 63% of retail investor accounts lose money when trading CFDs with this provider. You should consider whether you understand how CFDs work and whether you can afford to take the high risk of losing your money.
Stratos Europe Ltd (www.fxcm.com):
CFDs are complex instruments and come with a high risk of losing money rapidly due to leverage. 63% of retail investor accounts lose money when trading CFDs with this provider. You should consider whether you understand how CFDs work and whether you can afford to take the high risk of losing your money.
Stratos Trading Pty. Limited (www.fxcm.com):
Trading FX/CFDs carries significant risks. FXCM AU (AFSL 309763), please read the Financial Services Guide, Product Disclosure Statement, Target Market Determination and Terms of Business at www.fxcm.com
Stratos Global LLC (www.fxcm.com):
Losses can exceed deposits.
Please be advised that the information presented on TradingView is provided to FXCM (‘Company’, ‘we’) by a third-party provider (‘TFA Global Pte Ltd’). Please be reminded that you are solely responsible for the trading decisions on your account. There is a very high degree of risk involved in trading. Any information and/or content is intended entirely for research, educational and informational purposes only and does not constitute investment or consultation advice or investment strategy. The information is not tailored to the investment needs of any specific person and therefore does not involve a consideration of any of the investment objectives, financial situation or needs of any viewer that may receive it. Kindly also note that past performance is not a reliable indicator of future results. Actual results may differ materially from those anticipated in forward-looking or past performance statements. We assume no liability as to the accuracy or completeness of any of the information and/or content provided herein and the Company cannot be held responsible for any omission, mistake nor for any loss or damage including without limitation to any loss of profit which may arise from reliance on any information supplied by TFA Global Pte Ltd.
The speaker(s) is neither an employee, agent nor representative of FXCM and is therefore acting independently. The opinions given are their own, constitute general market commentary, and do not constitute the opinion or advice of FXCM or any form of personal or investment advice. FXCM neither endorses nor guarantees offerings of third-party speakers, nor is FXCM responsible for the content, veracity or opinions of third-party speakers, presenters or participants.


only sellIt is still moving based on the analysis, when it hits the weekly floor, it is likely to move in the direction of the big arrow, maybe 47,000 will be available

USTEC index- A tradeable high probabilty setup formingHello,
USTEC, also known as the US Tech 100 or NASDAQ 100, is a widely traded stock index in the forex market. It tracks the performance of the top 100 non-financial technology-driven companies listed on the NASDAQ exchange, including major players from sectors such as information technology, healthcare, consumer discretionary, and telecommunications.
Currently, the index is in a corrective phase, setting up a high-probability buying opportunity. From a technical standpoint, we anticipate USTEC will approach the moving average, aligning with the lower boundary of the corrective pattern. Once this level is reached, we will seek confirmation through the MACD zero crossover—a strong bullish signal indicating an optimal entry for a move back to the top.
Additionally, upcoming tariff policies in the US could act as a catalyst, pushing prices toward our ideal entry zone.
You can access this CFD index using Tradenation or any other brokers that integrate with TradingView. www.tradingview.com

Dollar Index (DXY): Pullback From Resistance
I think we may see a local bearish continuation after a test
of a key daily/intraday resistance.
A local Change of Character on an hourly clearly shows the strength of the sellers.
The index may retrace at least to 106.53
❤️Please, support my work with like, thank you!❤️

USNAS100| BEARISH CONSOLIDATION AND POTENTIAL BREAKOUTHELLO TRADERS
Last week has concluded. The US NAS100 index experienced a sharp decline and stabilised below the previous support zone, currently trading within this zone and around the 21570 level. There is also the possibility of prolonged consolidation in this area.
Market conditions are expected to remain bearish as long as prices remain below the last resistance zone. Furthermore, the bearish trend will be confirmed if the price falls below the strong support at 21570, as evidenced by a closing 4-hour candle and a break of the channel.
Conversely, if there is a strong upward push that allows the index to surpass the last resistance zone, it could reach an all-time high (ATH) and potentially set a new record.
If this analysis makes sense to you, let me know in the comments! Also, feel free to share your perspective on the market .

NIfty forcastingnifty converting into 5 impulse wave formation which could result into nifty falling till 19000 levels. was long on nifty from 23300 levels, nifty turned bearish and instead of abc correction it formed into 5 impulse wave. now shorting it from 22600 levels. first target 21900 and second target 19000, after that a wave of correctional abc is expected where a base will be formed and monthly second wave will be completed.

US30-Bearish Momentum in Play as DowJones Drops Below Pivot ZoneUS30 Analysis – February 25, 2025
🔻 Bearish Momentum in Play as Dow Jones Drops Below Pivot Zone
US30 has continued its downward movement, as previously anticipated . The price remains below the pivot line (43,765) and has already tested the support at 43,350. However, to confirm further downside toward 42,770, the price must break below 43,212 with a 4H candle close.
🔹 Technical Outlook:
📉 Bearish Scenario:
As long as US30 remains below 43,760, the downward pressure is expected to continue.
A 4H candle close below 43,212 will confirm a bearish continuation toward 42,770.
📈 Bullish Reversal:
Stability above 43,212 will lead to a range-bound movement between 43,212 and 43,765 until a breakout occurs.
A 4H candle close above the pivot zone (43,765) is required for the bullish trend to resume.
Key Levels to Watch:
Resistance: 43,690 | 43,900 | 44,210
Pivot: 43,580
Support: 43,212 | 43,030 | 42,770
⚠️ Directional Bias:
Currently, US30 is consolidating within the 43,212 – 43,765 range. A break below 43,212 will confirm the bearish trend continuation.

Nasdaq market analysis: 25-Feb-2025Let’s dive into today's Nasdaq market analysis. Share insights, and potentially spot opportunities for good pips.

NDXDon't be misled by sharp Monday declines; these are often manipulative moves rather than genuine market shifts. Historically, such drops are followed by recoveries, and indicators suggest this week aligns with that pattern. The Nasdaq Composite shows potential for upward movement through April, possibly extending into September. However, projections for 2027 indicate increased volatility and potential downturns. For now, positioning bullishly through Thursday seems prudent. 📈🚀

Going long on HK50We are taking this position now because at 22760 because
1) H4 and D1 is uptrend
2) There is a M15 pattern
3) At strong support
4) M15 divergence
5) Previous day low
Target is the top 23500 which is about 700 pips away.

#023 Trust The Process HK33HKD 1328SGT 25022025HK33HKD in a obvious up trend, so, I buy.
Standard procedures which I and most traders past, present and future will be doing.
1325SGT 25022025

NAS100 Analysis: Key Levels & Bearish Trade Setup📊 NAS100 Analysis and Trade Idea | Key Levels & Bearish Bias Explained 📉
Dive into a detailed analysis of the NAS100 (NZ 100) with a focus on key support zones, retracement levels, and a bearish trading bias. Learn how to identify overextended price movements, imbalances, and potential short setups using the daily and 4-hour timeframes. Perfect for traders looking to refine their strategies in indices trading! 💡 💬 Share your thoughts and trading ideas in the comments below!

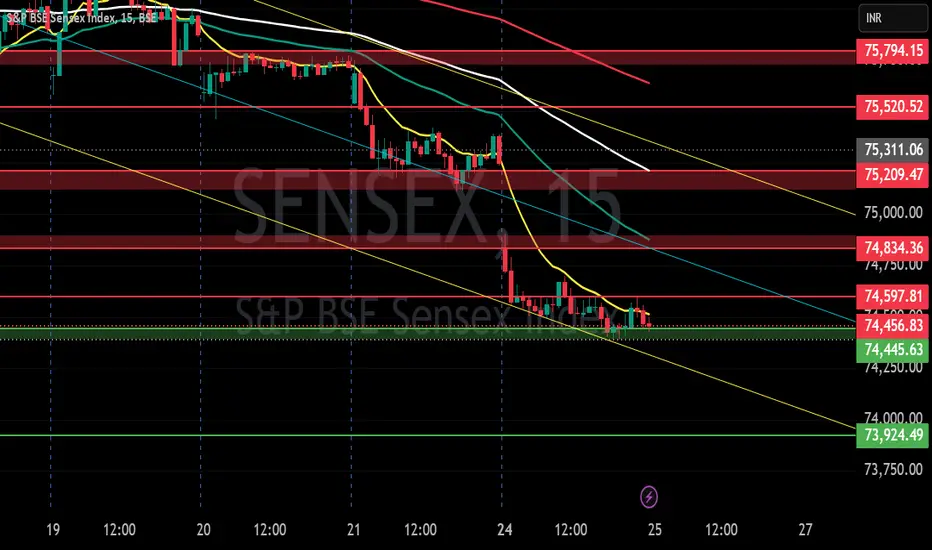
SENSEX S/R for 25/2/25Support and Resistance Levels:
Support Levels: These are price points (green line/shade) where a downward trend may be halted due to a concentration of buying interest. Imagine them as a safety net where buyers step in, preventing further decline.
Resistance Levels: Conversely, resistance levels (red line/shade) are where upward trends might stall due to increased selling interest. They act like a ceiling where sellers come in to push prices down.
Breakouts:
Bullish Breakout: When the price moves above resistance, it often indicates strong buying interest and the potential for a continued uptrend. Traders may view this as a signal to buy or hold.
Bearish Breakout: When the price falls below support, it can signal strong selling interest and the potential for a continued downtrend. Traders might see this as a cue to sell or avoid buying.
20 EMA (Exponential Moving Average):
Above 20 EMA(50 EMA): If the stock price is above the 20 EMA, it suggests a potential uptrend or bullish momentum.
Below 20 EMA: If the stock price is below the 20 EMA, it indicates a potential downtrend or bearish momentum.
Trendline: A trendline is a straight line drawn on a chart to represent the general direction of a data point set.
Uptrend Line: Drawn by connecting the lows in an upward trend. Indicates that the price is moving higher over time. Acts as a support level, where prices tend to bounce upward.
Downtrend Line: Drawn by connecting the highs in a downward trend. Indicates that the price is moving lower over time. It acts as a resistance level, where prices tend to drop.
Disclaimer:
I am not a SEBI registered. The information provided here is for learning purposes only and should not be interpreted as financial advice. Consider the broader market context and consult with a qualified financial advisor before making investment decisions.
MIDCAP NIFTY S/R for 25/2/25Support and Resistance Levels:
Support Levels: These are price points (green line/shade) where a downward trend may be halted due to a concentration of buying interest. Imagine them as a safety net where buyers step in, preventing further decline.
Resistance Levels: Conversely, resistance levels (red line/shade) are where upward trends might stall due to increased selling interest. They act like a ceiling where sellers come in to push prices down.
Breakouts:
Bullish Breakout: When the price moves above resistance, it often indicates strong buying interest and the potential for a continued uptrend. Traders may view this as a signal to buy or hold.
Bearish Breakout: When the price falls below support, it can signal strong selling interest and the potential for a continued downtrend. Traders might see this as a cue to sell or avoid buying.
20 EMA (Exponential Moving Average):
Above 20 EMA(50 EMA): If the stock price is above the 20 EMA, it suggests a potential uptrend or bullish momentum.
Below 20 EMA: If the stock price is below the 20 EMA, it indicates a potential downtrend or bearish momentum.
Trendline: A trendline is a straight line drawn on a chart to represent the general direction of a data point set.
Uptrend Line: Drawn by connecting the lows in an upward trend. Indicates that the price is moving higher over time. Acts as a support level, where prices tend to bounce upward.
Downtrend Line: Drawn by connecting the highs in a downward trend. Indicates that the price is moving lower over time. It acts as a resistance level, where prices tend to drop.
Disclaimer:
I am not a SEBI registered. The information provided here is for learning purposes only and should not be interpreted as financial advice. Consider the broader market context and consult with a qualified financial advisor before making investment decisions.

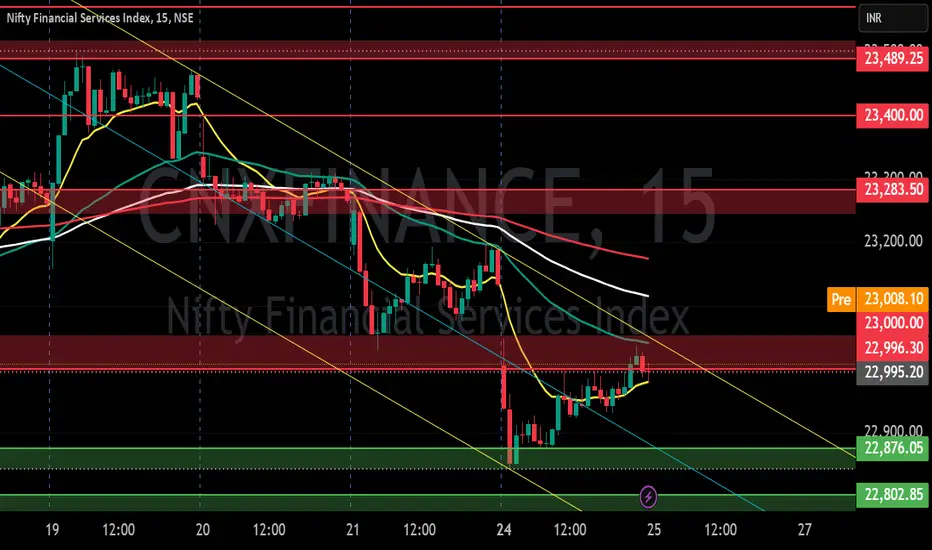
FIN NIFTY S/R for 25/2/25Support and Resistance Levels:
Support Levels: These are price points (green line/shade) where a downward trend may be halted due to a concentration of buying interest. Imagine them as a safety net where buyers step in, preventing further decline.
Resistance Levels: Conversely, resistance levels (red line/shade) are where upward trends might stall due to increased selling interest. They act like a ceiling where sellers come in to push prices down.
Breakouts:
Bullish Breakout: When the price moves above resistance, it often indicates strong buying interest and the potential for a continued uptrend. Traders may view this as a signal to buy or hold.
Bearish Breakout: When the price falls below support, it can signal strong selling interest and the potential for a continued downtrend. Traders might see this as a cue to sell or avoid buying.
20 EMA (Exponential Moving Average):
Above 20 EMA(50 EMA): If the stock price is above the 20 EMA, it suggests a potential uptrend or bullish momentum.
Below 20 EMA: If the stock price is below the 20 EMA, it indicates a potential downtrend or bearish momentum.
Trendline: A trendline is a straight line drawn on a chart to represent the general direction of a data point set.
Uptrend Line: Drawn by connecting the lows in an upward trend. Indicates that the price is moving higher over time. Acts as a support level, where prices tend to bounce upward.
Downtrend Line: Drawn by connecting the highs in a downward trend. Indicates that the price is moving lower over time. It acts as a resistance level, where prices tend to drop.
Disclaimer:
I am not a SEBI registered. The information provided here is for learning purposes only and should not be interpreted as financial advice. Consider the broader market context and consult with a qualified financial advisor before making investment decisions.
BANK NIFTY S/R for 25/2/25Support and Resistance Levels:
Support Levels: These are price points (green line/shade) where a downward trend may be halted due to a concentration of buying interest. Imagine them as a safety net where buyers step in, preventing further decline.
Resistance Levels: Conversely, resistance levels (red line/shade) are where upward trends might stall due to increased selling interest. They act like a ceiling where sellers come in to push prices down.
Breakouts:
Bullish Breakout: When the price moves above resistance, it often indicates strong buying interest and the potential for a continued uptrend. Traders may view this as a signal to buy or hold.
Bearish Breakout: When the price falls below support, it can signal strong selling interest and the potential for a continued downtrend. Traders might see this as a cue to sell or avoid buying.
20 EMA (Exponential Moving Average):
Above 20 EMA(50 EMA): If the stock price is above the 20 EMA, it suggests a potential uptrend or bullish momentum.
Below 20 EMA: If the stock price is below the 20 EMA, it indicates a potential downtrend or bearish momentum.
Trendline: A trendline is a straight line drawn on a chart to represent the general direction of a data point set.
Uptrend Line: Drawn by connecting the lows in an upward trend. Indicates that the price is moving higher over time. Acts as a support level, where prices tend to bounce upward.
Downtrend Line: Drawn by connecting the highs in a downward trend. Indicates that the price is moving lower over time. It acts as a resistance level, where prices tend to drop.
Disclaimer:
I am not a SEBI registered. The information provided here is for learning purposes only and should not be interpreted as financial advice. Consider the broader market context and consult with a qualified financial advisor before making investment decisions.

NIFTY S/R for 25/2/25Support and Resistance Levels:
Support Levels: These are price points (green line/shade) where a downward trend may be halted due to a concentration of buying interest. Imagine them as a safety net where buyers step in, preventing further decline.
Resistance Levels: Conversely, resistance levels (red line/shade) are where upward trends might stall due to increased selling interest. They act like a ceiling where sellers come in to push prices down.
Breakouts:
Bullish Breakout: When the price moves above resistance, it often indicates strong buying interest and the potential for a continued uptrend. Traders may view this as a signal to buy or hold.
Bearish Breakout: When the price falls below support, it can signal strong selling interest and the potential for a continued downtrend. Traders might see this as a cue to sell or avoid buying.
20 EMA (Exponential Moving Average):
Above 20 EMA(50 EMA): If the stock price is above the 20 EMA, it suggests a potential uptrend or bullish momentum.
Below 20 EMA: If the stock price is below the 20 EMA, it indicates a potential downtrend or bearish momentum.
Trendline: A trendline is a straight line drawn on a chart to represent the general direction of a data point set.
Uptrend Line: Drawn by connecting the lows in an upward trend. Indicates that the price is moving higher over time. Acts as a support level, where prices tend to bounce upward.
Downtrend Line: Drawn by connecting the highs in a downward trend. Indicates that the price is moving lower over time. It acts as a resistance level, where prices tend to drop.
Disclaimer:
I am not a SEBI registered. The information provided here is for learning purposes only and should not be interpreted as financial advice. Consider the broader market context and consult with a qualified financial advisor before making investment decisions.

A little dip? Just the market testing if the game still on!Hello everyone!
Sell on news?
www.tradingview.com
**Hong Kong stocks fell 315 points or 1.4% to 23,030 in Tuesday morning trade, marking the second session of sharp losses amid broad sector falls, notably consumers and tech.Traders retreated from riskier assets after the US intensified curbs on Chinese investments and proceeded with tariffs on Canada and Mexico.**
Is this piece of sh *** news helps in trading? 🤐 🤐 🤐
#sticktoyourplan
#trustwhatyoutrust
#followyourowntradingplan
Build your own #zentradingstrategy news can be distraction to your judgements!
Look at the HSI D Chart
Look at the 4H chart
PEPPERSTONE:HK50
The last Oct Hi @ 23241 has been broken hence retracement is not a surprised!
MACD - formed deadcross and curving down as marked in yellow circle.
KDJ - at bearish zone curving down.
BB - it broke down uptrende channel trading in lower BB channel
22990 support level turned resistance level now. If it able to break and stay above this level this week then this is a healthy pull back. Let's monitor.
Today Trade Plan: 22500-23250 (~830pts)
Buy into support : 22600 -22900 (TP :22950-23130)
Sell at resistance : 23000-23100 (TP: 22900-22930)
PEPPERSTONE:HK50
1h Chart
Check MACD & KDJ - wait for the reversal confirmation before taking your swing long position.
Monitor the 1H,4H movement with confirmation using MACD & KDJ indicator.
Set your tf, have your entry and exit plan!
Pay attention to the Goldencross/DeadCross; practice makes perfect.
Let's follow our own strategy and zen with 📙 and 🍵.
Happy Trading everyone!
Reminder : start to accumulate China & HKG for the potential upside for the year! All retracement is a good entry point.
HKEX:2800 - 22.90-22.82 add position
HKEX:2823 HKEX:2801 HKEX:3067
** Please Boost 🚀/LIKE 👍, FOLLOW ✅, SHARE 🙌 and COMMENT ✍ if you enjoy this idea!**

#NIFTY Intraday Support and Resistance Levels - 25/02/2025Slightly gap down opening expected in nifty. After opening if nifty starts trading below 22500 level then possible sharp downside of 150-200 points occurs in nifty. This downside rally can goes upto the 22300 level. Upside 22750 will act as a major resistance for today's session. Any upside rally can be reversal from this level.

[INTRADAY] #BANKNIFTY PE & CE Levels(25/02/2025)Today will be slightly gap down opening expected in banknifty near 48550 level. After opening if banknifty starts trading below 48450 level then possible strong downside rally in index towards the 48050 level. Any bullish side rally only expected if it's sustain above 48550 level. Upside 48950 level will act as a strong resistance. Any bullish side rally can be reversal from this level.

S&P500 | Historic Trends, Consolidation & Bull Flags [2030 END]I have been wanting to put my thoughts on the historic tends observed in the S&P500 in a post for some time and decided to focus this discussion on the relationship observed between S&P 500:
* Bull Flag runs (~17 to 25) years in length
* Consolidation Period (~13 to 15) years in length
* 27 Period (2 Monthly) SMA - Aqua Colored Line
* RSI
NOTE: Chart is looking at logarithmic price of the S&P500 on the 2 Monthly time period.
S&P 500 HISTORY | 27P(2M) SMA, CONSOLIDATION PERIOD & BULL FLAG RUNS SINCE 1943
The below images show 'Consolidation Periods' governed by 'Black Trend Lines', 'Bull Flags' (Orange / Navy / Aqua) governed by colored measured moves between these periods and the 27P(2M) SMA in Aqua.
Key Takeaways for Longterm Investors
Key take aways Looking at the S&P 500 from such a zoomed-out perspective:
* CONSOLIDATION: Periods of consolidation required investors to proactively manage their investment. A buy and hold approach left investors' money in limbo not doing a lot over these time periods. Investors who could identify the S&P was in a period of consolidation did well by selling at the upper and buying at the lower trend lines once they became apparent.
* BULL FLAG: Run periods rewarded the discipline 'Dimond hands' investor, providing key holds at the 27P(2M) SMA and future higher highs. A good strategy during these periods was to accumulate at the 27P(2M) SMA.
RSI ANALYSIS
As we are currently in a Bull Flag period for the S&P500 (Aqua Measured Moved), lets now look at the relationship between the RSI and price to identify key historic behavior which may be useful with current price behavior.
It is notable that historically the RSI tends to oscillate between rising and falling channels when exhibiting price Consolidation / Bull Flag price behavior.
Bull Flag (1943 to 1968) – 25 years
Focusing on the orange measured move or first Bull Flag period from approximately 1943 to 1968, observable characteristics include:
* At the consolidation period price break out, RSI continued to set higher highs until peaking (with the first lower high) at Point 1 - this marked approximately the halfway point of the bull run period.
* Retest and hold behavior with the 27P(2M) SMA for the entirety of the run
* End of bull run period and start of consolidation period confirmed with price breaking below and first candle open and close below the 27P(2M) SMA at Point 2 .
The Stochastic RSI has helped to identify if price is set to put in a higher low during bull flag periods and has been a reliable indicator in confluence with the 27P(2M) SMA.
Consolidation Period (1968 to 1983) – 15 Years
Consolidation period starts at the end of the prior bull flag and confirmed at Point 2 where price has broken below and opened and closed the first candle below the 27P(2M) SMA. This has been marked with the aqua vertical line on the chart.
Price is confirmed to have left the consolidation zone once it breaks to the upside of the black trend line (in some cases with a retest).
Change in price behavior from ranging to bullish within the consolidation period has been identifiable historically with a break above the 27P(2M) SMA followed up by a retest and holding the 27P(2M) SMA as support. Price has tended to range between the consolidation period trendlines until this price behavior is achieved.
The Stochastic RSI has helped to identify if price is set to put in a low during consolidation periods and has been a reliable indicator in confluence with the lower black trend line.
It is notable the Momentum Bias Index has printed RED bars on the histogram during all historic consolidation periods reviewed (2 in total) when the bottom of the consolidation period has been set.
Similar observations have been observed in the below two future consecutive Macro Bull Flag and Consolidation periods reviewed in this analysis.
Bull Flag (1983 to 2000) – 17 years
Consolidation Period (2000 to 2013) – 13 years
CURRENT PERIOD | WHERE ARE WE NOW? BULL FLAG TO FINISH IN 2030 ESTIMATION?
If the S&P 500 is to continue historic trend and continue consecutive Bull Flag / Consolidation periods, this would suggest the current bull flag run could end in 2030 and the next consolidation period would begin. This is based on the same bull flag measured move approach and estimations of the bull flag structures discussed in the prior bull flag / consolidation periods.
It is noted that the prior consolidation period (2000 to 2013) left this zone and peaked at the RSI high relatively early compared to prior periods. According to the review of other bull flags this suggests the middle part of the bull flag run occurred in 2015. It is unclear if this would result in a reduced bull flag period run and a material lower high than the measured moved.
It is also noted at current prices a retest and hold of the 27P (2M) SMA would result in a 30% drop. A move in the market of this magnitude would result in some interesting news headlines but historically would show nothing out of the ordinary for S&P500 price behaviour.
