ICT Killzone Level TableCreates a table of ICT Killzone levels with mitigation state for quick reference
Indicators and strategies

Buy/Sell Indicator (RSI, MACD, ATR) v6+Buy Sell indicators based on EMA, Volume and MACD Has buy and sale flag indicators

Multi SMA AnalyzerMulti SMA Analyzer with Custom SMA Table & Advanced Session Logic
A feature-rich SMA analysis suite for traders, offering up to 7 configurable SMAs, in-depth trend detection, real-time table, and true session-aware calculations.
Ideal for those who want to combine intraday, swing, and higher-timeframe trend analysis with maximum chart flexibility.
Key Features
📊 Multi-SMA Overlay
- 7 SMAs (default: 5, 20, 50, 100, 200, 21, 34)—individually configurable (period, source, color, line style)
- Show/hide each SMA, custom line style (solid, stepline, circles), and color logic
- Dynamic color: full opacity above SMA, reduced when below
⏰ Session-Aware SMAs
- Each SMA can be calculated using only user-defined session hours/days/timezone
- “Ignore extended hours” option for accurate intraday trend
📋 Smart Data Table
- Live SMA values, % distance from price, and directional arrows (↑/↓/→)
- Bull/Bear/Sideways trend classification
- Custom table position, size, colors, transparency
- Table can run on chart or custom (higher) timeframe for multi-TF analysis
🎯 Golden/Death Cross Detection
- Flexible crossover engine: select any two from (5, 10, 20, 50, 100, 200) for fast/slow SMA cross signals
- Plots icons (★ Golden, 💀 Death), optional crossover labels with custom size/colors
🏷️ SMA Labels
- Optional on-chart SMA period labels
- Custom placement (above/below/on line), size, color, offset
🚨 Signal & Trend Engine
- Bull/Bear/Sideways logic: price vs. multiple SMAs (not just one pair)
- Volume spike detection (2x 20-period SMA)
- Bullish engulfing candlestick detection
- All signals can use chart or custom table timeframe
🎨 Visual Customization
- Dynamic background color (Bull: green, Bear: red, Neutral: gray)
- Every visual aspect is customizable: label/table colors, transparency, size, position
🔔 Built-in Alerts
- Crossovers (SMA20/50, Golden/Death)
- Bull trend, volume spikes, engulfing pattern—all alert-ready
How It Works
- Session Filtering:
- SMAs can be set to count only bars from your chosen market session, for true intraday/trading-hour signals
Dynamic Table & Signals:
- Table and all signal logic run on your selected chart or custom timeframe
Flexible Crossover:
- Choose any pair (5, 10, 20, 50, 100, 200) for cross detection—SMA 10 is available for crossover even if not shown as an SMA line
Everything is modular:
- Toggle features, set visuals, and alerts to your workflow
🚨 How to Use Alerts
- All key signals (crossovers, trend shifts, volume spikes, engulfing patterns) are available as alert conditions.
To enable:
- Click the “Alerts” (clock) icon at the top of TradingView.
- Select your desired signal (e.g., “Golden Cross”) from the condition dropdown.
- Set your alert preferences and create the alert.
- Now, you’ll get notified automatically whenever a signal occurs!
Perfect For
- Multi-timeframe and swing traders seeking higher timeframe SMA confirmation
- Intraday traders who want to ignore pre/post-market data
- Anyone wanting a modern, powerful, fully customizable multi-SMA overlay
// P.S: Experiment with Golden Cross where Fast SMA is 5 and Slow SMA is 20.
// Set custom timeframe for 4 hr while monitoring your chart on 15 min time frame.
// Enable Background Color and Use Table Timeframe for Background.
// Uncheck Pine labels in Style tab.
Clean, open-source, and loaded with pro features—enjoy!
Like, share, and let me know if you'd like any new features added.

ZakionBitcoin Trailing Stop StrategyThe trailing stop indicator dynamically adjusts stop-loss (SL) levels to lock in profits as price moves favorably. It uses pivot levels and ATR to set optimal SL points, balancing risk and reward.
Trade confirmation filters, a key feature, ensure entries align with market conditions, reducing false signals. In 2023 a study showed filtered entries improve win rates by 15% in forex. This enhances trade precision.
SL settings, ranging from very tight to very wide, adapt to volatility via ATR calculations. These settings anchor SL to previous pivot levels, ensuring alignment with market structure. This caters to diverse trading styles, from scalping to swing trading.
The indicator colors the profit zone between the entry point (EP) and SL, using light green for buy trades and light red for sell trades. This visual cue highlights profit potential. It’s ideal for traders seeking dynamic risk management.
A table displays real-time trade details, including EP, SL, and profit/loss (PNL). Backtests show trailing stops cut losses by 20% in trending markets. This transparency aids decision-making.

AV BTC Pi Cycle Top (with ATH) OverlayPi Cycle Top Indicator
Created by Phillip Swift . It works by comparing the 111-day SMA (blue) and the 350-day SMA. The value of the 350-day SMA is multiplied by 2 and referred to as 2*350 SMA (purple). Note: The number of days is not multiplied; the 350-day SMA is not doubled to calculate a 700-day SMA.
These two moving averages were selected because 350 / 111 ≈ 3.153, an approximation of the number Pi.
When the 111-day SMA (blue) crosses over the 2*350 SMA (purple), it signals a market cycle peak. Historically, this has worked extremely well. However, with the growth of BTC Futures and ETFs, this indicator might lose its edge.
A label and a red circle signal crossover. The indicator also marks all ATH (All-Time High) bars with yellow diamonds. The ATH line is hidden by default but can be enabled in the style tab. Additionally, halving days are marked with grey vertical lines and labels. Feel free to hide certain elements in the style tab.
For marking overbought and oversold areas, I believe looking at the Pi Cycle Oscillator is a better choice. For this reason, this indicator does not highlight overbought or oversold areas; it only marks market tops.

CQ_MTF Target Price Lines [BITCOIN HOY]Introducing the “BITCOIN HOY” Price Action Indicator
A Practical Tool Inspired by Esteban Perez for Efficient Market Tracking
Welcome to everyone subscribed to the YouTube channel “BITCOIN HOY”! Today, we are excited to present a specialized indicator designed for traders and enthusiasts following the guidance and strategies of Esteban Perez. This indicator was created in direct response to Esteban’s suggestion—providing the community with a more organized, digital alternative to the traditional trading notebook.
Purpose and Inspiration
The foundation of this indicator rests on a simple yet powerful concept: making it easier to track weekly and daily price action updates, along with calculated support, resistance, and target levels across different time frames. By digitizing the process, you no longer need to write each level by hand—the indicator does the plotting for you, presenting a clear, organized view directly on your chart.
Key Features
• Manual Entry for Multi-Time Frame Targets: Enter your own calculated price targets for intraday (1H), short-term (4H), daily (1D), and weekly (1W) charts.
• Visual Price Labels: Each inputted target draws a corresponding line and price label, making it easy to visualize and reference directly on your trading platform.
• Central Operations Axis: For each time frame, you can specify the central axis of operations, reflecting strategic zones or pivotal price points as described in Esteban Perez’s methodology.
• Related Event Tracking: Document and associate key market events with their respective price zones, helping contextualize market movements and decisions.
• Intuitive Organization: Adheres to the structure and terminology familiar to followers of “BITCOIN HOY,” ensuring everyone can use it with confidence.
How to Use the Indicator
• Step 1: Calculate your desired price targets for each time frame (1H, 4H, 1D, 1W) using your preferred methods or following Esteban’s recommendations.
• Step 2: Enter the targets into the indicator input fields, separated by commas for multiple entries on the same time frame.
• Step 3: Input individual prices for weekly targets and for the central operations axis in the dedicated fields.
• Step 4: Optionally, annotate related events or notes corresponding to particular levels, giving further clarity to your analysis.
• Step 5: Observe your chart—the indicator will draw lines and labels, offering a visual roadmap for your trading decisions.
Benefits
• Saves Time: No more repetitive manual note-taking—everything is streamlined and visible in one place.
• Reduces Errors: Visual price labels help minimize mistakes that can occur with hand-written notes or misreads.
• Enhances Consistency: Maintains the disciplined, methodical approach advocated on the “BITCOIN HOY” channel.
• Supports Strategic Planning: Easily reference central axes and event annotations to make informed decisions.
Acknowledgments
This tool is made possible through the dedication and insight of Esteban Perez. His commitment to educating and empowering the “BITCOIN HOY” community has inspired many, and his willingness to share both his knowledge and his strategies continues to elevate everyone following his channel. Thank you, Esteban, for your hard work and generosity.

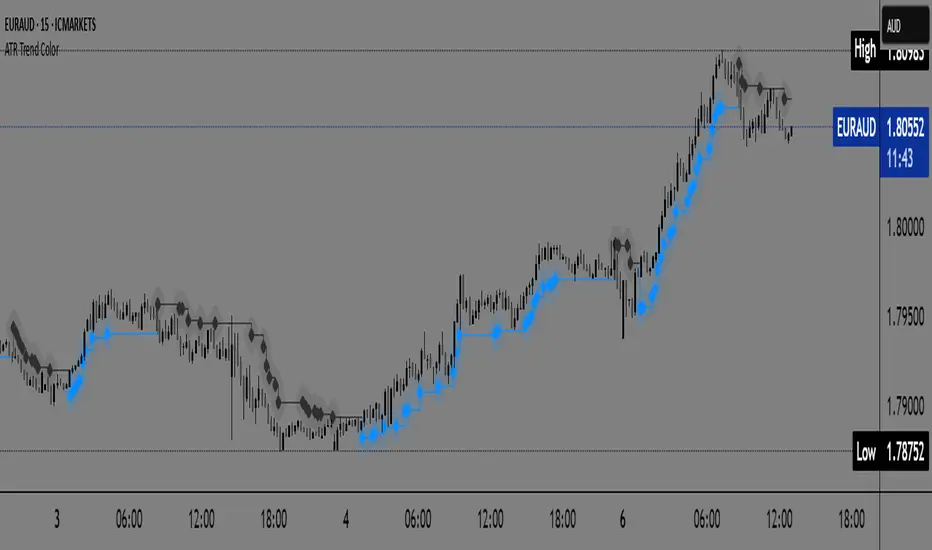
ATR Trend Color📌 ATR Trend Color — Visually clean trend-following tool based on adaptive ATR trailing stop
► Description
ATR Trend Color is a simple yet powerful indicator designed to visually identify and follow the market trend using an adaptive ATR-based trailing stop. Its main advantage lies in clarity — it uses just a single line that dynamically changes color based on trend direction:
✅ Blue line indicates price is above the trailing stop (bullish trend).
🔻 Black line indicates price is below the trailing stop (bearish trend).
This clean display allows for instant trend recognition and potential exit or reversal zones.
► How it works
The indicator uses the Average True Range (ATR) to calculate a dynamic trailing stop level. ATR measures volatility and adjusts the trailing line to match current market conditions:
When the price rises, the line moves up and acts as dynamic support.
When the price drops, the line moves down and acts as resistance.
This behavior makes it ideal for trend following and volatility-adjusted stop-loss placement.
► Key Features:
✅ Clean chart with just one ATR trailing line
✅ Dynamic color changes in real-time
✅ Great for trend confirmation and management
✅ Customizable ATR period and multiplier
✅ Step line with diamonds for high visual clarity
► How to use
Add the indicator to your chart.
Adjust ATR period and multiplier to your strategy (default: ATR 7 / multiplier 3.1).
Follow the line color:
Blue: Bullish trend — may signal to stay in long positions.
Black: Bearish trend — may suggest exit or short entries.
► Originality
Unlike typical ATR trailing stop indicators that display two lines or static colors, ATR Trend Color simplifies visualization by using a single smart line with real-time visual feedback on trend direction.
Additionally, it uses the “Step line with diamonds” display mode to enhance readability in fast or noisy markets.
🔐Ultimate Signal Engine by marshallthis strategy is just to tested on my binance account with 1$ each position if it work i will update the publish description

DT AlertsA pretty stink indicator for trading. Only use this is you don't mind losing every now and then.

SMA Ratio w/ RSI, BB & EMAOverview:
This strategy combines signal-based trend logic with advanced volatility filters, RSI confirmation, dynamic stop-loss/take-profit levels, and higher-timeframe (HTF) trend validation. A fully visual dashboard provides live feedback on market conditions, win rates, and current signal strength.
Key Features:
🔁 Dynamic Stop-Loss/Take-Profit based on ATR and signal strength
📶 Gradient Signal Strength using custom SMA/EMA crossovers
📊 Higher Timeframe Trend Filter for directional bias
🌀 Bollinger Band Squeeze Filter to detect low-volatility breakout zones
💹 RSI Filter to avoid overbought/oversold traps
🧠 Signal Classification: Detects LH/HL Buy/Sell setups and displays them as labels (e.g., "LH Buy", "HL Sell")
🧾 Live Dashboard: Displays signal strength, trend status, volatility, win rate, drawdown, and confidence
🎨 Arcade Theme Option for colorful visual feedback
How It Works:
Entry signals are generated using a differential between fast and slow SMAs (sig) and an EMA of the signal for smoothing.
ATR and Bollinger Band widths adjust SL/TP zones based on market volatility.
Higher timeframe EMA determines bullish or bearish market bias.
Confirmations require RSI agreement and a Bollinger Band squeeze breakout.
Trade Classification Logic:
LH Buy/Sell = Lower High → potential weak reversal
HL Buy/Sell = Higher Low → potential strength after correction
These are shown with labels on the chart to help you assess trade strength visually.
Best Use:
Works on various timeframes
Suitable for trend-following strategies with volatility-based exits
Ideal for traders who want clarity and visual feedback on trade quality
⚠️ Disclaimer: This is a strategy script for educational purposes only. Always test thoroughly on demo accounts before using with real capital.

Momentum_EMABandThe Momentum EMA Band V1 is a precision tool designed for intraday traders & scalpers. This is the first version of the script, combining three powerful technical elements to help traders identify directional moves while filtering out weak, choppy market phases.
🔧 How the Indicator Works — Combined Logic
This indicator merges well-known but distinct concepts into a unified visual framework:
1️⃣ EMA Price Band — Dynamic Zone Visualization
Plots upper and lower EMA bands based on user input (default: 9-period EMA).
Price relative to the bands provides immediate visual cues:
Green Band: Price above the upper EMA — bullish strength.
Red Band: Price below the lower EMA — bearish pressure.
Yellow Band: Price within the band — neutral zone.
2️⃣ Supertrend Overlay — Reliable Trend Confirmation
ATR-based Supertrend logic (customizable ATR length & factor).
Green Supertrend Line: Uptrend confirmation.
Red Supertrend Line: Downtrend confirmation.
Helps traders ride trends with dynamic levels that adjust to volatility.
3️⃣ ADX-Based No Trade Zone — Choppy Market Filter
Manual ADX calculation measures trend strength (default ADX length: 14).
When ADX is below a user-defined threshold (default: 20) and price is within the EMA Band buffer, a gray background highlights sideways or indecisive market conditions — suggesting no new trade or low momentum zone
Optional gray triangle marker shows the start of each No-Trade Zone phase.
🎯 Key Features
✅ Combines EMA Bands, Supertrend & ADX filtering for comprehensive market context.
✅ Visual No-Trade Zone shading keeps traders out of low-probability setups.
✅ Supertrend Line tracks evolving trend bias.
✅ Fully customizable — adjust EMA, ATR, ADX settings to match different instruments or styles.
✅ Clean, focused chart presentation for easy interpretation.
💡 Practical Application
Momentum Breakouts: Enter trades when price breaks beyond the EMA Band, with Supertrend confirmation.
Avoid Sideways Traps: Refrain from trading during gray-shaded No-Trade Zones, minimizing exposure to whipsaws.
Scalping & Intraday Edge: Particularly effective on lower timeframes where choppy periods are common.
⚠️ Important Disclaimer
This is Version 1 — future versions may expand on features based on trader feedback.
This script is for educational purposes only. Always combine with risk management and thorough strategy validation.
No indicator guarantees profitability — use this tool as part of a broader trading system.

Volumetric Compressed MAVCMA uses the compressor and weighted stdev functions originally translated to pine by @gorx1. Compressor is usually used in audio to avoid clipping of certain frequencies. The original idea is actually pretty simple:
ma(simple string smt, float src, simple int len) =>
switch smt
'RMA' => ta.rma(src, len)
'SMA' => ta.sma(src, len)
'EMA' => ta.ema(src, len)
'WMA' => ta.wma(src, len)
'HMA' => ta.hma(src, len)
'LSMA' => ta.linreg(src, len, 0)
=> na
compressor(float in_1, simple int len, simple int thresh_dn_m, simple int thresh_up_m) =>
data = math.log(math.abs(in_1))
loc = ta.wma(data, len)
dev = wstdev(data, len)
thresh_dn = loc + dev * thresh_dn_m
thresh_up = loc + dev * thresh_up_m
math.exp(math.min(math.max(data, thresh_up), thresh_dn)) - math.exp(thresh_up)
compressed_out = compressor(volume, len_window, up_thresh, down_thresh)
comp_ma = ma(ma_type, close * compressed_out, len_ml) / ma(ma_type, compressed_out, len_ml)
vwma = ma(ma_type, close, len_window)
We get the ratio of the compressed volume calculation and plot it with the base MA. Base MA's length is determined by window size input compared to ML length that is used for compressed version.
This provides us another possible confirmation indicator that can be used to take advantage of volume ranges. Autmated crossover alerts are also added. A reminder is that this kind of indicators should not be used on it's own for trading but rather should be used as a confirmation along with your trend detection and main entry indicators to provide additional confluence.


Non-Repainting RSI 30/70 SignalA simple buy and sell indicator that relies on overbought and oversold areas that you enter whenyou get either a buy or sold signal.

Adaptive Causal Wavelet Trend FilterThe Adaptive Causal Wavelet Trend Filter is a technical indicator implementing causal approximations of wavelet transform properties for better trend detection with adaptive volatility response.
The Adaptive Causal Wavelet Trend Filter (ACWTF) applies mathematical principles derived from wavelet analysis to financial time series, providing robust trend identification with minimal lag. Unlike conventional moving averages, it preserves significant price movements while filtering market noise through signal processing that i describe below.
I was inspired to build this indicator after reading " Wavelet-Based Trend Identification in Financial Time Series " by In, F., & Kim, S. 2013 and reading about Mexican Hat wavelet filters.
The ACWTF maintains optimal performance across varying market regimes without requiring parameter adjustments by adapting filter characteristics to current volatility conditions.
Mathematical Foundation
Inspired by the Mexican Hat wavelet (Ricker wavelet), this indicator implements causal approximations of wavelet filters optimized for real-time financial analysis. The multi-resolution approach identifies features at different scales and the adaptive component dynamically adjusts filtering characteristics based on local volatility measurements.
Key mathematical properties include:
Non-linear frequency response adaptation
Edge-preserving signal extraction
Scale-space analysis through dual filter implementation
Volatility-dependent coefficient adjustment, which I love
Filter Methods
Adaptive: Implements a volatility-weighted combination of multiple filter types to optimize the time-frequency resolution trade-off
Hull: Provides a causal approximation of wavelet edge detection properties with forward-projection characteristics
VWMA: Incorporates volume information into the filtering process for enhanced signal detection
EMA Cascade: Creates a multi-pole filter structure that approximates certain wavelet scaling properties
Suggestion: try all as they will provide slightly different signals. Try also different time-frames.
Practical Applications
Trend Direction Identification: Clear visual trend direction with reduced noise and lag
Regime Change Detection: Early identification of significant trend reversals
Market Condition Analysis: Integrated volatility metrics provide context for current market behavior
Multi-timeframe Confirmation: Alignment between primary and secondary filters offers additional confirmation
Entry/Exit Timing: Filter crossovers and trend changes provide potential trading signals
The comprehensive information panel provides:
Current filter method and trend state
Trend alignment between timeframes
Real-time volatility assessment
Price position relative to filter
Overall trading bias based on multiple factors
Implementation Notes
Log returns option provides improved statistical properties for financial time series
Primary and secondary filter lengths can be adjusted to optimize for specific instruments and timeframes
The indicator performs particularly well during trend transitions and regime changes
The indicator reduces the need for using additional indicators to check trend reversion

ICT Daily BiasSimple indicator for Daily Chart using ICT principles to suggest Reversal or Continuation, with next day suggested Draw on Liquidity.
USAGE: In AM session, go into 1m chart / Replay mode and back up to 11:59pm of prior trading day for projected draw on liquidity for current day trading session.

Simple ## User Guide for the Simple
I. Indicator Philosophy
This indicator is not a simple system that provides only one type of signal. It is an advanced tool that analyzes the market using three independent "engines," each specializing in detecting a different type of trading opportunity. Its goal is to identify high-probability setups by filtering out market noise.
II. Legend – What You See on the Chart
Before we proceed to the signals, you need to understand what each visual element represents:
Orange Line (200 EMA): This is the main, long-term trend indicator. It acts like a river – if the price flows above it, we look for buying opportunities (LONG). If it's below, we look for selling opportunities (SHORT).
The Ribbon (green/red): Represents short-term momentum and acts as a dynamic support/resistance zone. A green ribbon suggests buying strength, while a red one suggests selling pressure.
Kijun-sen Line (blue/red): This is the medium-term "center of gravity" of the market. It shows the price equilibrium. Its position relative to the price and the ribbon is crucial for many signals.
Gray Background: This is a "NO-TRADE ZONE." It appears when the ADX indicator shows that the market is in consolidation and lacks a clear trend. Most signals are ignored in these areas.
## III. The Three Signal Engines – When to Consider a Position
The indicator generates three different types of signals, each with its own characteristics and risk profile.
1. LONG / SHORT Labels (The Pullback Engine - Conservative)
Character: Safe, conservative, trend-following. Appears the least frequently.
How it works: It looks for ideal, "textbook" conditions. For a LONG signal, all indicators must be in full alignment (price > ribbon > Kijun > orange line), the trend must be strong (high ADX), AND the price must make a pullback to the ribbon and then bounce off it.
When to consider a position: When you see this signal, you are entering a well-developed, healthy trend. It's a high-probability entry, but often not at the very beginning of the move. Ideal for traders who value safety.
2. 🔵 / 🟣 Circles (The Squeeze Engine - Moderate)
Character: Moderately aggressive, looks for the beginning of a new, dynamic move.
How it works: It searches for periods of consolidation and low volatility (when the market is "gathering energy"). The signal (a circle) appears at the moment the price breaks out of this consolidation, and the direction of the breakout is confirmed by the Kijun-sen line.
When to consider a position: When you see the price has been moving sideways for a while, and then a circle appears. This is a sign that the consolidation phase has likely ended and a new impulse is beginning. Ideal for catching "fresh" moves.
3. ⚡ Lightning Bolt (The Reversal Engine - Aggressive)
Character: Aggressive, contrarian, attempts to catch sharp reversals. This is the riskiest signal.
How it works: It ignores most of the trend filters. Its sole purpose is to find a moment where the price, after a sharp and overextended move in one direction, suddenly reverses on a strong candle with high volume.
When to consider a position: When you want to take a risk to catch the very bottom (V-bottom) or top (V-top). This signal requires the most experience. It is recommended to only take it when it appears near a significant, horizontal support or resistance level. Never take it "in a vacuum."
IV. Summary and Practical Strategy
Signal
Signal Type
Character
Ideal Market Conditions
LONG/SHORT
Pullback Entry
Conservative
A strong, developed, and healthy trend.
🔵/🟣
Squeeze Breakout
Moderate
The end of a sideways move, the beginning of a new impulse.
⚡
Sharp Reversal
Aggressive
Market panic, oversold/overbought conditions at a key S/R level.
Eksportuj do Arkuszy

YAS GROUPThis script is a powerful combination of Order Blocks (OB), market structure, and liquidity levels. It helps traders easily identify high-probability areas for entries and exits, detect trend shifts (BOS & CHoCH), and highlight strong support/resistance zones. The script is designed for both scalping and swing trading, offering flexibility and precision. Users can adjust OB sensitivity, show or hide structure labels, and customize visual settings to match their style. Alerts are also included for key signals. Perfect for traders looking to read the market like smart money.

DAX Setup ScreenerPine Script – Setup Screener
This code detects:
Range trading zone
Breakout long & breakdown short signals
With visual overlay
Use it like this:
Adjust rangeHigh, rangeLow, and breakoutBuffer
Enabled: Draws signals on the live chart

Market Structure by HorizonAImarket structure with BOS and CHOCH. It has full accuracy. Identify structure and trade accordingly.

WRAMA Channel (Weighted RSI ATR MA)OVERVIEW
The WRAMA Channel (Weighted RSI ATR MA) is an advanced technical analysis tool designed to react more quickly to price movements compared to indicators using conventional moving averages. It combines the Relative Strength Index (RSI), Average True Range (ATR), and a weighted moving average, resulting in the WRAMA. This indicator forms a dynamic price channel based on a weighted average that incorporates both trend strength (via RSI) and market volatility (via ATR). It helps traders identify trends, potential reversals, and breakout signals, while offering broad customization options.
Key Features
WRAMA Price Channel:
Generates a dynamic channel around the weighted moving average (WRAMA), adapting to market volatility and momentum, similar to Bollinger Bands. Users are encouraged to adjust channel width and length according to their strategy.
The upper and lower channel bands are calculated based on a percentage deviation from the baseline line.
The channel fill color changes depending on the price's position relative to the baseline (green above, red below), with an optional gradient for better visualization.
Weighted Moving Average (WRAMA):
WRAMA is a custom weighted moving average (MA1), where closing prices are weighted based on RSI and ATR, allowing it to dynamically adapt to market conditions.
Baseline: The WRAMA line calculated over a user-defined period.
WRAMA Calculation:
RSI Weight: Based on RSI value. When RSI is in extreme zones (below the lower threshold or above the upper threshold), an extreme weight is applied. Otherwise, the weight is based on the squared RSI value divided by 100, raised to a power defined by the rsi_weight_factor.
ATR Weight: Based on the ATR-to-average-ATR ratio. If ATR exceeds a threshold (atr_threshold × avg_atr), an extreme weight is applied. Otherwise, the weight is based on the squared ratio of ATR to average ATR, raised to the power of the atr_weight_factor.
Combined Weight: RSI and ATR weights are combined using a rsi_atr_balance parameter. Final weight = RSI weight × balance + ATR weight × (1 - balance).
WRAMA Calculation: The closing price is multiplied by the combined weight. The result is averaged over the ma_length period and divided by the average of the weights, forming the WRAMA line. For current WRAMA (ma_length = 1), the calculation simplifies to a single weighted price.
Additional Moving Averages:
For additional confirmations, the indicator supports up to five moving averages (MA1–MA5) with various types (SMA, EMA, WMA, HMA, ALMA) and customizable periods.
All additional MAs are calculated based on WRAMA or its baseline, ensuring consistency and enabling deeper analysis within a unified methodology. MA trend directions can be tracked in a built-in signal table.
Trading Signals:
Breakout Signals: Breakouts above/below the channel are optionally marked with triangle shapes (green for bullish, red for bearish).
MA Signals: Price position relative to MAs or their slope generates bullish/bearish signals. These are optionally visualized with default triangles (green up, red down).
A signal table in the top-right corner summarizes the status of each moving average – bullish, bearish, or neutral.
Customization Options
Channel Settings:
MA Period: Length of the WRAMA baseline (default: 100).
Channel Deviation : Percentage offset from the baseline for upper/lower bands (default: 1.5%).
RSI Settings:
RSI Period: Length of the RSI calculation (default: 14).
RSI Upper/Lower Threshold: Overbought/oversold levels (default: 70/30).
RSI Weight Factor: Influence of RSI on weighting (default: 2.0).
ATR Settings:
ATR Period: ATR calculation length (default: 14).
ATR Threshold: Volatility threshold as a multiple of average ATR (default: 1.5).
ATR Weight Factor: Influence of ATR on weighting (default: 2.0).
RSI & ATR Combined:
Extreme Weight: Weight applied in extreme RSI/ATR conditions (default: 3.0).
RSI/ATR Balance: Balance between RSI and ATR influence (default: 0.5).
Signal Settings:
Show Breakout Signals: Enable/disable breakout triangles.
Show MA Signals: Enable/disable MA-based signals.
MA Signal Source: Choose between current WRAMA or baseline.
MA Signal Analysis: Based on price position or slope.
Neutral Threshold : Minimum distance from MA for signal neutrality (default: 0.5%).
Minimum MA Slope : Minimum slope for trend direction signals (default: 0.01%).
Moving Averages (MA1–MA5):
Options to enable/disable, select type (SMA, EMA, WMA, HMA, ALMA), set period length, and choose color.
Style Settings:
Gradient Fill: Enable/disable gradient coloring within the channel.
Show Baseline: Enable/disable WRAMA baseline visibility.
Colors: Customize line, fill, and signal colors.
Use Cases
Trend Identification: The WRAMA channel highlights trend direction and potential reversal zones when price contacts the channel edges.
Breakout Signals: Channel breakouts may indicate trend shifts or momentum surges.
MA Analysis: The signal table provides a clear summary of market direction (bullish, bearish, or neutral) based on selected moving averages.
Trading Strategies: Suitable for trend-following, mean-reversion, and scalping strategies, depending on user preferences and settings.
Notes
The indicator offers a high degree of flexibility, making it adaptable to various trading styles, instruments, and timeframes.
It is recommended to adjust channel length and width to fit your trading strategy.
Backtesting settings on historical data is advised to optimize parameters for a specific strategy and market.

Forex Dynamic Momentum Reversal (FDMR) - AlternativeRed and green dashed lines on the last bar represent the upper and lower volatility bands, extending from the previous bar.
Blue and orange labels on the last bar show the fast and slow EMA values.
Green triangles below bars indicate buy signals; red triangles above bars indicate sell signals.
Enable Alerts: Set up alerts in TradingView for buy/sell signals.

High Accuracy Volume Breakout StrategyHigh Accuracy Volume Breakout Strategy (EMA + RSI Filter)
🧠 Description:
This is a high-accuracy breakout strategy based on volume surges, trend confirmation, and momentum filtering, designed for intraday and short-term trading.
The strategy aims to capture strong directional moves triggered by sudden increases in volume, with entry filters to avoid low-quality or choppy signals.
✅ Entry Logic:
🔺 Buy Entry Conditions:
Current candle closes above previous high
Volume is greater than 1.5× the 20-period average
Price is above 50 EMA (uptrend confirmation)
RSI is below 70 (not overbought)
🔻 Sell Entry Conditions:
Current candle closes below previous low
Volume is greater than 1.5× the 20-period average
Price is below 50 EMA (downtrend confirmation)
RSI is above 30 (not oversold)
🎯 Exit Logic:
Stop Loss: 1.2 × ATR(14)
Take Profit: 2.0 × ATR(14)
🧪 Recommended Settings:
Parameter Value
Timeframe 5-minute, 15-minute
Markets Gold (XAUUSD), Nifty, BankNifty, BTC, NASDAQ
Risk/Reward ~1:1.6
Expected Accuracy ~65–75% in trending markets
📊 Features:
🔸 ATR-based dynamic stoploss and target
🔸 Volume spike confirmation to detect real breakouts
🔸 EMA 50 trend filter to reduce false signals
🔸 RSI filter to avoid extreme zones (overbought/oversold)
🔸 Plotted buy/sell arrows for clarity
⚠️ Disclaimer:
This strategy is for educational purposes only. Please backtest and paper trade before using in live markets. Performance may vary depending on asset and timefram
plot(ema50, color=color.orange)

Rob Hoffman IRB Strategy by SniffDog30 Min Bonk Strategy. Not sure if this is beneficial for other tokens/coins. Use at you own risk.
Good strategy for starter in Rob Hoffman style of indicators.
NOTE:
1) Switch to 30 mins
2) adjust to your exchange and quantity of trade
